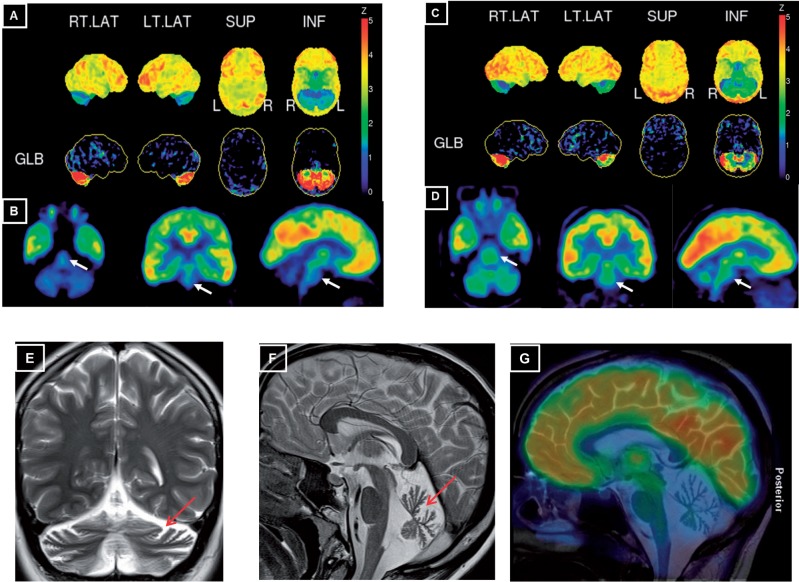
Figure 5.
Cerebral 18 F- FDG PET and MRI in exemplary SYNE1 patients. ( A and C ) Surface projections of the 18 F-FDG PET scans of Patient 10-1 at age 37 years ( A ) and Patient 9-1 at age 45 years ( C ). The upper rows in A and C show the surface projection map of cerebral glucose metabolism normalized to the maximum of the acquisition. The lower rows show the deviation of an age-adjusted normal database after normalization to a global mean calculation (GLB) of metabolic activity. On both projections, a marked homogenous bilateral reduction of cerebellar FDG metabolism can be seen in both subjects. ( B and D ) Tomographic projections after automated fitting. For both Patient 10-1 ( B ) and Patient 9-1 ( D ) a reduction of FDG-metabolism is also clearly visible in the brainstem (white arrows), which reached statistical significance in Patient 10 with a Z-score of 3 and a trend in Patient 9-1 with a Z-score of 1.5 (semiquantitative PET, deviation after normalization to the global mean). ( E and F ) T 2 -weighted MRI scans in Patient 18-1 at age 21 years shows marked vermian atrophy ( F ) and cortical hemisphere atrophy ( E ) of the cerebellum (red arrows). ( G ) Fusion image of 18 F-FDG PET scan of Patient 10-1 onto a central paramedian sagittal T 2 -weighted MRI scan shows considerable hypometabolism in the cerebellum and in the pons, whereas FDG metabolism is normal in the cortical cerebral regions.

