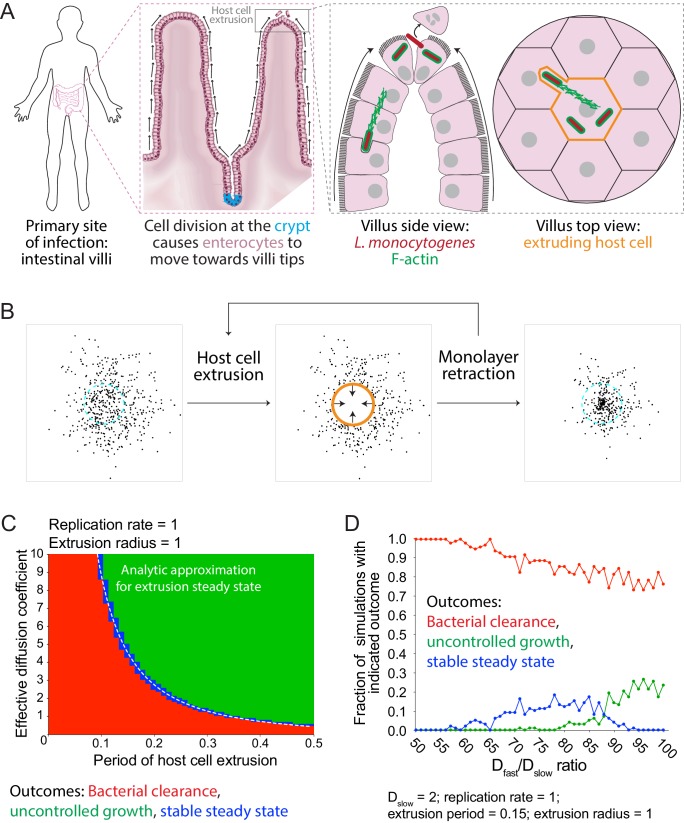
Figure 5. Simulations predict that heterogeneous spread increases the chance of a persistent L. monocytogenes infection in the intestinal epithelium.
(A) Schematic of the topology of the intestinal epithelium and L. monocytogenes cell-to-cell spread originating at the tip of intestinal villi. Image of intestinal villi was adapted from ‘Structure of villi and microvilli present on the epithelial cells of the small intestine.’ https://commons.wikimedia.org/wiki/File:Esquema_del_epitelio_del_intestino_delgado.png. License: CC BY-SA 4.0. Villus side view image was adapted from Figure 3 of Pizarro-Cerdá et al. (2012). (B) Schematic of the steps of the host cell extrusion simulation. Host cell boundary of next cell to be extruded is depicted as a cyan dashed line. Extruding host cell is depicted as an orange boundary. Black arrows inside host cell in the second panel indicate monolayer retraction after extrusion. (C) Phase diagram of simulated data depicting the outcomes of host cell extrusion random walk simulations with only a single effective diffusion coefficient (no pioneers) for different combinations of host cell extrusion periods and effective diffusion coefficients. A total of 100 simulations were run for each combination. For these simulated data, the radius of extrusion equals 1, and the bacterial replication rate equals 1. Units are normalized by the replication rate, 0.006 min−1, and radius of an extruded cell, 7 µm (Ho et al., 2017). The white dashed line represents the analytic approximation for extrusion steady state. (D) Simulated data showing the outcomes of host cell extrusion simulations where extrusion period equals 0.15, extrusion radius equals 1, Dslow equals 2, and Dfast varies. Vertical axis depicts the fraction of simulations with indicated outcome for 100 simulations per value of Dfast/Dslow ratio.
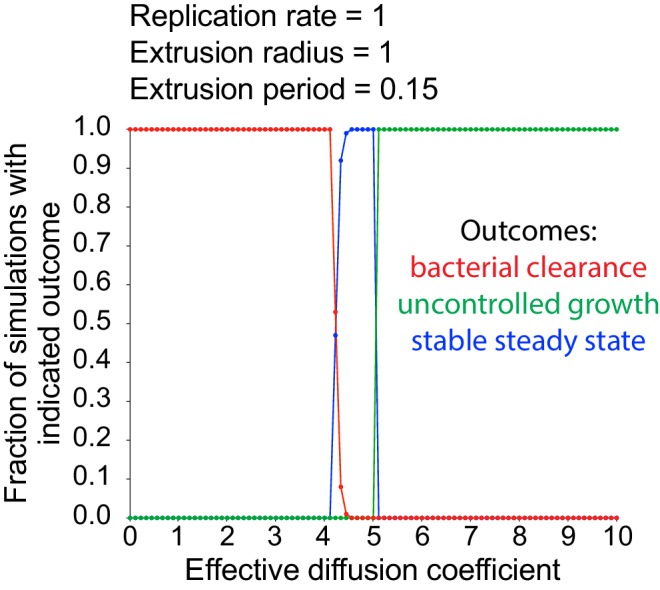
Figure 5—figure supplement 1. Random walk host cell extrusion simulations predominantly lead to all-or-nothing outcomes.

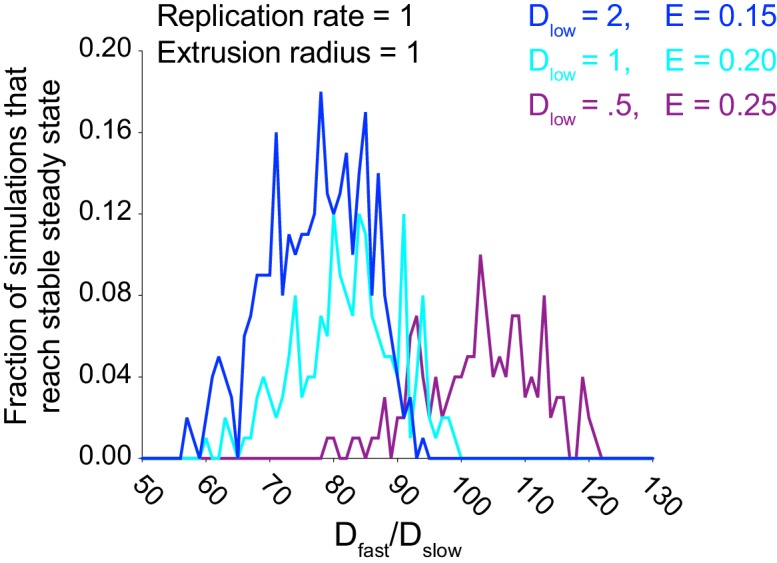
Figure 5—figure supplement 2. Simulations predict that heterogeneous spread increases the chance of a persistent L. monocytogenes infection in the intestinal epithelium for several combinations of Dslow and host cell extrusion periods.


