The lumenal protein tPA modulates fusion pore expansion as chromaffin granules undergo exocytosis. Abbineni et al. show that other lumenal proteins, including chromogranin A, also regulate the lifetime of fusion pores and that protein overexpression downregulates endogenous lumenal proteins.
Abstract
Upon fusion of the secretory granule with the plasma membrane, small molecules are discharged through the immediately formed narrow fusion pore, but protein discharge awaits pore expansion. Recently, fusion pore expansion was found to be regulated by tissue plasminogen activator (tPA), a protein present within the lumen of chromaffin granules in a subpopulation of chromaffin cells. Here, we further examined the influence of other lumenal proteins on fusion pore expansion, especially chromogranin A (CgA), the major and ubiquitous lumenal protein in chromaffin granules. Polarized TIRF microscopy demonstrated that the fusion pore curvature of granules containing CgA-EGFP was long lived, with curvature lifetimes comparable to those of tPA-EGFP–containing granules. This was surprising because fusion pore curvature durations of granules containing exogenous neuropeptide Y-EGFP (NPY-EGFP) are significantly shorter (80% lasting <1 s) than those containing CgA-EGFP, despite the anticipated expression of endogenous CgA. However, quantitative immunocytochemistry revealed that transiently expressed lumenal proteins, including NPY-EGFP, caused a down-regulation of endogenously expressed proteins, including CgA. Fusion pore curvature durations in nontransfected cells were significantly longer than those of granules containing overexpressed NPY but shorter than those associated with granules containing overexpressed tPA, CgA, or chromogranin B. Introduction of CgA to NPY-EGFP granules by coexpression converted the fusion pore from being transient to being longer lived, comparable to that found in nontransfected cells. These findings demonstrate that several endogenous chromaffin granule lumenal proteins are regulators of fusion pore expansion and that alteration of chromaffin granule contents affects fusion pore lifetimes. Importantly, the results indicate a new role for CgA. In addition to functioning as a prohormone, CgA plays an important role in controlling fusion pore expansion.
Introduction
The synthesis and fusion of secretory granules with the plasma membrane is a multistep, highly regulated process. In mature neuroendocrine cells, secretory granules accumulate in the cell and await a Ca2+ signal to initiate SNARE-dependent reactions that lead to fusion. The immediate outcome of these interactions is a narrow fusion pore (2–3 nm diameter; Breckenridge and Almers, 1987; Zimmerberg et al., 1987; Jackson and Chapman, 2008; Sharma and Lindau, 2016, 2018) that permits slow release of small molecules (e.g., catecholamine) but not proteins. The fusion pore subsequently expands to permit rapid small molecule discharge and protein discharge. Because the rate of expansion of the fusion pore is a major factor in controlling the kinetics of lumenal protein discharge, it is not surprising that fusion pore expansion is regulated by numerous factors. SNARE proteins themselves influence expansion rates, with mutations in either the vesicular-SNARE, vesicle-associated membrane protein (Ngatchou et al., 2010; Chang et al., 2015; Bao et al., 2016), or the target-SNARE, syntaxin (Han et al., 2004), altering the immediate release of catecholamine from secretory granules. Synaptotagmin on the secretory granule membrane regulates the fusion pore (Wang et al., 2001), with synaptotagmin 7 associated with very slow expansion (over many seconds) and synaptotagmin 1 with rapid expansion (<1 s; Rao et al., 2014). Dynamin, the master controller of fission in endocytosis, also has prominent effects on fusion pore expansion (Tsuboi et al., 2004; Anantharam et al., 2011; Shin et al., 2018), with low guanosine triphosphatase (GTPase) activity being associated with slow expansion and high GTPase activity with rapid expansion (Anantharam et al., 2010b, 2011). All of these regulators act on the cytosolic side of the granule membrane. It was therefore unexpected when we discovered that chromaffin granule lumenal protein contents also strongly influence fusion pore expansion, thereby regulating their own discharge rates (Weiss et al., 2014).
It has been known for some time that the postfusion discharge rates differ by orders of magnitude for different exogenously expressed proteins (Taraska et al., 2003; Michael et al., 2004). For example, GFP-labeled tissue plasminogen activator (tPA) is discharged over tens of seconds after fusion, whereas GFP-labeled neuropeptide Y (NPY) is often discharged within 100 ms (Taraska et al., 2003; Perrais et al., 2004; Tsuboi et al., 2004; Bohannon et al., 2017). Although the slower release of labeled tPA may be caused, in part, by its larger size (tPA-EGFP, 95 kD vs. NPY-EGFP, 31 kD), we discovered, by detecting curvature associated with the fusion pore using polarization and TIRF (pTIRF) microscopy, that a major factor governing discharge is the effect of lumenal tPA to virtually freeze fusion pore expansion, with high curvature usually lasting for longer than 10 s. In contrast, fusion pore curvature of NPY-containing granules usually lasts for < 2 s (Weiss et al., 2014).
In this article, we present further evidence of the critical role of lumenal granule proteins in controlling fusion pore expansion. We investigated a number of proteins including chromogranin A (CgA), which comprises ∼50% of the protein lumenal content of endogenous chromaffin granules (Winkler, 1976). pTIRF microscopy demonstrated that fusion pores of granules containing CgA-EGFP had long-lived narrow fusion pores, with curvature lifetimes comparable to those of tPA-EGFP–containing granules. Unexpectedly, granules containing exogenous NPY (or other exogenous proteins) had greatly reduced expression of endogenous CgA. Restoration of CgA to NPY-EGFP–containing granules specifically increased the curvature duration of fusion pores so that the pore expansion was similar to that of granules without exogenous protein. The results indicate a new role for CgA. In addition to functioning as a prohormone, CgA plays an important role in controlling fusion pore expansion. We discuss the potential implications of such regulation for the function of the adrenal medulla.
Materials and methods
Chromaffin cell transfection and stimulation of secretion
Bovine chromaffin cells were isolated and transfected using the Neon Transfection System (Thermo Fisher Scientific) as previously described (Bohannon et al., 2017). 10 µg DNA was used per 106 cells. For cotransfection of nonfluorescent and GFP-tagged proteins, DNA was used at a ratio of 2:1 (unlabeled:labeled). Imaging experiments were performed in physiological salt solution (PSS) containing 145 mM NaCl, 5.6 mM KCl, 2.2 mM CaCl2, 0.5 mM MgCl2, 5.6 mM glucose, and 15 HEPES, pH 7.4. Individual cells were stimulated to secrete by perfusion with elevated K+ solution containing 45 mM NaCl, 100 mM KCl, 5 mM CaCl2, 5.6 mM glucose, and 15 mM HEPES, pH 7.4. Generally, cells were first perfused with PSS and then stimulated to secrete with elevated K+ for 30 s. All live-cell imaging experiments were performed at 34°C 4–6 d after cell isolation.
pTIRF microscopy and image analysis
Chromaffin cells were plated on collagen-coated glass-bottom dishes and stained with DiI (1,1′-dioctadecyl-3,3,3′,3′-tetramethylindocarbocyanine perchlorate) by replacing their medium with PSS containing 100 µM methyl-β-cyclodextrin (mβcd) followed by the addition of 10 µM DiI (from a 10-mM stock in ethanol) for 20 s. The cells were then rinsed three times in PSS free of DiI and mβcd and imaged immediately. The DiI/mβcd complex gives more reliable cell staining than dilution of DiI from an ethanolic solution, which has been done previously. The specialized excitation scheme used to generate the P- and S-polarized excitation beams for pTIRF microscopy and superimpose their paths has been described in detail (Anantharam et al., 2010b; Bohannon et al., 2017). The superimposed excitation beams were focused near the periphery of the back focal plane of a 60× 1.49–numerical aperture (NA) oil-immersion objective (Olympus) so that the excitation beam emerged collimated from the objective at an incidence angle of ∼70° from the normal, giving a decay constant for the evanescent field of ∼100 nm. DiI-stained cells transfected with EGFP-tagged lumenal proteins were excited sequentially with a 561-nm laser split into P- and S-polarized components as previously described (Anantharam et al., 2010b) and a 488-nm laser using transistor–transistor logic–triggered shutters (sequence rate, 8 Hz). Fluorescence emission was collected through the 1.49-NA objective, and images were acquired using an electron-multiplying charge-coupled device camera (iXon, Andor Technology, 512 × 512 pixels). Normalized P-polarized emission/S-polarized emission ratios (P/S) and P-polarized emission + 2× S-polarized emission) sums (P + 2S) were calculated pixel by pixel for each image, and the transformations were aligned to the EGFP images using custom software written in Interactive Data Language (IDL). Changes in P/S ratio in nontransfected and transfected cells were identified visually as discrete, punctate changes in DiI fluorescence, and a custom program written in IDL was used to extract fluorescence intensities from a defined region of interest (ROI). In experiments solely monitoring discharge of EGFP- or pHluorin (Phl)-tagged lumenal proteins, cells were excited with a 488-nm laser, and images were acquired at a rate of 36 or 60 Hz.
The rate of lumenal protein discharge, as reported by pHluorin intensity changes, was quantified using a custom program written in IDL, which has been described in detail (Bohannon et al., 2017). The same program was adapted to quantify the rate of lumenal protein discharge as reported by EGFP. P/S duration, defined as the length of time P/S remained above the prefusion baseline, was determined manually for each event and was binned into three categories: <1 s, 1–10 s, or >10 s. Statistical analyses used to compare experimental conditions are described in the figure legends.
Immunocytochemistry
Chromaffin cells were fixed, stained, and analyzed as described in detail in the figure legends. The protocol used for Fig. 7 B was designed to permit sequential staining with two rabbit primary antibodies. After incubation with the first primary antibody, labeled Fab fragments rather than bivalent antibodies were used as a secondary to preclude capture of a second rabbit primary antibody in a subsequent labeling step. After rinsing, the cells were blocked with an excess of unlabeled goat anti-rabbit Fab fragments, to ensure that none of the first primary antibody (rabbit anti-tPA) would be accessible to a second anti-rabbit secondary (rabbit anti-CgA). As a control, cells stained with rabbit anti-tPA and a green anti-rabbit secondary but no second primary antibody against CgA were stained with a second (red) anti-rabbit secondary. The absence of significant red immunofluorescence indicated that the first rabbit primary antibody against tPA was completely blocked before the addition of the second primary.
Figure 7.
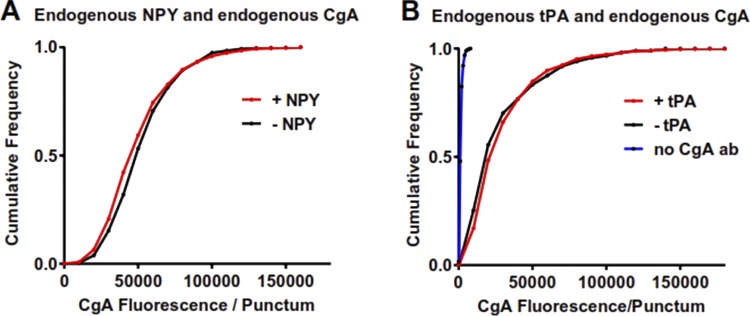
Granules containing endogenous NPY or tPA do contain CgA. Cultured bovine chromaffin cells were fixed with 4% paraformaldehyde and permeabilized with methanol. (A) Cells were incubated with antibodies to NPY and bovine CgA, followed by Alexa Fluor–labeled anti-mouse and anti-rabbit secondary antibodies, and then visualized by confocal microscopy. (B) Cells were incubated with a primary antibody to tPA, followed by Alexa488-labeled goat anti-rabbit Fab fragments, and then blocked with an excess of unlabeled goat anti-rabbit Fab fragments. Cells were then incubated with or without rabbit anti-bovine CgA, followed by an Alexa546-labeled anti-rabbit secondary antibody, and imaged by confocal microscopy. The absence of significant immunofluorescence in cells with no second primary antibody against CgA (blue line in B; n = 8 cells, 481 puncta) indicates that the first rabbit primary antibody against tPA was completely blocked before the addition of the second primary. Endogenous CgA in tPA-containing granules, n = 11 cells, 883 puncta. Endogenous CgA in granules in cells without tPA, n = 12 cells, 392 puncta.
Images were acquired on a Nikon A1R confocal microscope with a 60× 1.4-NA oil objective using a 488-nm laser with a 525/50-nm bandpass emission filter and a 561-nm laser with a 595/50-nm bandpass emission filter, both with GaAsP detectors. To minimize spillover, images with different excitations were acquired sequentially. Within an experiment, initial settings were adjusted so that the brightest pixels for each color were unsaturated, and these settings were maintained throughout. Images were analyzed with ImageJ (National Institutes of Health). Puncta were identified visually and marked as an ROI. The fluorescence of each ROI was calculated, and an average on-cell background was subtracted using ImageJ.
Antibodies for immunofluorescence imaging were from the following sources: rabbit anti-mouse tPA (Molecular Innovations, ASMTPA-GF-HT); mouse anti-human NPY (Abcam, ab112473); mouse anti-HA (Covance, MMS-101R); unlabeled and Alexa488-labeled goat anti-rabbit Fab fragments (Jackson ImmunoResearch Laboratories, 111-007-003 and 111-547-003, respectively); rabbit anti-human plasminogen activator inhibitor (PAI; Abcam, ab66705); and Alexa Fluor–labeled secondary antibodies (Thermo Fisher Scientific [Molecular Probes]). Rabbit anti-bovine CgA was a gift from the laboratory of Daniel O’Connor, formerly of the Department of Medicine and Center for Molecular Genetics, University of California, San Diego, CA.
SDS-PAGE and immunoblots
Released material was concentrated in an Amicon Ultraconcentrator with a 3-kD cutoff, diluted into reduced Laemmli sample buffer, and heated at 95°C for 10 min. Proteins were separated by SDS-PAGE (10% gel) and transferred to a polyvinylidene fluoride (PVDF) membrane. Blots were blocked in 5% nonfat dry milk, followed by incubation with a combination of monoclonal antibodies to GFP followed by horseradish peroxidase (HRP)–labeled anti-mouse secondary antibodies, and visualized by chemiluminescence. Antibodies for immunoblots were mouse anti-GFP (Abcam 1218 cl. 9F9.F9) and mouse anti-GFP (Roche Diagnostics, 1-814-460, clones 7.1 and 13.1); HRP-tagged anti-mouse and anti-rabbit secondary antibodies (Amersham, NXA931 and NIF824, respectively); Pierce SuperSignal West Pico PLUS (Thermo Fisher Scientific) HRP substrate; and protease inhibitor cocktail (Millipore, 539134).
Online supplemental material
Supplemental material contains analysis of fusion pore curvature duration of granules containing brain-derived neurotrophic factor (BDNF)-EGFP or CgB-EGFP (Fig. S1), immunohistochemistry-based colocalization analysis of NPY-EGFP and CgA-HA (Fig. S2), and identification of chromaffin cells containing high and low amounts of endogenous NPY (Fig. S3).
Results
Primary bovine chromaffin cells were transfected with plasmids encoding secretory granule lumenal proteins (usually tagged with EGFP). Four to five days after transfection, the plasma membrane of chromaffin cells was labeled with the fluorescent, lipophilic probe DiI. Individual cells were stimulated to secrete with a solution containing elevated K+. Fluorescent protein discharge resulting from fusion of individual secretory (chromaffin) granules with the plasma membrane was monitored with TIRF. Punctate curvature changes associated with the fusion event was simultaneously monitored by determination of the orientation of DiI at the TIRF interface by excitation with polarized light (pTIRF microscopy).
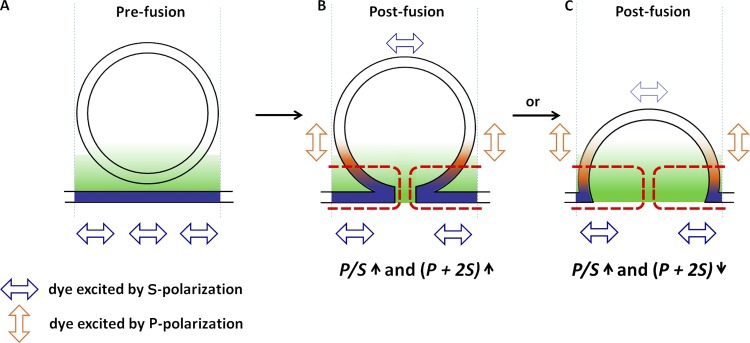
This approach to detect curvature changes associated with the fusion pore is described in detail in earlier publications (Anantharam et al., 2010b; Bohannon et al., 2017) and is diagrammed in Fig. 1. DiI incorporates into the plasma membrane bilayer with its preferred polarization of light absorption (and emission) parallel to the local plane of the membrane (Axelrod, 1979). Before fusion, the polarization is parallel to the glass interface (Fig. 1 A). Upon fusion (Fig. 1, B and C), the granule membrane becomes continuous with the plasma membrane, allowing the diffusion of DiI into the curved fused structure. Some of the DiI becomes oriented with an excitation (and emission) dipole component perpendicular to the glass interface. Detection of the orientation of DiI relies on two possible orthogonal electric field polarizations of an evanescent field: one predominantly along the z-axis (optical axis perpendicular to the coverslip, P-pol, vertical orange arrows in Fig. 1), and the other in the plane of the coverslip (S-pol, horizontal blue arrows in Fig. 1). P-pol excitation will excite membrane DiI with an absorption dipole component that is perpendicular to the coverslip (in membrane that curves away from the glass interface), whereas S-pol will excite DiI that has an absorption dipole component parallel to the coverslip. The key curvature measurement is an increase in the ratio of the emission with P-pol excitation to the emission with S-pol excitation (termed P/S). Punctate increases in P/S upon fusion reflect curvature changes associated with formation of a fusion pore. In addition, the linear combination of the emission P + 2S is calculated. It reports the total DiI emission detected by a 1.49-NA objective, which is proportional to the amount of DiI, convoluted with the exponentially decaying evanescent field (Anantharam et al., 2010b). Punctate increases or decreases in P + 2S are sensitive to the detailed geometry of the fusion event. An increase in P + 2S suggests that there is more excited DiI-labeled membrane in the region of interest (ROI), consistent with a chromaffin granule membrane connected to the plasma membrane by a narrow neck (indicated by brackets in Fig. 1 B). A decrease in P + 2S suggests less excited DiI-labeled membrane in the ROI close to the glass interface, consistent with a greatly expanded fusion pore (indicated by brackets in Fig. 1 C). The interpretations of the measurements as reflecting the initial and expanded fusion pore are supported by computer simulations that take into account the likely geometries and dimensions associated with the fusion pore, the optics used in pTIRF microscopy and the detection of the events by the CCD camera (Anantharam et al., 2010b). pTIRF microscopy revealed that the orders of magnitude slower discharge of exogenous tPA relative to NPY is at least in part caused by the much slower fusion pore expansion of tPA-expressing granules reflected by long-lived increases in P/S and P + 2S (Weiss et al., 2014).
Figure 1.
Measurement of fusion pore curvature using pTIRF microscopy. Cells are stained with DiI, a lipophilic dye that incorporates in the plasma membrane with its transition dipole moment (i.e., the preferred direction of excitation and emission) oriented as indicated by the arrowheads and by color (blue, S-polarized dye; orange, P-polarized dye). The gradient depicts the rapidly decaying evanescent field. (A) Prefusion, DiI is restricted to the plasma membrane, and its transition dipole moment is parallel to the glass interface. (B and C) Postfusion, DiI diffuses into the fused granule membrane, and membrane curvature increases the amount of DiI with its transition dipole moment orientated perpendicularly to the glass interface. Thus, the P/S ratio increases when a membrane is curved within an ROI. The increase occurs for both narrow (B) and wide-neck (C) fusion pores. P + 2S is a measure of the amount of DiI in a given ROI, and changes in P + 2S are dependent on the width of the fusion pore. Unlike P/S, P + 2S is sensitive to the geometric details of the fused granule-plasma membrane. A narrow fusion pore (B) will have more membrane close to the glass interface in a region of high evanescent field excitation, indicated by the red dotted lines, compared with the same ROI before fusion. Thus, a narrow fusion pore will increase the total amount of DiI (P + 2S) within the ROI that is excited by the evanescent field. In contrast, an expanded wide fusion pore (C) will result in less membrane in the region of high evanescent field excitation, indicated by the red dotted line in C, compared with the same ROI before fusion. This figure has been adapted from Bohannon et al. (2017).
CgA-EGFP discharge and fusion pore expansion
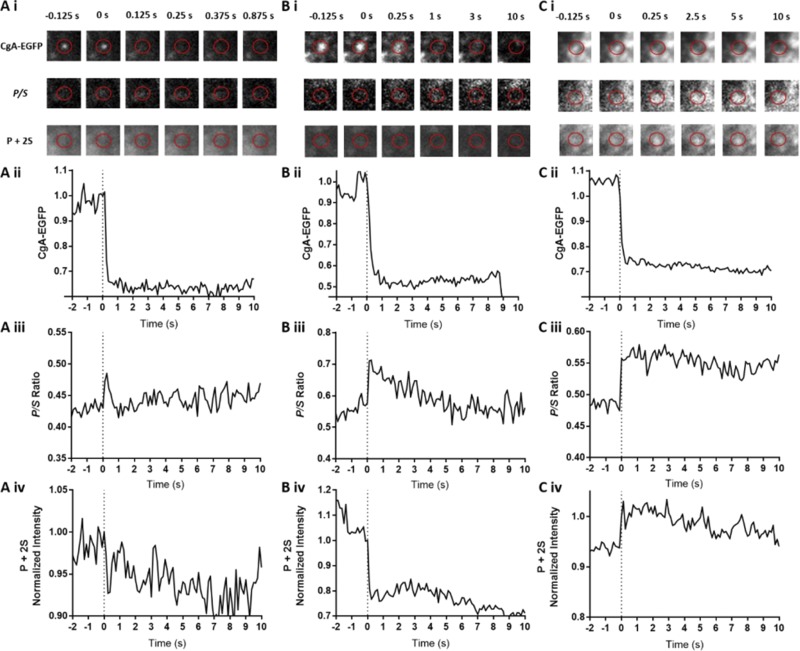
Upon stimulation with elevated K+, the fluorescence of CgA-EGFP in individual granules decreased rapidly, indicating the rapid discharge of the protein shown for three different events in Fig. 2 (A i–C i and A ii–C ii, “CgA-EGFP”). Simultaneously, DiI fluorescence was monitored at the sites of CgA-EGFP discharge, and P/S ratios and P + 2S indicative of fusion pore curvature were calculated. pTIRF microscopy changes were punctate and overlapped with fusion sites. We measured the length of time that P/S remained elevated above prefusion levels and identified ranges of fusion pore curvature durations lasting from <1 s, 1–10 s, and >10 s (Fig. 2, A iii–C iii). P/S were elevated for >10 s in more than 80% of CgA-EGFP discharge events. P + 2S increased in greater than 75% of events, indicating the formation of a relatively stable fusion pore (Figs. 2 C and 3). Occasionally there was a decrease in P + 2S (Fig. 2 B iv). We also examined the release of CgB-EGFP, the second most abundant member of the granin family of proteins present in chromaffin granules (Winkler et al., 1986), and one that shares significant structural homology with CgA (Bartolomucci et al., 2011). Much like CgA, CgB discharge was rapid. P/S remained elevated for >10 s in more than 80% of the discharge events, similar to CgA-EGFP (Fig. S1), and P + 2S increased in 59% of events at the time of fusion. Thus, both CgA and CgB are capable of greatly slowing fusion pore expansion despite the rapid discharge of the fluorescent-labeled protein. In the majority of CgA-EGFP and CgB-EGFP discharge events, an increase in P+2S was detected at the onset of discharge, indicating the presence of a narrow-neck fusion pore immediately after fusion (Fig. 1 B).
Figure 2.
CgA-EGFP discharge and associated pTIRF microscopy changes for three fusion events. (A–C) Chromaffin cells were transfected to express CgA-EGFP. 3–6 d later, plasma membranes were labeled with DiI. Within 30 min of labeling, individual cells were stimulated by perfusion with solution containing elevated K+. EGFP was detected by excitation at 488 nm, and the orientation of DiI was determined by sequentially exciting the cells with P-polarized and S-polarized 561-nm light (see Materials and methods). P/S and P + 2S were calculated pixel by pixel for each image, and the transformations were aligned to the EGFP images (A iii–C iii, A iv–C iv). A change in P + 2S for cell in A was uncertain. The decrease in P + 2S in B iv is difficult to discern in the corresponding P + 2S images above because of limited dynamic range of the printed images. P + 2S was elevated in B iv and C iv.
Figure 3.
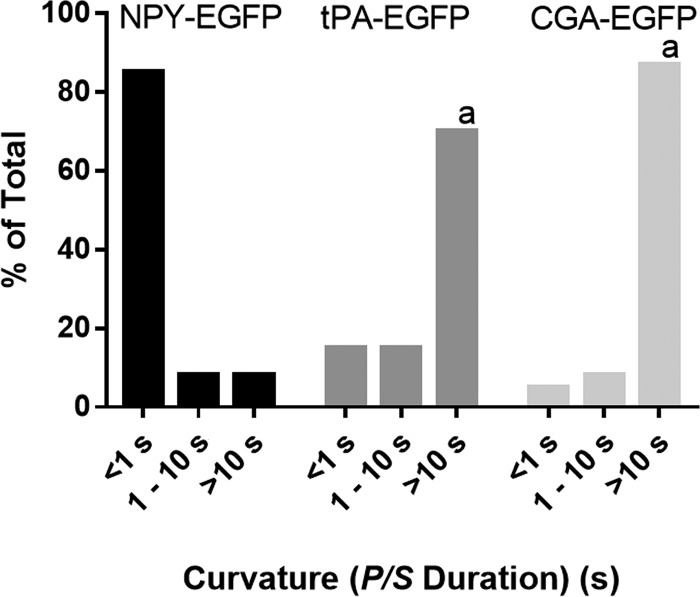
Fusion pore lifetime varies depending on the overexpressed lumenal protein. Chromaffin cells were transfected to express NPY, tPA, or CgA (all tagged with EGFP). Transfected cells were stimulated by perfusion with elevated K+ and imaged using pTIRF at 8 Hz. The length of time P/S was elevated was calculated as described in Materials and methods for n = 78 NPY-EGFP, n = 20 tPA-EGFP, and n = 60 CgA-EGFP and binned into three categories. A χ2 test was performed to compare the distributions. a, significant difference between distribution of curvature durations of NPY-EGFP–containing granules relative to tPA-EGFP– or CgA-EGFP–containing granules (P < 0.0001).
For comparison, we reexamined fusion pore curvatures associated with discharge of tPA-EGFP and NPY-EGFP (Weiss et al., 2014; Bohannon et al., 2017). We confirm our previous findings that tPA release is associated with long-lived P/S increases (∼70% of P/S increases lasted >10 s), and NPY-EGFP release is associated with short-lived P/S increases (∼80% of P/S increases returned to baseline within 1 s; Fig. 3). The distribution of fusion pore curvature durations associated with CgA-EGFP discharge were comparable to those associated with tPA-EGFP discharge.
Fusion pore–curvature durations associated with the discharge of BDNF-EGFP were also examined (Fig. S1). P/S ratios were elevated for >10 s in ∼50% of BDNF-EGFP discharge events, and P + 2S increased at the time of fusion in 58% of events.
CgA-EGFP is proteolytically processed in chromaffin cells, and its cleavage products are released upon stimulation
CgA is known to undergo significant posttranslational processing and can be cleaved within the secretory granule into a number of bioactive peptides (O’Connor and Frigon, 1984; Taupenot et al., 2003). We wondered whether the rapid discharge of CgA-EGFP represented release of lower-molecular-weight forms of CgA-EGFP rather than the full-length protein. Chromaffin cells expressing CgA-GFP were depolarized with a 1-min incubation with 100 mM K+, and the released proteins were separated by SDS-PAGE, transferred to PVDF membrane, and probed with antibody to GFP (Fig. 4). Bands specifically recognized by anti-GFP antibodies are labeled with arrows. The topmost band represents full-length CgA-GFP. CgA is known to show relatively slower mobility than expected based on its molecular weight (O’Connor and Frigon, 1984). The second and third bands represent cleaved CgA (Taupenot et al., 2003). There was a contaminating band of unknown origin in all lanes, including the right lane without CgA-GFP transfection. Both full-length and cleaved CgA were released upon stimulation (middle lane), whereas very little GFP-labeled protein was released in the absence of stimulation (left lane).
Figure 4.
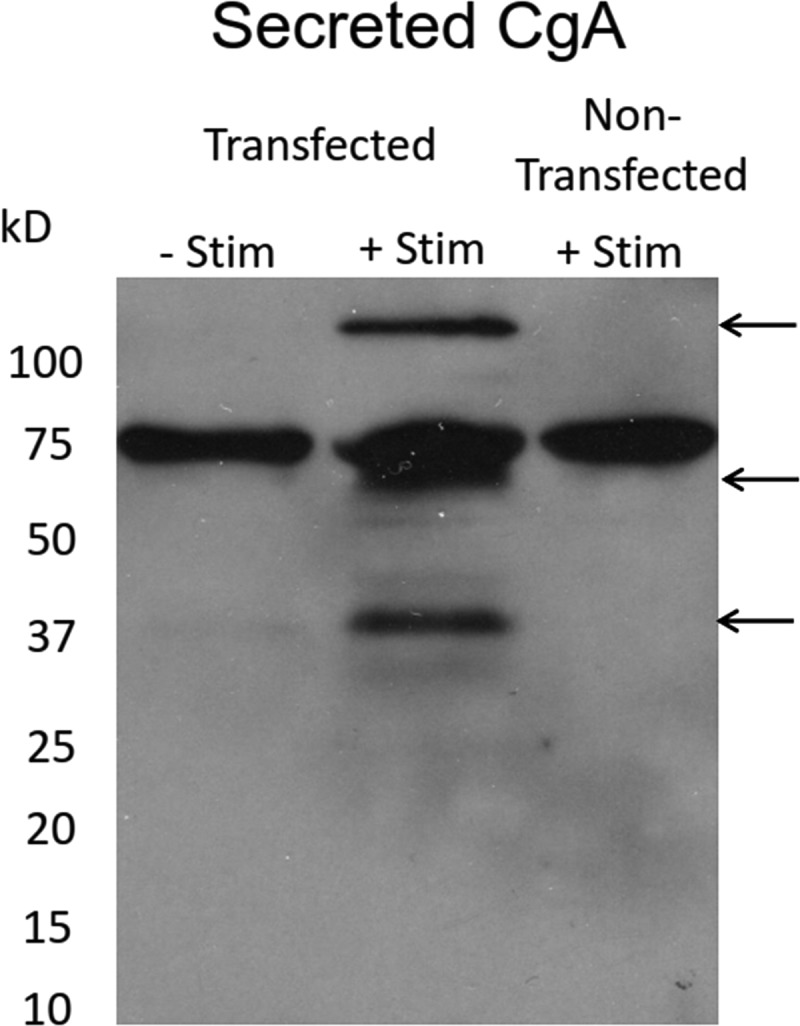
Processing of CgA-EGFP in chromaffin cells, and the molecular weight of released CgA-EGFP. 5 d before the experiment, chromaffin cells were transfected with or without CgA-GFP. Cells were stimulated ± 100 mM K+ PSS containing a protease inhibitor cocktail for 1 min at 34°C. Released material was concentrated and processed as described in Materials and methods. CgA-EGFP was detected with an anti-GFP antibody.
Overexpression of proteins leads to a reduction in endogenous lumenal contents
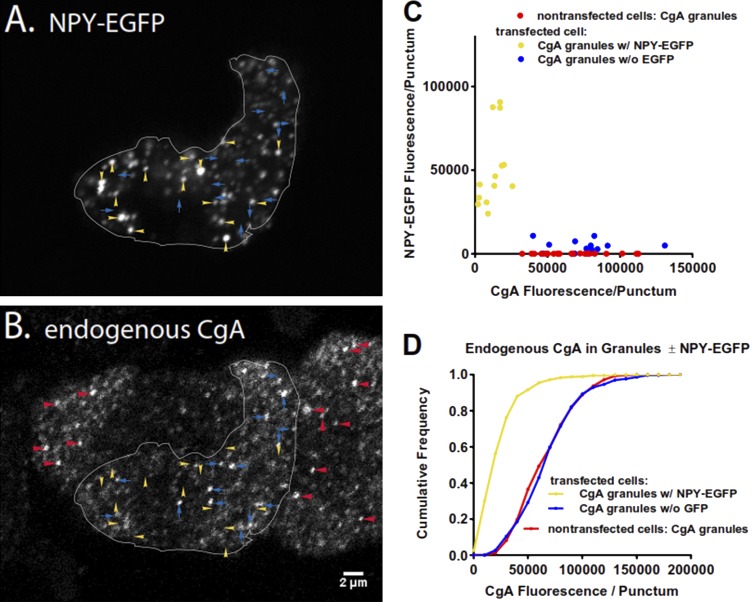
CgA is thought to be a major protein constituent of all chromaffin granules. With the current finding that the protein slows fusion pore expansion, we might have expected if endogenous CgA is copackaged in granules expressing NPY-EGFP that curvature durations would be relatively long-lived. However, we had previously demonstrated (Anantharam et al., 2010b, 2011; Weiss et al., 2014) and have confirmed in this study (Fig. 3) that the vast majority of curvature changes associated with the discharge of NPY-GFP last for <1 s. One explanation for the paradox is that endogenous CgA expression in NPY-GFP–containing granules was reduced. Remarkably, this was the case. We found that the amount of immunoreactive CgA (endogenous protein) in NPY-EGFP granules was much less than in granules in nontransfected cells or in neighboring granules in the transfected cells that did not contain NPY-EGFP (presumably because they were synthesized before the transfection). Fig. 5 A shows a cell expressing NPY-EGFP in secretory granules, examples of which are designated by yellow arrowheads; Fig. 5 B shows CgA-immunoreactive puncta of the same cell (outlined in white), several of which are labeled with blue arrows. Also present in the image are neighboring nontransfected cells, with CgA puncta labeled by red arrowheads. A careful comparison of the two images reveals that the NPY-EGFP puncta (yellow arrowheads) in Fig. 5 A contain little or no CgA immunofluorescence (Fig. 5 B). Conversely, puncta of CgA in Fig. 5 B (blue arrows) do not coincide with NPY-EGFP in Fig. 5 A. The relationship of NPY-EGFP and CgA amounts is shown for all marked examples in the images (Fig. 5 C). Fig. 5 D extends the analysis to a total of 10 transfected and 10 nontransfected cells. The cumulative histogram shows that more than half (56%) of the NPY-EGFP granules had CgA fluorescence of ≤20,000 (arbitrary units), whereas only 1–2% of granules without exogenous protein had that little CgA. Less than 5% of granules with NPY-EGFP had CgA fluorescence >60,000 arbitrary units, whereas 51% of granules without exogenous protein had CgA fluorescence > 60,000.
Figure 5.
Overexpression of a lumenal protein (NPY-EGFP) leads to the reduction of endogenous CgA. (A and B) Chromaffin cells overexpressing NPY-EGFP were fixed with 4% paraformaldehyde, permeabilized, incubated with antibody to bovine CgA, and visualized by confocal microscopy. The transfected cell is outlined in both panels for clarity. Yellow arrowheads indicate examples of NPY-EGFP–containing granules, whereas CgA-containing granules are indicated by blue arrows. Note that NPY-EGFP granules contain little endogenous CgA. Examples of CgA-containing granules in nontransfected cells are indicated by red arrowheads in B. Scale bar = 2 µm. (C) The amount of endogenous CgA (B) was measured by immunofluorescence in NPY-EGFP–containing granules, neighboring granules with no NPY-EGFP, and CgA granules in nontransfected cells. Each point represents one of the individual granules indicated by arrows or arrowheads in the images. (D) The analysis was performed on additional cells and plotted as a cumulative histogram. n = 10 cells/group. Transfected cells, n = 685 CgA granules with NPY-EGFP and n = 298 CgA granules without NPY-EGFP; nontransfected cells, n = 570 CgA granules.
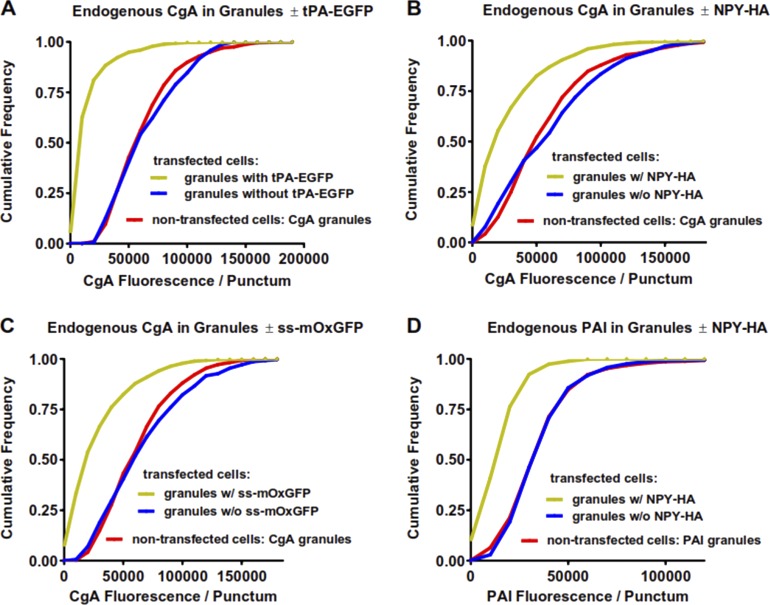
The decrease in CgA was not limited to cells expressing NPY-EGFP but occurred with other overexpressed lumenal proteins (Fig. 6). Expression of tPA-EGFP caused a similar loss of CgA (Fig. 6 A). Replacing the fluorophore EGFP with the hemagglutinin (HA) epitope (NPY-HA, Fig. 6 B) also resulted in loss of endogenous costored CgA. Even replacing full-length NPY with ss-mOxGFP consisting of just the NPY signal sequence fused to mOxGFP, a form of EGFP lacking the cysteine residues that can cause misfolding (Costantini et al., 2015), also significantly reduced the endogenous CgA levels in granules (Fig. 6 C).
Figure 6.
Overexpression of a various lumenal proteins with or without fluorophores leads to the reduction of the endogenous lumenal proteins CgA and PAI. (A–D) Chromaffin cells overexpressing various constructs were fixed with 4% paraformaldehyde; permeabilized; incubated with antibodies to bovine CgA (A–C), HA (B and D), or PAI (D) and appropriate secondary antibodies; and visualized by confocal microscopy. Images of transfected and nontransfected cells were analyzed as in Fig. 4, and the results were plotted as cumulative histograms. (A) Transfected cells, n = 1,285 granules with tPA-EGFP, and n = 190 granules without tPA-EGFP in 10 cells; nontransfected cells, n = 692 granules in 10 cells. (B) Transfected cells, n = 845 granules with NPY-HA, and n = 442 granules without NPY-HA in 14 cells; nontransfected cells, n = 767 granules in 17 cells. (C) Transfected cells, n = 1,342 granules with ss-mOxEGFP and n = 371 granules without ss-mOxEGFP in 11 cells; nontransfected cells, n = 569 granules in 13 cells. (D) Transfected cells, n = 800 granules with NPY-HA, and n = 547 granules without NPY-HA in 14 cells; nontransfected cells, n = 848 granules in 19 cells.
Although CgA is a major constituent of the dense core in chromaffin granules, it is not the only cargo protein whose concentration is diminished by expressing an exogenous protein. PAI is ubiquitously expressed in chromaffin cells (Bohannon et al., 2017), and it too is lost in granules containing NPY-HA (Fig. 6 D).
Granules in nontransfected cells containing endogenous NPY or tPA possess normal levels of CgA
Only a fraction of bovine chromaffin cells strongly express endogenous NPY (4%) or tPA (20%; Weiss et al., 2014). Cells we designate as “strongly expressing” NPY or tPA typically have 10–15 times as much immunoreactive protein as in the low-expressing chromaffin cells and are easily identified (Fig. S3). We wondered whether granules in these cells might have levels of CgA comparable to those in cells lacking high levels of NPY or tPA. Unlike NPY-GFP–containing (Fig. 5 D) or tPA-GFP–containing (Fig. 6 A) granules, granules with high levels of endogenous NPY (Fig. 7 A) or endogenous tPA (Fig. 7 B) contain normal levels of endogenous CgA. (Note that the blue line in Fig. 7 B shows a control for this part of the experiment in which two antibodies raised in rabbits against CgA and tPA were used sequentially. The absence of significant immunofluorescence in cells with no second primary antibody against CgA indicates that the first rabbit antibody against tPA was completely blocked before the addition of the second primary, and thus did not lead to a spurious colocalization of CgA and tPA.)
Fusion pore curvature durations of granules without exogenous protein
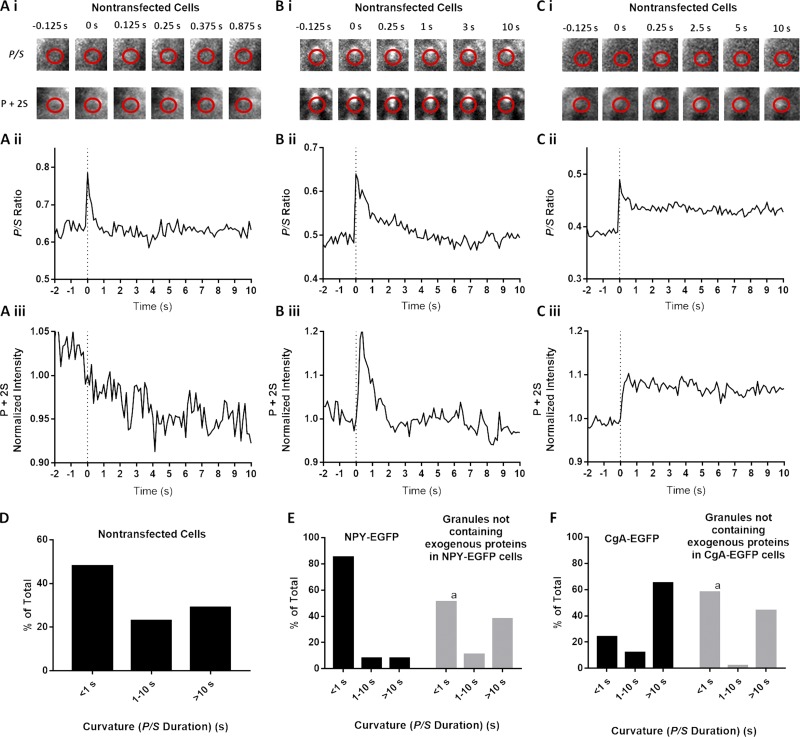
Because overexpression alters the endogenous granule lumenal content, we sought to measure fusion pore curvature durations in nontransfected cells. We stained nontransfected chromaffin cells with DiI and stimulated the cells with elevated K+. Sudden punctate increases in P/S occurred upon stimulation in the presence of Ca2+ but not in the absence of Ca2+ (not depicted). These curvature changes likely reflect fusion of secretory granules. As with fusion of granules containing exogenous protein, there was a range of duration of P/S elevations from <1 s to >10 s (Fig. 8, A–C). P/S remained elevated for <1 s in 48% of the events and was elevated for>10 s in 29% of events (Fig. 8 D). Hence, the distribution of curvature durations in nontransfected cells was significantly longer than fusion pore curvature durations of granules containing overexpressed NPY but shorter than those associated with granules containing overexpressed tPA, CgA, or CgB (Figs. 3, 8, and S1).
Figure 8.
Expression of exogenous lumenal protein alters fusion pore lifetimes. (A–C) Chromaffin cells were transfected to express NPY-EGFP or CgA-EGFP or used without transfection. Transfected and nontransfected cells were stained with DiI, stimulated with elevated K+, and imaged using pTIRF. In nontransfected cells stained with DiI, discrete, punctate changes in fluorescence became visible after stimulation with elevated K+. Three events detected by pTIRF microscopy in nontransfected cells are shown in A, B, and C. (D) P/S lifetimes for events in nontransfected cells (n = 135). (E and F) In transfected cells, granules expressing exogenous protein were identified by EGFP fluorescence, and their discharge and fusion pore expansion were monitored using pTIRF. In the same cells, fusion of granules without transfected protein (i.e., without fluorescent EGFP) was identified as discrete, punctate changes in DiI fluorescence that became visible after stimulation. P/S in the different groups were binned according to their durations. n = 78 NPY-EGFP–expressing granules, n = 37 granules without transfected protein in NPY-EGFP–transfected cells, n = 34 CgA-EGFP–expressing granules, n = 54 granules without transfected protein in CgA-EGFP–transfected cells. A χ2 test was performed to compare the distributions. a, significant difference between distribution of curvature durations of granules without transfected protein compared with NPY-EGFP–containing (P < 0.0001) or CgA-EGFP–containing (P = 0.0051) granules.
Punctate curvature changes occurred in transfected cells that were not associated with the release of exogenous labeled protein. These events likely reflected the fusion of granules that had been synthesized before transfection. (Chromaffin granules in unstimulated cells have lifetimes of several days [Corcoran et al., 1984].) If the exogenous protein is affecting the fusion pores only of granules in which it is expressed and not having a global effect on the cells, the events not associated with exogenous lumenal protein should have similar curvature changes to those in nontransfected cells. Furthermore, their durations should be distinct from the fusions of neighboring granules harboring transfected protein. These were indeed the findings. Approximately 50% of the fusions of granules without exogenous lumenal protein had curvature durations of <1 s in either NPY-EGFP– or CgA-EGFP–transfected cells (Fig. 8 E or F, respectively). The distributions were virtually identical in the two groups of cells despite very different durations of curvatures of granules containing the different exogenous proteins and were identical to the distribution in nontransfected cells (Fig. 8 D).
The presence of exogenous CgA lengthens curvature durations in granules expressing NPY-EGFP
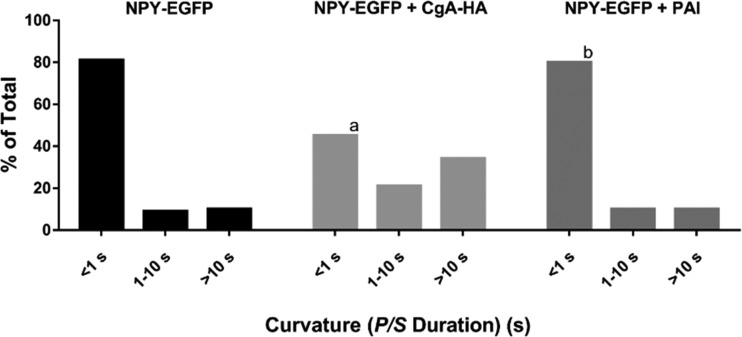
If the absence of endogenous CgA contributes to the short P/S durations observed after expression of NPY-EGFP, then coexpression of exogenous CgA with NPY-EGFP should lengthen curvature durations. NPY-EGFP was transfected with CgA labeled with HA (CgA-HA). Immunohistochemistry demonstrated that 97% of NPY-EGFP–containing granules also contained CgA-HA (Fig. S2). Coexpression of CgA slowed fusion pore expansion associated with the release of NPY-EGFP. The frequency of P/S changes lasting for <1 s was reduced by approximately one-half (85% to 45%), and the frequency of P/S lasting >10 s was increased fourfold (8% to 34%; Fig. 9). Endogenous PAI is also expressed in secretory granules in most chromaffin cells (Bohannon et al., 2017). PAI labeled with a GFP variant is rapidly discharged upon fusion and is associated with short-lived curvature changes similar to those with labeled NPY (Bohannon et al., 2017). Curvature durations were identical in NPY-EGFP cells with and without exogenous PAI (Fig. 9). Thus, the longer fusion pore curvature durations after CgA coexpression with NPY-EGFP are specifically caused by the ability of CgA to modulate the fusion pore. Furthermore, the coexpression of CgA-HA with NPY-EGFP (Fig. 9) is sufficient to shift the distribution of durations of curvature elevations to that of granules containing only endogenous proteins (Fig. 8).
Figure 9.
The presence of CgA slows fusion pore expansion. Chromaffin cells were transfected with NPY-EGFP + pcDNA, NPY-EGFP + CgA-HA, or NPY-EGFP + PAI. Transfected cells were stained with DiI, stimulated with elevated K+, and imaged using pTIRF. P/S ratios were calculated at the site of lumenal protein discharge. The length of time P/S was elevated was calculated as described in Materials and methods for n = 111 NPY-EGFP, n = 150 NPY-EGFP + CgA-HA, n = 30 NPY-EGFP + PAI and binned into three categories. A χ2 test was performed to compare the distributions. a, significant difference between distribution of curvature durations of NPY-EGFP–containing granules and NPY-EGFP + CgA-HA–containing granules (P < 0.0001). b, no significant difference between distribution of curvature durations of NPY-EGFP–containing granules and NPY-EGFP + PAI–containing granules.
Considered together, these findings indicate that endogenous chromaffin granule lumenal proteins, including CgA, are regulators of fusion pore expansion, and alteration of chromaffin granule contents affects fusion pore lifetime. The rapid fusion pore expansion of NPY-EGFP–containing granules, rather than reflecting normal fusion pore dynamics as previously assumed, is at least partially a consequence of the loss of endogenous CgA.
The presence of CgA does not slow the discharge of rapidly released lumenal proteins
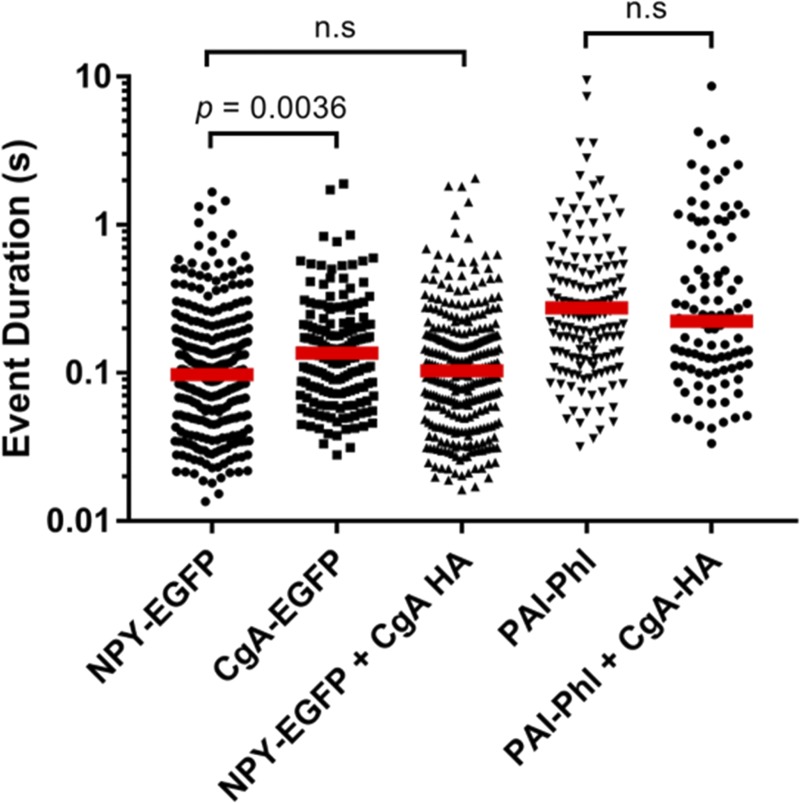
NPY-EGFP discharge was similar in the presence and absence of exogenous lumenal CgA (median discharge times 97 and 103 ms, respectively; Fig. 10). The discharge of the somewhat larger lumenal protein, PAI-Phl (PAI-Phl, ∼77 kD; NPY-EGFP, ∼40 kD) was also similar in the presence and absence of copackaged exogenous CgA (median durations 280 and 223 ms, respectively).
Figure 10.
Coexpression of CgA does not influence the release of NPY EGFP or PAI Phl. Chromaffin cells were transfected with combinations of plasmids encoding the indicated proteins. Secretion was stimulated by perfusion with elevated K+ and monitored using TIRF microscopy at the rate of 36–60 Hz for cells expressing NPY and CgA, and at 60 Hz for cells expressing PAI-Phl. Each data point represents one secretion event. The duration of each event was determined using a custom program written in IDL (described in Materials and methods). The red dashed lines represent the median duration. n = 288 for NPY-EGFP, n = 170 for CgA-EGFP, n = 297 for NPY-EGFP + CgA-HA, n = 162 for PAI-Phl, and n = 107 for PAI-Phl + CgA-HA. A Kolmogorov–Smirnoff test was performed to compare the distributions. n.s, not significant.
Discussion
We had previously discovered that lumenal proteins of secretory granules affect fusion pore expansion (Weiss et al., 2014; Bohannon et al., 2017). Curvatures associated with the fusion of secretory granules expressing exogenous NPY or PAI were short lived, usually lasting for <1 s. Before the current study, tPA was the only exogenous lumenal protein with a predominance of long-lived curvatures upon fusion (lasting >10 s). In this study, we found that long-lived curvatures were also associated with granules containing EGFP-labeled CgA, CgB, and BDNF (Figs. 2, 3, and S1). Thus, rather than being unusual, tPA is among a group of lumenal proteins that confer this characteristic.
The finding that the major lumenal protein in chromaffin granules, CgA, stabilized fusion pores was unexpected, because if endogenous CgA were copackaged with exogenous NPY-EGFP or PAI-EGFP, then fusion pores from these granules might be expected to be long lived. As discussed below, the expression of proteins that traffic to secretory granules reduced the concentration of endogenous lumenal proteins including CgA. We demonstrate that the loss of CgA is at least partially responsible for the transient curvature changes observed with NPY-EGFP– or PAI-EGFP–containing granules.
Lumenal protein content is altered in granules containing exogenous protein
We and others have long used expression of fluorophore-tagged secretory proteins to examine aspects of regulated secretion. An underlying assumption in such studies has been that the granule is unaltered except for the expression of fluorescent protein. Unexpectedly, we found using quantitative immunocytochemistry that transiently expressed lumenal protein caused a down-regulation of endogenously expressed proteins CgA and PAI. The down-regulation is robust and was independent of the identity of the exogenous secretory protein. It occurred upon transfection with NPY-EGFP or tPA-EGFP. EGFP contains cysteine residues that can form anomalous disulfide bonds in the oxidizing environment of the secretory pathway, resulting in an unfolded protein response (Costantini et al., 2015). mOxGFP does not contain cysteines, is monomeric, and does not induce protein misfolding in the secretory pathway (Costantini et al., 2015). ss-mOxGFP (without NPY peptide) as well as NPY-HA also caused protein down-regulation. Thus, the down-regulation of endogenous protein in secretory granules containing transfected protein is a general response to the addition of exogenous proteins into the regulated secretory pathway. We are currently investigating the mechanisms underlying the changes.
Coexpression of CgA specifically prolongs fusion pore curvature durations
Because granules containing NPY-EGFP contain much lower amounts of endogenous CgA, and the presence of CgA was found to stabilize fusion pore curvature, we suspected that introduction of CgA to NPY-EGFP granules would increase fusion pore-curvature durations. This was indeed the case. Cotransfection of exogenous CgA with NPY-EGFP resulted in the sorting of these two proteins to the same granules. The curvatures of fused granules were converted from being transient to being longer lived (Fig. 9). The effect was specific to the coexpression of CgA; PAI, a ubiquitous chromaffin granule lumenal protein that does not stabilize fusion pore curvature (Bohannon et al., 2017), did not alter the curvatures associated with fusion of NPY-EGFP granules (Fig. 9). Thus, the rapid curvature changes associated with the fusion of granules containing NPY-EGFP is readily explained by the greatly reduced presence of endogenous CgA (Fig. 5) rather than by a dominant characteristic of the transfected NPY.
Duration of fusion pore curvature in nontransfected cells
Before the current study, pTIRF microscopy had been used only to examine the fusion curvature durations associated with granules containing overexpressed, exogenous proteins (Anantharam et al., 2010a; Rao et al., 2014; Weiss et al., 2014; Bohannon et al., 2017; Bendahmane et al., 2018). Elevated K+-dependent and Ca2+-dependent, punctate curvature changes are also observed in nontransfected cells. The granules responsible for these changes likely contain endogenous CgA. The curvature durations of these events were longer than those containing labeled NPY and shorter than those associated with granules containing overexpressed CgA, CgB, tPA, or BDNF. The range of durations probably reflects the heterogeneous lumenal/membrane protein composition of chromaffin granules (Rao et al., 2014; Weiss et al., 2014) and the stochastic nature of molecular events associated with fusion. The results are consistent with the wide variety of postfusion outcomes directly visualized by live-cell microscopy (Shin et al., 2018). The distribution of fusion pore curvature durations of granules coexpressing NPY-EGFP and exogenous CgA is identical to that of granules in nontransfected cells (Figs. 8 D and 9), consistent with a role of CgA in determining fusion pore curvature lifetime in endogenous granules.
We identified two populations of granules in transfected cells, those that do and those that do not contain exogenous protein. Whatever the mechanisms for the down-regulation of endogenous proteins in granules expressing exogenous protein, the fusion pore effects are specific only for granules expressing exogenous protein. Because chromaffin granules in unstimulated cells have lifetimes of several days (Corcoran et al., 1984), granules without exogenous protein were likely synthesized before transfection. Furthermore, they had identical endogenous CgA and PAI expression as granules in nontransfected cells (Fig. 5). The fusion pore curvature durations of granules without exogenous protein in transfected cells were identical to curvature durations in nontransfected cells (Fig. 8, E and F). Thus, the effects on the fusion pore of a transfected lumenal protein reflect a specific effect of the transfected protein acting from within the granule, not a global change in transfected cells.
It is interesting to compare the protein changes upon transfection in our experiments with those in the CgA knockout and the CgA/CgB double knockout mice. In both knockouts, there were compensatory effects in the adrenal medulla. The cells in the CgA knockout mice had a twofold increase in chromogranin B (Montesinos et al., 2008). Cells from the double CgA/CgB knockout expressed numerous proteins that are not normally associated with chromaffin granules including fibrinogen isoforms, and apolipoprotein E (Diaz-Vera et al., 2011). Interpretation of secretory changes in these knockouts is complicated by the compensatory changes. In the present study, the reduction of endogenous lumenal protein induced by expression of exogenous lumenal protein was advantageous. The long-duration fusion pores of granules transfected with tPA, CgA, CgB, or BDNF likely reflect the direct effects of the transfected proteins in granules in a background of reduced of endogenous lumenal proteins.
Proteolytic products and full length CgA are discharged upon fusion
CgA is a prohormone that is proteolytically processed into several bioactive peptides (Wohlfarter et al., 1988; Metz-Boutigue et al., 1993). In our experiments, both full-length and processed forms of CgA-EGFP were secreted (Fig. 4), indicating that transfected CgA-EGFP was also processed. The rapid release of EGFP-labeled protein reflects, in part, the discharge of low-molecular-weight proteolytic products of CgA-EGFP.
How do CgA and other lumenal granule proteins influence the fusion pore?
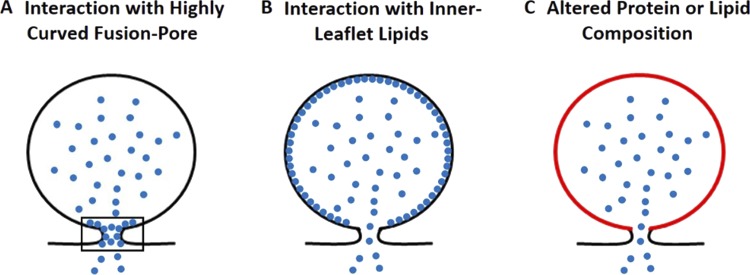
There are at least three mechanisms that could explain the effects of lumenal granule proteins on fusion pore expansion (Fig. 11). First, there could be direct effects of the protein from within the fused granule to stabilize the high-curvature fusion pore (Zimmerberg and Kozlov, 2006; McMahon et al., 2010; Fig. 11 A). Fusion pore dynamics can be modulated by proteins that interact with curved membranes and either stabilize or destabilize the highly curved structures. Dynamin and synaptotagmin likely influence the kinetics of fusion pore expansion from the cytosolic side by such mechanisms (Wang et al., 2001; Anantharam et al., 2011; Rao et al., 2014; Bendahmane et al., 2018). Lumenal granule proteins could play a similar role to stabilize the highly positively curved fusion pore from within the granule (Weiss et al., 2014). Indeed, CgA and CgB each bind to membranes isolated from secretory granules (Yoo, 1993; Glombik et al., 1999). We found that CgA-EGFP fluorescence decreases rapidly after fusion, often to undetectable levels. However, a few molecules of full-length or of a proteolysed fragment of CgA could remain at the fusion site (and be below our detection limit) and influence the fusion pore. In a previous study, there were numerous examples of tPA-cerulean fluorescence also falling below the limits of detection while P/S elevations were maintained (Weiss et al., 2014). A second related possibility is that some lumenal proteins bind to the entire lumenal surface of the granule, giving it stiffness or rigidity that prevents expansion and flattening of the granule membrane into the plasma membrane (Fig. 11 B). The N terminus of CgA has been shown to be sufficient to traffic CgA to secretory granules, and the N terminus of CgA fused to α-antitrypsin reroutes the protein from the constitutive to the regulated secretory pathway (Glombik et al., 1999; Taupenot et al., 2002). Sorting of proteins from the ER to the regulated secretory pathway may involve interaction of the protein with the lumenal leaflet of the compartment followed by aggregation. Thus, the same domains involved in sorting CgA to the secretory granules could also be responsible for the effects of CgA on fusion pore expansion. Third, the protein or lipid constituents of the granule membrane could be indirectly influenced by lumenal protein (Fig. 11 C), perhaps when immature secretory granules bud from the trans Golgi network, thereby altering fusion pore dynamics. We are in the process of investigating these possibilities.
Figure 11.
Possible mechanisms by which lumenal proteins can influence the fusion pore. (A) Lumenal proteins preferentially bind and stabilize the highly curved fusion pore (shown in rectangle). (B) Lumenal proteins bind the inner leaflet of the granule membrane, giving it stiffness or rigidity that prevents expansion and flattening of the granule membrane into the plasma membrane. (C) Lumenal proteins indirectly influence the protein or lipid composition of the granule membrane during granule biogenesis, thereby altering fusion pore dynamics.
Physiological roles for postfusion curvature
The maintenance of fusion pore curvature by lumenal proteins has several physiological implications. tPA, by restricting the expansion of a narrow fusion pore, slows its own postfusion discharge rate, and in doing so, creates a nanoscale reaction chamber that permits covalent interaction with PAI, the costored inhibitor of tPA (Weiss et al., 2014; Bohannon et al., 2017). This modulates the amount of enzymatically active tPA that is secreted and creates a new tPA/PAI complex that may have physiological function. However, although pTIRF indicates that CgA also greatly slows fusion pore expansion, the data do not suggest a similar role for CgA in delaying protein discharge. Exogenous CgA and its fragments were discharged rapidly, similarly to NPY-EGFP expressed alone. Furthermore, CgA-HA did not slow the discharge of coexpressed NPY-EGFP or PAI-Phl, in contrast to exogenous tPA (Bohannon et al., 2017). The simplest explanation is that CgA stabilizes a wider-diameter fusion pore than tPA.
Because of the ubiquitous expression of CgA in chromaffin granules, stabilization of postfusion curvature by this protein may have general functional implications for endogenous granules other than restricting postfusion protein discharge. After fusion, chromaffin granule membranes are usually retrieved from the plasma membrane via clathrin-dependent mechanisms that we have previously described (Bittner et al., 2013). Because localized curvature has been found to enhance the recruitment of proteins that mediate endocytosis (Roux et al., 2010), stabilization of curvature at the site of fusion by CgA may speed endocytosis.
A second function may involve the maintenance of overall cell size after robust secretion. Fusion of chromaffin granules with the plasma membrane adds significantly to the plasma membrane area. For example, exocytosis of 10% of the granules in a cell would increase plasma membrane area by ∼50% in the absence of endocytosis. Because chromaffin cells in the adrenal gland are organized in tight clusters (Reith and Ross, 1965) and must be in close proximity to the microvasculature for endocrine function, there are likely to be mechanisms that maintain the distinct cellular anatomy before membrane internalization by endocytosis. By stabilizing curvature at the site of fusion and not allowing full collapse of the granule membrane into the plasma membrane, CgA may permit maintenance of overall cell geometry in the tissue during the robust secretion characteristic of the flight-or-fight response.
Supplementary Material
Acknowledgments
We thank Dr. Kevin P. Bohannon for many helpful discussions and for reading the manuscript. We are grateful to the late Daniel T. O’Connor for providing the anti-bovine CgA antibody.
This work was supported by National Institutes of Health grant R01-170553 to R.W. Holz and D. Axelrod.
The authors declare no competing financial interests.
Author contributions: P.S. Abbineni conceived, performed, and analyzed experiments and contributed to writing of the paper. M.A. Bittner conceived, performed, and analyzed experiments and contributed to writing of the paper. D. Axelrod developed mathematical methods for analyzing secretion and pTIRFM events and contributed to writing the paper. R.W. Holz conceived the experiments and contributed to writing the paper.
Sharona E. Gordon served as editor.
References
- Anantharam A., Axelrod D., and Holz R.W.. 2010a Polarized TIRFM reveals changes in plasma membrane topology before and during granule fusion. Cell. Mol. Neurobiol. 30:1343–1349. 10.1007/s10571-010-9590-0 [DOI] [PMC free article] [PubMed] [Google Scholar]
- Anantharam A., Onoa B., Edwards R.H., Holz R.W., and Axelrod D.. 2010b Localized topological changes of the plasma membrane upon exocytosis visualized by polarized TIRFM. J. Cell Biol. 188:415–428. 10.1083/jcb.200908010 [DOI] [PMC free article] [PubMed] [Google Scholar]
- Anantharam A., Bittner M.A., Aikman R.L., Stuenkel E.L., Schmid S.L., Axelrod D., and Holz R.W.. 2011. A new role for the dynamin GTPase in the regulation of fusion pore expansion. Mol. Biol. Cell. 22:1907–1918. 10.1091/mbc.e11-02-0101 [DOI] [PMC free article] [PubMed] [Google Scholar]
- Axelrod D. 1979. Carbocyanine dye orientation in red cell membrane studied by microscopic fluorescence polarization. Biophys. J. 26:557–573. 10.1016/S0006-3495(79)85271-6 [DOI] [PMC free article] [PubMed] [Google Scholar]
- Bao H., Goldschen-Ohm M., Jeggle P., Chanda B., Edwardson J.M., and Chapman E.R.. 2016. Exocytotic fusion pores are composed of both lipids and proteins. Nat. Struct. Mol. Biol. 23:67–73. 10.1038/nsmb.3141 [DOI] [PMC free article] [PubMed] [Google Scholar]
- Bartolomucci A., Possenti R., Mahata S.K., Fischer-Colbrie R., Loh Y.P., and Salton S.R.. 2011. The extended granin family: structure, function, and biomedical implications. Endocr. Rev. 32:755–797. 10.1210/er.2010-0027 [DOI] [PMC free article] [PubMed] [Google Scholar]
- Bendahmane M., Bohannon K.P., Bradberry M.M., Rao T.C., Schmidtke M.W., Abbineni P.S., Chon N.L., Tran S., Lin H., Chapman E.R., et al. . 2018. The synaptotagmin C2B domain calcium-binding loops modulate the rate of fusion pore expansion. Mol. Biol. Cell. mbc.E17-11-0623. [DOI] [PMC free article] [PubMed] [Google Scholar]
- Bittner M.A., Aikman R.L., and Holz R.W.. 2013. A nibbling mechanism for clathrin-mediated retrieval of secretory granule membrane after exocytosis. J. Biol. Chem. 288:9177–9188. 10.1074/jbc.M113.450361 [DOI] [PMC free article] [PubMed] [Google Scholar]
- Bohannon K.P., Bittner M.A., Lawrence D.A., Axelrod D., and Holz R.W.. 2017. Slow fusion pore expansion creates a unique reaction chamber for co-packaged cargo. J. Gen. Physiol. 149:921–934. 10.1085/jgp.201711842 [DOI] [PMC free article] [PubMed] [Google Scholar]
- Breckenridge L.J., and Almers W.. 1987. Currents through the fusion pore that forms during exocytosis of a secretory vesicle. Nature. 328:814–817. 10.1038/328814a0 [DOI] [PubMed] [Google Scholar]
- Chang C.W., Hui E., Bai J., Bruns D., Chapman E.R., and Jackson M.B.. 2015. A structural role for the synaptobrevin 2 transmembrane domain in dense-core vesicle fusion pores. J. Neurosci. 35:5772–5780. 10.1523/JNEUROSCI.3983-14.2015 [DOI] [PMC free article] [PubMed] [Google Scholar]
- Corcoran J.J., Wilson S.P., and Kirshner N.. 1984. Flux of catecholamines through chromaffin vesicles in cultured bovine adrenal medullary cells. J. Biol. Chem. 259:6208–6214. [PubMed] [Google Scholar]
- Costantini L.M., Baloban M., Markwardt M.L., Rizzo M., Guo F., Verkhusha V.V., and Snapp E.L.. 2015. A palette of fluorescent proteins optimized for diverse cellular environments. Nat. Commun. 6:7670 10.1038/ncomms8670 [DOI] [PMC free article] [PubMed] [Google Scholar]
- Diaz-Vera J., Camacho M., Machado J.D., Dominguez N., Montesinos M.S., Hernandez-Fernaud J.R., Lujan R., and Borges R.. 2011. Chromogranins A and B are key proteins in amine accumulation, but the catecholamine secretory pathway is conserved without them. FASEB J. 26:430–438. [DOI] [PubMed] [Google Scholar]
- Glombik M.M., Krömer A., Salm T., Huttner W.B., and Gerdes H.H.. 1999. The disulfide-bonded loop of chromogranin B mediates membrane binding and directs sorting from the trans-Golgi network to secretory granules. EMBO J. 18:1059–1070. 10.1093/emboj/18.4.1059 [DOI] [PMC free article] [PubMed] [Google Scholar]
- Han X., Wang C.T., Bai J., Chapman E.R., and Jackson M.B.. 2004. Transmembrane segments of syntaxin line the fusion pore of Ca2+-triggered exocytosis. Science. 304:289–292. 10.1126/science.1095801 [DOI] [PubMed] [Google Scholar]
- Jackson M.B., and Chapman E.R.. 2008. The fusion pores of Ca2+ -triggered exocytosis. Nat. Struct. Mol. Biol. 15:684–689. 10.1038/nsmb.1449 [DOI] [PMC free article] [PubMed] [Google Scholar]
- McMahon H.T., Kozlov M.M., and Martens S.. 2010. Membrane curvature in synaptic vesicle fusion and beyond. Cell. 140:601–605. 10.1016/j.cell.2010.02.017 [DOI] [PubMed] [Google Scholar]
- Metz-Boutigue M.H., Garcia-Sablone P., Hogue-Angeletti R., and Aunis D.. 1993. Intracellular and extracellular processing of chromogranin A. Determination of cleavage sites. Eur. J. Biochem. 217:247–257. 10.1111/j.1432-1033.1993.tb18240.x [DOI] [PubMed] [Google Scholar]
- Michael D.J., Geng X., Cawley N.X., Loh Y.P., Rhodes C.J., Drain P., and Chow R.H.. 2004. Fluorescent cargo proteins in pancreatic beta-cells: design determines secretion kinetics at exocytosis. Biophys. J. 87:L03–L05. 10.1529/biophysj.104.052175 [DOI] [PMC free article] [PubMed] [Google Scholar]
- Montesinos M.S., Machado J.D., Camacho M., Diaz J., Morales Y.G., Alvarez de la Rosa D., Carmona E., Castañeyra A., Viveros O.H., O’Connor D.T., et al. . 2008. The crucial role of chromogranins in storage and exocytosis revealed using chromaffin cells from chromogranin A null mouse. J. Neurosci. 28:3350–3358. 10.1523/JNEUROSCI.5292-07.2008 [DOI] [PMC free article] [PubMed] [Google Scholar]
- Ngatchou A.N., Kisler K., Fang Q., Walter A.M., Zhao Y., Bruns D., Sørensen J.B., and Lindau M.. 2010. Role of the synaptobrevin C terminus in fusion pore formation. Proc. Natl. Acad. Sci. USA. 107:18463–18468. 10.1073/pnas.1006727107 [DOI] [PMC free article] [PubMed] [Google Scholar]
- O’Connor D.T., and Frigon R.P.. 1984. Chromogranin A, the major catecholamine storage vesicle soluble protein. Multiple size forms, subcellular storage, and regional distribution in chromaffin and nervous tissue elucidated by radioimmunoassay. J. Biol. Chem. 259:3237–3247. [PubMed] [Google Scholar]
- Perrais D., Kleppe I.C., Taraska J.W., and Almers W.. 2004. Recapture after exocytosis causes differential retention of protein in granules of bovine chromaffin cells. J. Physiol. 560:413–428. 10.1113/jphysiol.2004.064410 [DOI] [PMC free article] [PubMed] [Google Scholar]
- Rao T.C., Passmore D.R., Peleman A.R., Das M., Chapman E.R., and Anantharam A.. 2014. Distinct fusion properties of synaptotagmin-1 and synaptotagmin-7 bearing dense core granules. Mol. Biol. Cell. 25:2416–2427. 10.1091/mbc.e14-02-0702 [DOI] [PMC free article] [PubMed] [Google Scholar]
- Reith E.J., and Ross M.H.. 1965. Atlas of Descriptive Histology. Harper & Row, New York. [Google Scholar]
- Roux A., Koster G., Lenz M., Sorre B., Manneville J.B., Nassoy P., and Bassereau P.. 2010. Membrane curvature controls dynamin polymerization. Proc. Natl. Acad. Sci. USA. 107:4141–4146. 10.1073/pnas.0913734107 [DOI] [PMC free article] [PubMed] [Google Scholar]
- Sharma S., and Lindau M.. 2016. The mystery of the fusion pore. Nat. Struct. Mol. Biol. 23:5–6. 10.1038/nsmb.3157 [DOI] [PMC free article] [PubMed] [Google Scholar]
- Sharma S., and Lindau M.. 2018. The fusion pore, 60 years after the first cartoon. FEBS Lett. 592:3542–3562. 10.1002/1873-3468.13160 [DOI] [PMC free article] [PubMed] [Google Scholar]
- Shin W., Ge L., Arpino G., Villarreal S.A., Hamid E., Liu H., Zhao W.D., Wen P.J., Chiang H.C., and Wu L.G.. 2018. Visualization of membrane pore in live cells reveals a dynamic-pore theory governing fusion and endocytosis. Cell. 173:934–945.e912. [DOI] [PMC free article] [PubMed] [Google Scholar]
- Taraska J.W., Perrais D., Ohara-Imaizumi M., Nagamatsu S., and Almers W.. 2003. Secretory granules are recaptured largely intact after stimulated exocytosis in cultured endocrine cells. Proc. Natl. Acad. Sci. USA. 100:2070–2075. 10.1073/pnas.0337526100 [DOI] [PMC free article] [PubMed] [Google Scholar]
- Taupenot L., Harper K.L., Mahapatra N.R., Parmer R.J., Mahata S.K., and O’Connor D.T.. 2002. Identification of a novel sorting determinant for the regulated pathway in the secretory protein chromogranin A. J. Cell Sci. 115:4827–4841. 10.1242/jcs.00140 [DOI] [PubMed] [Google Scholar]
- Taupenot L., Harper K.L., and O’Connor D.T.. 2003. The chromogranin-secretogranin family. N. Engl. J. Med. 348:1134–1149. 10.1056/NEJMra021405 [DOI] [PubMed] [Google Scholar]
- Tsuboi T., McMahon H.T., and Rutter G.A.. 2004. Mechanisms of dense core vesicle recapture following “kiss and run” (“cavicapture”) exocytosis in insulin-secreting cells. J. Biol. Chem. 279:47115–47124. 10.1074/jbc.M408179200 [DOI] [PubMed] [Google Scholar]
- Wang C.T., Grishanin R., Earles C.A., Chang P.Y., Martin T.F., Chapman E.R., and Jackson M.B.. 2001. Synaptotagmin modulation of fusion pore kinetics in regulated exocytosis of dense-core vesicles. Science. 294:1111–1115. 10.1126/science.1064002 [DOI] [PubMed] [Google Scholar]
- Weiss A.N., Anantharam A., Bittner M.A., Axelrod D., and Holz R.W.. 2014. Lumenal protein within secretory granules affects fusion pore expansion. Biophys. J. 107:26–33. 10.1016/j.bpj.2014.04.064 [DOI] [PMC free article] [PubMed] [Google Scholar]
- Winkler H. 1976. The composition of adrenal chromaffin granules: an assessment of controversial results. Neuroscience. 1:65–80. 10.1016/0306-4522(76)90001-4 [DOI] [PubMed] [Google Scholar]
- Winkler H., Apps D.K., and Fischer-Colbrie R.. 1986. The molecular function of adrenal chromaffin granules: established facts and unresolved topics. Neuroscience. 18:261–290. 10.1016/0306-4522(86)90154-5 [DOI] [PubMed] [Google Scholar]
- Wohlfarter T., Fischer-Colbrie R., Hogue-Angeletti R., Eiden L.E., and Winkler H.. 1988. Processing of chromogranin A within chromaffin granules starts at C- and N-terminal cleavage sites. FEBS Lett. 231:67–70. 10.1016/0014-5793(88)80704-X [DOI] [PubMed] [Google Scholar]
- Yoo S.H. 1993. pH-dependent association of chromogranin A with secretory vesicle membrane and a putative membrane binding region of chromogranin A. Biochemistry. 32:8213–8219. 10.1021/bi00083a023 [DOI] [PubMed] [Google Scholar]
- Zimmerberg J., and Kozlov M.M.. 2006. How proteins produce cellular membrane curvature. Nat. Rev. Mol. Cell Biol. 7:9–19. 10.1038/nrm1784 [DOI] [PubMed] [Google Scholar]
- Zimmerberg J., Curran M., Cohen F.S., and Brodwick M.. 1987. Simultaneous electrical and optical measurements show that membrane fusion precedes secretory granule swelling during exocytosis of beige mouse mast cells. Proc. Natl. Acad. Sci. USA. 84:1585–1589. 10.1073/pnas.84.6.1585 [DOI] [PMC free article] [PubMed] [Google Scholar]
Associated Data
This section collects any data citations, data availability statements, or supplementary materials included in this article.


