

Abstract
Aim
The first-line therapy for polycystic ovary syndrome (PCOS) is weight loss focussing on diet and regular exercise; measurement of diet and energy intake (EI) is important to determine associations between nutrients and health in women with PCOS. The EI underreporting (UR) is a condition characterised by reports of habitual EI that is implausibly low, compared with estimated requirements. This case–control study aims to evaluate UR in women with PCOS.
Methods
Thirty-six women with PCOS were enrolled according to the Rotterdam criteria; 37 healthy women were enrolled as controls. Inclusion criteria: age range 18–45 and body mass index ≥18.5 kg/m2 in subjects without eating disorders and/or diabetes mellitus. Nutritional assessment included: anthropometry, basal metabolic rate (BMR), weight history and physical activity assessment. Subjects completed a non-consecutive three-day dietary diary to identify energy and macronutrient intake. UR was calculated (Goldberg Index: EI/BMR).
Results
Although women with PCOS reported a significantly higher mean BMR than controls (P < 0.0001), their EI was lower (P < 0.001), suggesting an UR in 47.2% of women with PCOS versus 2.7% of controls (P < 0.0001). The EI from simple sugars was lower in women with PCOS than controls (P < 0.01). The protein intake was increased in controls than women with PCOS (P < 0.0001). Weight cycling was more frequent in women with PCOS (P < 0.001). Logistic regression analysis identified UR associated with PCOS (P = 0.001).
Conclusions
Women with PCOS underreport foods rich in simple sugars rather than underreport their total dietary intake. These results may have implications for the interpretation of diet and health correlations in this patient population.
Keywords: basal metabolic rate, dietary underreporting, energy intake, misreporting, polycystic ovary syndrome
Introduction
Polycystic ovary syndrome (PCOS) is one of the most common endocrine disorders in women of reproductive age, with a 5–10% prevalence rate.1 Applying the Rotterdam criteria which requires the presence of two or more of the following: ovulatory dysfunction (oligo- or amenorrhoea), hyperandrogenism (either biochemical or clinical hirsutism) and polycystic ovarian morphology,2 the rate of PCOS in community settings might increase to 18%.3
The pathogenesis of PCOS is multifactorial—a key component is the association between insulin resistance, compensatory hyperinsulinemia and hyperandrogenism.4–7 Clinical manifestations of PCOS frequently include high body adiposity leading to an increased risk of metabolic syndrome, type 2 diabetes and cardiovascular disease.8,9
Although weight loss and dietary modifications are recommended to improve the metabolic status, reduce testosterone and decrease hirsutism in women with PCOS,6,10 they are usually not able to result in sustainable weight loss with scarce results in metabolic and reproductive outcomes. As women with PCOS could experience high body adiposity8,9 they could feel inadequate and judged for their weight and eating; therefore, they might disclose dietary habits, which reflect counsellor’s expectations rather than actual consumption. It has been reported that, in this selective misreport, patients affected by obesity omit socially undesirable food items high in fat, sugar, alcoholic beverages, and underreport portion sizes or snack consumption11,12 to align with perceived preferred diet behaviours.
Several variables, grouped into nine distinct categories, seem to influence energy misreporting: demographics (e.g. age, gender), diet (e.g. macronutrient intake), eating behaviour (e.g. eating restraint), social desirability, dieting/weight history (e.g. number of previous dieting attempts), body image, psychology (e.g. depression), life status (e.g. socioeconomic status) and physical activity.13
The energy intake (EI) underreporting (UR) occurs when the report of habitual EI is implausibly low when compared with estimated requirement.14 It has been reported that UR tends to be higher among women with obesity.15 People with obesity often experience weight stigma, as highlighted by Puhl and Suh.16 and at higher body mass indexes (BMIs) frequently correspond higher UR and poorer diet quality.15 Therefore, inaccurate or biased EI reporting may undermine the validity of research on dietary surveys and health outcomes.17
Finally, it has been reported18 that women with PCOS, particularly those with insulin resistance, present a significantly decreased basal metabolic rate and should restrict their EI by diet and enhance their energy expenditure by exercise to maintain their body weight.
Based on these considerations, to the best of our knowledge, this is the first pilot case–control study, to evaluate the presence of EI UR in women affected by PCOS, paying attention to insulin resistance as a possible confounding factor.
Methods
Subjects with PCOS, according to the Rotterdam consensus,2 attending the Research Centre for Reproductive Medicine, Gynaecological Endocrinology and Menopause, Fondazione IRCCS San Matteo of Pavia (Italy) and not under treatment for weight loss, were recruited between January 2015 and November 2015.
Exclusion criteria were BMI <18.5 kg/m2, diabetes mellitus, eating disorders and intentional weight loss in the previous 3 months. Thus 36 women with PCOS were included (age range: 16–43 years) and 37 healthy subjects matched by age (age range: 18–45 years) were enrolled as controls.
Informed consent and Patient Privacy Consent Form was obtained from all participants. IRB approval was obtained per institutional guidelines. All procedures performed in the study were in accordance with the ethical standards of the institutional and/or national research committee and with the 1964 Helsinki declaration and its later amendments or comparable ethical standards.
The study followed the ‘STrengthening the Reporting of OBservational studies in Epidemiology’ (STROBE) guidelines.
Nutritional assessment was performed, including anthropometric measurements (height, weight, waist circumference (WC)) and biochemical parameters (glucose, insulin, total cholesterol, triglycerides, HDL and LDL cholesterols). Weight, height and WC were measured under standard conditions, as previously described;19 BMI (weight in kg/height in m2) was then calculated.
Homeostasis Model Assessment (HOMA) index was also assessed as index of insulin resistance (cut-off value >2.3).20
Moreover, we investigated the history of previous dieting, particularly the history of weight cycling with the following questions:
Have you ever undergone weight loss dietary treatment during your life? If yes, how many times?
Have you lost any weight after any weight loss dietary treatments? If yes, how much?
Have you ever lapsed or relapsed? If yes, how many times?
According to the literature,21 all women reporting a 5 kg weight loss three or more times in a lifecycle followed by a regain were defined as weight cyclers.
To estimate energy and nutrient intake, subjects were instructed to compile a non-consecutive three-day dietary record (food diary).22 The days of recording were randomised (1 weekend day and 2 non-consecutive weekdays), to provide a sufficient number of days to measure EI for the sample size and a good weekly representation of the mean dietary habits of the subjects.22 Total EI, the percentage of energy from carbohydrates, simple sugars, lipids, and proteins, and fibre were estimated using the Food Composition Database for Epidemiological Studies in Italy.23
To investigate physical activity patterns, we administered a section of a previously validated dietary questionnaire.24 The questionnaire was drawn from one originally developed and validated on an Italian youth population24 and then adapted by two dietitians to our adult population by deleting physical activities in the school environment before its administration. The new adapted version was previously piloted on a sample of 24 subjects and revised accordingly, although its validity and reliability were not formally tested. All answers were structured to quantify the time spent weekly in physical activity: (i) to investigate the activities spent during the free time (i.e. walking, watching TV, listening, to music, using the computer, reading a book, practicing a sport and shopping) and (ii) to quantify screen time (i.e. the hours on the computer or watching TV). Each score ranged from 0 to 3, with the maximum score assigned to the healthiest habit.24 The total score was divided into tertiles: (i) Low: ‘sedentary’, (ii) Medium: ‘partially moderate’ and (iii) High: ‘active’, according to the National Lifestyle Guidelines.25
To derive cut-off values for EI misreporting, according to Goldberg et al.,26 we applied at individual level, the equations reported in Figure 1 to determine the rate of under-reporters, plausible and over-reporters.27
Figure 1.
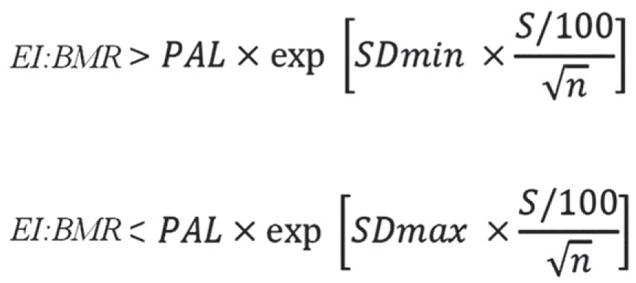
Goldberg/Black equation to derive cut-off values for evaluation of misreporting of energy intake.27 Legend: EI, energy intake; BMR, basal metabolic rate; PAL, physical activity level; S, coefficient that takes account of the variation in EI, BMR and PAL; SDmin, −2 for the 95% lower confidence limit; SDmax, +2 for the 95% upper confidence limit; n, the number of subjects evaluated.
In the equations, SDmin was −2 for the 95% lower confidence limit; SDmax was +2 for the 95% upper confidence limit and n = 1 because we evaluated misreporting at individual level.27 Based on the questionnaire,24 the entire sample was classified as ‘sedentary’, leading to physical activity level (PAL) value of 1.4, according to Food and Agriculture Organisation of the United Nations/World Health Organisations/United Nations University report.28 The BMR was estimated using the Schofield equation29 for age and sex categories. In the equations, S was the factor that considered the variation in EI, BMR and PAL27 and was reported in Figure 2. To calculate S for 3 days food consumption (d = 3, by food diary) we used revised factors of Black, considering 23% of within-subject variation for EI (CVwEI), 15% of between-subject variation for PAL (CVtP) and 8.5% of within-subject variation for estimated BMR (CVwB).27,30
Figure 2.
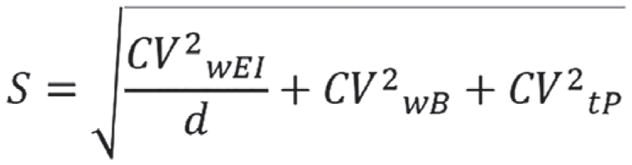
Equation used to calculate the coefficient (S) taking into account of the variation in energy intake, BMR and PAL in the Goldberg/Black equation.27 Legend: CVwEI, within-subject variation in energy intake; d, number of days of diet assessment; CVwB, within-subject variation in repeated BMR measurements or precision of estimated BMR estimated compared with measured BMR; CVtP, within-subject variation in PAL.
Therefore, subjects with calculated values of the ratio EI: BMR in the interval 0.9–1.5 were classified as plausible reporters. Subjects with individual EI:BMR <0.9 were categorised as under-reporters, subjects with individual EI:BMR >0.9 were categorised as over-reporters.
Data quality control and statistical analyses were performed using STATA 11 (StataCorp, College Station, TX, USA). All quantitative variables were explored to verify their distributional properties and eventually transformed to respect the Normality assumption. Descriptive statistics representing means, SDs, percentages and ranges were computed. T test was performed to verify that patients’ characteristics did not differ significantly in the PCOS patients and the control group. A logistic regression analysis was applied to evaluate the association between PCOS and UR, taking into account the effect of age, BMI, the presence of weight cycling and insulin resistance as possible confounders.
Results
Table 1 shows anthropometric and biochemical characteristics of the sample population.
Table 1.
Anthropometric and biochemical parameters of study population
| Parameter (reference interval or cut-off) | Controls (n= 37) | PCOS patients (n = 36) | P-value | ||
|---|---|---|---|---|---|
|
|
|
||||
| Mean (SD) | Range | Mean (SD) | Range | ||
| Age (years) | 28.3 (9.2) | 18–45 | 27.8 (7.3) | 16–43 | n.s. |
| Height (m) | 1.6 (0.1) | 1.5–1.75 | 1.6 (0.1) | 1.5–1.76 | n.s. |
| Weight (kg) | 59.3 (7.7) | 46–83 | 82.5 (13.9) | 56–116 | <0.0001 |
| BMI (<29.9 kg/m2) | 22.2 (2.6) [10.8] | 18.4–29.8 | 31.5 (5.6) [88.8] | 20–43.7 | <0.0001 [<0.0001] |
| WC (<80 cm) | 74.2 (8.4) [20.6] | 52–93.5 | 98.4 (14.2) [88.9] | 78–135 | <0.0001 [<0.0001] |
| Glucose (<100 mg/dL) | 87.6 (8.7) [5.6] | 74–111 | 89.7 (11.8) [8.3] | 74–137 | n.s. [n.s.] |
| Insulin (4.0–23.5 microun/mL) | 9.4 (3.7) [0] | 4.58–21 | 15.5 (9.6) [14.3] | 2–52 | 0.002 [n.s.] |
| HOMA (<2.5) | 2 (0.8) [27.8] | 0.98–4 | 3.6 (2.6) [65.7] | 0.45–11.5 | 0.003 [0.006] |
| Total cholesterol (<200 mg/dL) | 180.4 (34.4) [20] | 142–283 | 197.1 (31) [42.4] | 142–272 | 0.04 [n.s.] |
| Triglycerides (<150 mg/dL) | 71.0 (60.7) [6.7] | 22–351 | 121.1 (57.6) [20.6] | 43–265 | 0.001 [n.s.] |
| HDL cholesterol (>50 mg/dL) | 58.7 (11.2) [11.1] | 44–94 | 56.9 (15.4) [45.5] | 30–87 | [n.s.] [0.009] |
| LDL cholesterol (<130 mg/dL) | 113.4 (30.8) [16.7] | 73.2–209.4 | 108.9 (38.1) [22.9] | 0–186.6 | n.s. [n.s.] |
Data are reported as means (SDs), percentage of altered values are reported in squared brackets. Significance: p<0.05.
BMI, body mass index; HOMA, Homeostasis Model Assessment; n.s., not significant; PCOS, polycystic ovary syndrome; WC, waist circumference.
Most of PCOS patients (88.8%), had obesity when compared to controls (10.8%), with higher mean BMI (31.5 ± 5.6 kg/m2 vs 22.2 ± 2.6 kg/m2; P < 0.0001, respectively). WC was significantly higher in PCOS patients than controls (98.4 ± 14.2 cm vs 74.2 ± 8.4 cm; P < 0.0001, respectively).
Energy and macronutrient intake of the study population are reported in Table 2 and compared to the Italian reference intakes (LARN 2014).31 Although PCOS patients had a significantly higher mean BMR than controls (1658.7 ± 201.1 kcal vs 1359.2 ± 103.7 kcal; P < 0.0001, respectively), their EI was significantly lower (1790.1 ± 365.5 kcal vs 1975.5 ± 186.1; P < 0.001, respectively), suggesting a frequent UR, positive in 47.2% of PCOS patients vs 2.7% of controls (P < 0.0001).
Table 2.
Energy and macronutrients intake of study population
| Parameters (reference interval; cut-off value) | Controls (n = 37) | PCOS patients (n = 36) | P-value | ||
|---|---|---|---|---|---|
|
|
|
||||
| Mean (SD) | Range | Mean (SD) | Range | ||
| BMR (kcal) | 1359.2 (103.7) | 1172.0–1716.0 | 1658.7 (201.1) | 1316.0–2024.8 | <0.0001 |
| EI (kcal) | 1975.5 (186.1) | 1633.7–2502.6 | 1790.1 (365.5) | 906.4–2766.0 | 0.007 |
| EI/BMR (<1.3) | 1.5 (0.2) [5.4] | 0.9–1.9 | 1.1 (0.3) [86.1] | 0.56–1.9 | <0.0001 [<0.0001] |
| Carbohydrates (45–60%) | 50.5 (8.0) [16.2] | 32.8–63.9 | 50.6 (9.2) [11.1] | 31.4–72.9 | n.s. [n.s.] |
| Lipids (20–35%) | 35.2 (6.5) [51.4] | 25.9–49.6 | 33.6 (7.2) [38.9] | 19.3–54.8 | n.s. [n.s.] |
| Proteins (0.9 g/kg body weight) | 1.3 (0.2) [97.3] | 0.8–1.8 | 0.8 (0.2) [13.9] | 0.4–1.6 | <0.0001 [<0.0001] |
| Simple sugar (<15%) | 27.3 (9.8) [97.3] | 14.3–55.8 | 21.2 (10.3) [69.4] | 5.9–54.8 | 0.01 [0.004] |
| Fibre (>25 g) | 17.5 (5.2) [86.5] | 8.2–28.54 | 17.7 (6.5) [86.1] | 5.5–34.7 | n.s. [n.s.] |
Data are reported as means (SDs). Percentage of altered values, according to LARN 2014 guidelines27 are reported in squared brackets. Significance: p<0.05.
BMR, basal metabolic rate; EI, energy intake; n.s., not significant.
The percentage of EI from total carbohydrates did not differ between the two groups except for simple sugars. The percentage of EI from simple sugars was higher than recommended31 in both groups but, it was significantly lower in PCOS than controls (21.2 ± 10.3% vs 27.3 ± 9.8%; P < 0.01, respectively).
Biochemical parameters assessment reported a HOMA index value significantly higher in PCOS patients than controls (3.6 ± 2.6 vs 2.0 ± 0.8; P = 0.003, respectively) highlighting insulin resistance in 65.7% of PCOS patients and in 27.8% of controls (P = 0.006). While mean glucose levels were under the relevant cut-off both in PCOS patients and controls and did not differ significantly between groups; the mean insulin levels were significantly higher in PCOS patients than controls (15.5 ± 9.6 microun/mL vs 9.4 ± 37 microun/mL; P = 0.002, respectively) and not within the relevant reference interval only in 14% of patients.
The protein intake (g/kg body weight) was significantly higher in controls than PCOS cases (1.3 ± 0.2 g/kg body weight vs 0.8 ± 0.2 g/kg body weight; P < 0.0001, respectively); even though in both groups was observed a protein intake higher than recommended31 in 97.3% of subjects and 69.4% of subjects, respectively, for controls and women with PCOS (P < 0.0001). The percentage of EI from lipids did not differ significantly between the two groups. Fibre intake was under the relevant cut-off31 in the majority of PCOS patients and controls.
Concerning lipid panel parameters, total cholesterol levels were significantly higher in PCOS patients than controls (197.1 ± 31.0 mg/dL vs 180.4 ± 34.4 mg/dL; P < 0.05, respectively) and were above the cut-off value in the 38.8% of PCOS patients and 16.2% of controls (P = 0.05). Although mean triglycerides levels were under the cut-off value in both groups, they were significantly higher in PCOS patients than controls. The HDL and LDL cholesterol levels were, respectively, above and below the relevant cut-offs in most cases, but the percentage of HDL and LDL cholesterol levels above and below the cutoff values did not differ significantly between the two groups.
PCOS patients had more dietary attempts to lose weight than controls: 77.78% vs 13.51%; P < 0.001 and, the presence of weight cycling was more frequently reported in PCOS group as well (33.33% vs 2.7%; P < 0.001, respectively).
The logistic regression analysis, identified a significant association of UR in PCOS patients (Odds Ratio = 27, P = 0.002), independently from age, BMI, the presence of weight cycling and HOMA.
Discussion
Accurate measurement of diet and EI is important when focusing on associations between nutrients and health.32 While collecting subjective EI by using questionnaires is relatively easy and inexpensive, such data tend to be misreported, which provide unreliable estimates of energy consumed.33
More direct measures of energy expenditure such as whole-body calorimetry and the use of biomarkers as urinary nitrogen excretion and doubly labelled water confirm that misreporting is common in self-reported dietary assessments, with a strong tendency towards UR32,34 regarding both type of food items and EI.
Particularly, dietary self-recording is influenced by subjects’ characteristics. The magnitude of UR increases in subjects with higher BMIs, particularly women,15 which misleads to draw the conclusion that individuals with overweight or obesity often consume less energy compared with their normal-weight counterparts (differential misreporting).11 Therefore, misreporting identification and analysis is crucial to the appropriate interpretation of nutritional data.
PCOS is a heterogeneous syndrome characterised by multiple metabolic issues, including obesity, early diabetes, high blood pressure, dyslipidaemia and fatty liver.8,9 The first-line therapy for PCOS patients is weight loss with a focus on diet and regular exercise.6,35 As previously reported,3,36 PCOS and its metabolic comorbidities may be explained by the existence of a vicious cycle. A chronic androgen excess of ovarian and/or adrenal origin, leads to abdominal adiposity and android obesity in affected women.36 Abdominal adiposity favours hypoadiponectinaemia, adipose tissue dysfunction, local and systemic cytokine excess and oxidative stress, among other mechanisms of disease.36 It also promotes further androgen excess both directly by the ovaries and adrenals response to the inflammatory mediators, and indirectly by the development of insulin resistance and compensatory hyperinsulinaemia, because insulin facilitates androgen secretion by these glands.36 Undeniably, our PCOS patients exhibited significantly higher BMI and WC, when compared to controls, with 89% of them classified as Class I obesity (BMI: 30–34.9 kg/m2). Moreover, abdominal obesity of our PCOS patients corresponded with insulin resistance; in fact, HOMA and insulin levels were significantly higher in PCOS subjects than controls and 65% of women with PCOS reported an insulin resistance. In addition, PCOS patients also had significantly higher total cholesterol and triglycerides levels than controls.
Concerning the UR phenomenon, in our sample, the subjects with PCOS reported significantly higher BMR and lower EI, than controls, which explains the high prevalence of UR in about half of them (47.2%), according to Goldberg index.26
Most of our PCOS patients had obesity, which may lead per se to UR.13,15 Therefore, obesity could be considered a confounding factor in the energy UR assessment of patients with PCOS. Weight loss has been shown to have a positive effect on fertility and metabolic profile35 and calorie-restricted diet has been recommended for patients with PCOS with excessive weight but weight maintenance is hard to achieve and most of the subjects regain weight, which puts them at risk for weight cycling.37 In our study, the percentage of women with PCOS who had previously participated in a weight loss programme was significantly higher than in controls and there was a frequent occurrence (30%) of weight cycling—another potential confounding factor in the energy UR assessment. Finally, another possible confounding factor in UR assessment could be insulin resistance condition; in fact, it has been previously described by Georgopoulos et al.18 that women with PCOS, particularly those with insulin resistance, presented a significantly decreased basal metabolic rate.
However, in our pilot study, a significant and remarkable association was observed between energy UR and PCOS, even taking into account the possible confounding effect of BMI, the presence of weight cycling and insulin resistance.
As previously discussed, misreporting is not limited only to EI but may also affect the macronutrient composition of the diet. In fact, some studies highlighted that UR is characterised by a tendency to report relatively low intake of high fat and sugar-rich foods, which are perceived to be unhealthy and energy dense.17
Analysing the percentage of EI from macronutrients by means of a non-consecutive three-day dietary diary, we observed no differences between the groups as far as fat intake, while protein intake reporting was significantly lower. Additionally, we observed discrepancies between the macronutrient intake report and the anthropometric and biochemical parameters evaluated in the PCOS group that reported a significant lower intake of simple sugars despite higher triglycerides plasma concentration and insulin resistance. As highlighted by Rasmussen et al.,38 who characterised misreporters of EI and expenditure in 138 volunteers founding that the percentage energy from added sugar was lower and the percentage energy from protein was higher among under-reporters, it is important to be aware that not all food items or nutrients are under-reported to the same degree.
This study presented certain limitations. We cannot determine whether individuals with PCOS systematically under-reported or instead under-ate39 during the dietary recording period (three non-consecutive days). We can only observe that biochemical and anthropometric characteristics of PCOS patients did not match with the reported dietary EI, especially from sugars. Additionally, the reported EI from the different macronutrients was not compared to gold standard for energy and/or macronutrient intake assessment.
Moreover, BMR was not measured by indirect calorimetry, but it was estimated by Schofield equation.29
Finally, it should be acknowledged that other factors (increased adiposity or body size, dieting behaviour, eating restraint, gender, socioeconomic status, lack of motivation to fill out a dietary diary, social expectations and testing environment nature) may influence EI UR and further studies should investigate their relation to UR in subjects with PCOS.40
In conclusion, to the best of our knowledge, this is the first pilot study to assess energy UR in PCOS. These results demonstrate that subjects with PCOS tend to underreport foods rich in simple sugars rather than underreport their total dietary intake. These results may have implications for the interpretation of diet and health correlations in this population. Moreover, it may be an obstacle to effective nutritional counselling which requires a multidisciplinary approach including psychological, behavioural, sociological and physiological skills to achieve meaningful clinical outcomes.
Acknowledgments
Funding source
No funding was received for this study.
Footnotes
Conflict of interest
The authors declare no potential conflict of interests.
Authorship
RD and VB equally contributed to the conception and design of the research. HC and DB contributed to the design of the research. RD, VB, DB and GB contributed to the acquisition and analysis of the data. GB, FCS, REN and HC contributed to interpretation of the data. RD, VB, GB, FCS, REN and HC drafted the manuscript. All authors are in agreement with the manuscript and declare that the content has not been published elsewhere. The authors are very grateful to Dr Fonte, Dr Maffoni, Dr Cossali and Dr Testa for the patients and controls enrolment support.
References
- 1.Diamanti-Kandarakis E, Kouli CR, Bergiele AT, et al. A survey of the polycystic ovary syndrome in the Greek island of Lesbos: hormonal and metabolic profile. J Clin Endocrinol Metab. 1999;84:4006–11. doi: 10.1210/jcem.84.11.6148. [DOI] [PubMed] [Google Scholar]
- 2.Rotterdam ESHRE/ASRM-Sponsored PCOS Consensus Workshop Group. Revised 2003 consensus on diagnostic criteria and long-term health risks related to polycystic ovary syndrome. Fertil Steril. 2004;81:19. doi: 10.1016/j.fertnstert.2003.10.004. [DOI] [PubMed] [Google Scholar]
- 3.March WA, Moore VM, Willson KJ, Phillips DI, Norman RJ, Davies MJ. The prevalence of polycystic ovary syndrome in a community sample assessed under contrasting diagnostic criteria. Hum Reprod. 2010;25:544–51. doi: 10.1093/humrep/dep399. [DOI] [PubMed] [Google Scholar]
- 4.Balen A. The pathophysiology of polycystic ovary syndrome: trying to understand PCOS and its endocrinology. Best Pract Res Clin Obstet Gynaecol. 2004;18:685–706. doi: 10.1016/j.bpobgyn.2004.05.004. [DOI] [PubMed] [Google Scholar]
- 5.Carmina E, Azziz R. Diagnosis, phenotype and prevalence of polycystic ovary syndrome. Fertil Steril. 2006;86:S7–8. doi: 10.1016/j.fertnstert.2006.03.012. [DOI] [PubMed] [Google Scholar]
- 6.Setji TL, Brown AJ. Polycystic ovary syndrome: update on diagnosis and treatment. Am J Med. 2014;127:912–9. doi: 10.1016/j.amjmed.2014.04.017. [DOI] [PubMed] [Google Scholar]
- 7.Diamanti-Kandarakis E, Argyrakopoulou G, Economou F, Kandaraki E, Koutsilieris M. Defects in insulin signaling pathways in ovarian steroidogenesis and other tissues in polycystic ovary syndrome (PCOS) J Steroid Biochem Mol Biol. 2008;109:242–6. doi: 10.1016/j.jsbmb.2008.03.014. [DOI] [PubMed] [Google Scholar]
- 8.Ehrmann DA, Barnes RB, Rosenfield RL, Cavaghan MK, Imperial J. Prevalence of impaired glucose tolerance and diabetes in women with polycystic ovary syndrome. Diabetes Care. 1999;22:141–6. doi: 10.2337/diacare.22.1.141. [DOI] [PubMed] [Google Scholar]
- 9.Dokras A. Cardiovascular disease risk factors in polycystic ovary syndrome. Semin Reprod Med. 2008;26:39–44. doi: 10.1055/s-2007-992923. [DOI] [PubMed] [Google Scholar]
- 10.Sirmans SM, Pate KA. Epidemiology, diagnosis, and management of polycystic ovary syndrome. Clin Epidemiol. 2013;6:1–13. doi: 10.2147/CLEP.S37559. [DOI] [PMC free article] [PubMed] [Google Scholar]
- 11.Jessri M, Lou WY, L’Abbé MR. Evaluation of different methods to handle misreporting in obesity research: evidence from the Canadian national nutrition survey. Br J Nutr. 2016;115:147–59. doi: 10.1017/S0007114515004237. [DOI] [PubMed] [Google Scholar]
- 12.EFSA. Diet-disease associations: Future directions in nutritional epidemiology research. Am J Epidemiol. 2015;181:234–6. doi: 10.1093/aje/kwu306. [DOI] [PubMed] [Google Scholar]
- 13.Maurer J, Taren DL, Teixeira PJ, et al. The psychosocial and behavioral characteristics related to energy misreporting. Nutr Rev. 2006;64:53–66. doi: 10.1111/j.1753-4887.2006.tb00188.x. [DOI] [PubMed] [Google Scholar]
- 14.Mendez AM. Invited commentary: dietary misreporting as a potential source of bias in diet-disease associations: future directions in nutritional epidemiology research. Am J Epidemiol. 2015;181:234–6. doi: 10.1093/aje/kwu306. [DOI] [PubMed] [Google Scholar]
- 15.McKenzie DC, Johnson RK, Harvey-Berino J, Gold BC. Impact of interviewer’s body mass index on underreporting energy intake in overweight and obese women. Obes Res. 2002;10:471–7. doi: 10.1038/oby.2002.65. [DOI] [PubMed] [Google Scholar]
- 16.Puhl R, Suh Y. Health consequences of weight stigma: implications for obesity prevention and treatment. Curr Obes Rep. 2015;4:182–90. doi: 10.1007/s13679-015-0153-z. [DOI] [PubMed] [Google Scholar]
- 17.Ferrari P, Slimani N, Ciampi A, et al. Evaluation of under- and overreporting of energy intake in the 24-hour diet recalls in the European Prospective Investigation into Cancer and Nutrition (EPIC) Public Health Nutr. 2002;5:1329–45. doi: 10.1079/PHN2002409. [DOI] [PubMed] [Google Scholar]
- 18.Georgopoulos NA, Saltamavros AD, Vervita V, et al. Basal metabolic rate is decreased in women with polycystic ovary syndrome and biochemical hyperandrogenemia and is associated with insulin resistance. Fertil Steril. 2009;92:250–5. doi: 10.1016/j.fertnstert.2008.04.067. [DOI] [PubMed] [Google Scholar]
- 19.World Health Organization. Physical status: the use and interpretation of anthropometry. Report of the WHO Expert Committee. World Health Organ Technical Report Series. 1995;854:1–52. [PubMed] [Google Scholar]
- 20.Gayoso-Diz P, Otero-González A, Rodriguez-Alvarez MX, et al. Insulin resistance (HOMA-IR) cut-off values and the metabolic syndrome in a general adult population: effect of gender and age: EPIRCE cross-sectional study. BMC Endocr Disord. 2013;13:47. doi: 10.1186/1472-6823-13-47. [DOI] [PMC free article] [PubMed] [Google Scholar]
- 21.Madigan CD, Pavey T, Daley AJ, Jolly K, Brown WJ. Is weight cycling associated with adverse health outcomes? A cohort study. Prev Med. 2018;108:47–52. doi: 10.1016/j.ypmed.2017.12.010. [DOI] [PubMed] [Google Scholar]
- 22.Basiotis PP, Welsh SO, Cronin FJ, Kelsay JL, Mertz W. Number of days of food intake records required to estimate individual and group nutrient intakes with defined confidence. J Nutr. 1987;117:1638–41. doi: 10.1093/jn/117.9.1638. [DOI] [PubMed] [Google Scholar]
- 23. [accessed 10 January 2018];Food Composition Database for Epidemiological Studies in Italy. (Available from: http://www.bda-ieo.it/wordpress/en/
- 24.Turconi G, Celsa M, Rezzani C, Biino G, Sartirana MA, Roggi C. Reliability of a dietary questionnaire on food habits, eating behavior and nutritional knowledge of adolescents. Eur J Clin Nutr. 2003;57:753–63. doi: 10.1038/sj.ejcn.1601607. [DOI] [PubMed] [Google Scholar]
- 25. [accessed 10 January 2018];Linee guida per un corretto stile di vita. (Available from: http://archivio.pubblica.istruzione.it/essere_benessere/allegati/linee_guida.pdf.
- 26.Goldberg GR, Black AE, Jebb SA, et al. Critical evaluation of energy intake data using fundamental principles of energy physiology: 1. Derivation of cut-off limits to identify under-recording. Eur J Clin Nutr. 1991;45:569–81. [PubMed] [Google Scholar]
- 27. [accessed 10 January 2018];Example of a protocol for identification of misreporting (under- and overreporting of energy intake) based on the PILOT-PANEU project. (Available from: http://www.efsa.europa.eu/sites/default/files/efsa_rep/blobserver_assets/3944A-8-2-1.pdf.
- 28.Food and Agriculture Organization of the United Nations/World Health Organizations/United Nations University (FAO/WHO/UNU) Report of a joint FAO/WHO/UNU expert consultation. Rome: FAO; 2004. Human energy requirements. Food and Nutrition Technical Reports Series No. 1. [Google Scholar]
- 29.Schofield WB. Predicting basal metabolic rate, new standards and review of previous work. Hum Nutr Clin Nutr. 1985;39:5–41. [PubMed] [Google Scholar]
- 30.Black AE. Critical evaluation of energy intake using the Gold-berg cut-off for energy intake: basal metabolic rate. A practical guide to its calculation, use and limitations. Int J Obes Relat Metab Disord. 2000;24:1119–30. doi: 10.1038/sj.ijo.0801376. [DOI] [PubMed] [Google Scholar]
- 31.LARN. SINU. SICS Editore; 2014. Livelli di Assunzione di Riferimento di Nutrienti ed energia per la popolazione italiana - IV revisione. [Google Scholar]
- 32.Bel-Serrat S, Julián-Almárcegui C, González-Gross M, et al. Correlates of dietary energy misreporting among European adolescents: the Healthy Lifestyle in Europe by Nutrition in Adolescence (HELENA) study. Br J Nutr. 2016;115:1439–52. doi: 10.1017/S0007114516000283. [DOI] [PubMed] [Google Scholar]
- 33.Vainik U, Konstabel K, Lätt E, Mäestu J, Purge P, Jürimäe J. Diet misreporting can be corrected: confirmation of the association between energy intake and fat-free mass in adolescents. Br J Nutr. 2016;116:1425–36. doi: 10.1017/S0007114516003317. [DOI] [PubMed] [Google Scholar]
- 34.Mullaney L, O’Higgins AC, Cawley S, Doolan A, McCartney D, Turner MJ. An estimation of periconceptional under-reporting of dietary energy intake. J Public Health (Oxf) 2015;37:728–36. doi: 10.1093/pubmed/fdu086. [DOI] [PubMed] [Google Scholar]
- 35.Williams T, Mortada R, Porter S. Diagnosis and treatment of polycystic ovary syndrome. Am Fam Physician. 2016;94:106–13. [PubMed] [Google Scholar]
- 36.Escobar-Morreale HF, San Millan JL. Abdominal adiposity and the polycystic ovary syndrome. Trends Endocrinol Metab. 2007;18:266–72. doi: 10.1016/j.tem.2007.07.003. [DOI] [PubMed] [Google Scholar]
- 37.Strohacker K, Carpenter KC, McFarlin BK. Consequences of weight cycling: an increase in disease risk? Int J Exerc Sci. 2009;2:191–201. [PMC free article] [PubMed] [Google Scholar]
- 38.Rasmussen LB, Matthiessen J, Biltoft-Jensen A, Tetens I. Characteristics of misreporters of dietary intake and physical activity. Public Health Nutr. 2007;10:230–7. doi: 10.1017/S136898000724666X. [DOI] [PubMed] [Google Scholar]
- 39.Sugimoto M, Asakura K, Masayasu S, Sasaki S. Relatively severe misreporting of sodium, potassium, and protein intake among female dietitians compared with nondietitians. Nutr Res. 2016;36:818–26. doi: 10.1016/j.nutres.2016.04.011. [DOI] [PubMed] [Google Scholar]
- 40.Abbot JM, Thomson CA, Ranger-Moore J, et al. Psychosocial and behavioral profile and predictors of self-reported energy underreporting in obese middle-aged women. J Am Diet Assoc. 2008;108:114–9. doi: 10.1016/j.jada.2007.10.007. [DOI] [PubMed] [Google Scholar]