

Abstract
Despite their mutually exclusive definitions, pitch and timbre perception interact with each other in normal-hearing (NH) listeners. Cochlear implant (CI) users have worse than normal pitch and timbre perception. However, the pitch-timbre interaction with CIs is not well understood. This study tested the interaction between pitch and sharpness (an aspect of timbre) perception related to the fundamental frequency (F0) and spectral slope of harmonic complex tones, respectively, in both NH listeners and CI users. In experiment 1, the F0 (and spectral slope) difference limens (DLs) were measured with a fixed spectral slope (and F0) and 20-dB amplitude roving. Then, the F0 and spectral slope were varied congruently or incongruently by the same multiple of individual DLs to assess the pitch and sharpness ranking sensitivity. Both NH and CI subjects had significantly higher pitch and sharpness ranking sensitivity with congruent than with incongruent F0 and spectral slope variations, and showed a similar symmetric interaction between pitch and timbre perception. In experiment 2, CI users’ melodic contour identification (MCI) was tested in three spectral slope (no, congruent, and incongruent spectral slope variations by the same multiple of individual DLs as the F0 variations) and two amplitude conditions (0- and 20-dB amplitude roving). When there was no amplitude roving, the MCI scores were significantly higher with congruent than with no, and in turn than with incongruent spectral slope variations. The 20-dB amplitude roving significantly reduced the overall MCI scores and the effect of spectral slope variations. These results reflected a confusion between higher (or lower) pitch and sharper (or duller) timbre and offered important implications for understanding and enhancing pitch and timbre perception with CIs.
Keywords: cochlear implant, pitch, timbre, fundamental frequency, spectral slope
INTRODUCTION
Pitch, timbre, and loudness are the three major dimensions of auditory perception, and they all play an important role in the perception of speech and music. The American National Standards Institute (ANSI 1994) defines pitch as the perceptual attribute based on which sounds can be ordered from low to high. However, this definition does not fully describe the everyday use of pitch. For example, pitch perception is both ordinal (i.e., one sound is higher than the other) and rational (i.e., the size of pitch change depends on the frequency ratio in terms of semitones). As such, a more operational definition of musical pitch is the perceptual attribute that carries melodic information in a sequence of sounds, including both melodic contour and interval (i.e., the direction and size of pitch change, respectively; e.g., Dowling and Fujitani 1971). In speech, pitch is the primary carrier of prosodic information such as speech intonations and vocal emotions. Pitch also conveys semantic information in tonal languages such as Mandarin Chinese using lexical tones. Vowels and voiced consonants in speech, as well as instrument notes in music, that evoke salient pitch can be viewed as harmonic complex tones consisting of the fundamental frequency (F0) and harmonics. The perceived pitch of harmonic complex tones depends mainly on the F0 but not on the amplitude and spectral centroid (e.g., McDermott et al. 2008).
Timbre is the other auditory perceptual dimension that is of interest in this study. According to ANSI (1994), timbre is the perceptual attribute used to differentiate sounds with the same pitch, loudness, and duration. Different instruments playing the same note with the same loudness are discriminated based on their different timbres. However, it is not very useful to define timbre by what it is not. A few methods have been used to study what timbre is. For example, multidimensional scaling of the (dis)similarity judgments on pairs of real or synthesized instrument sounds shows that the timbre space of normal-hearing (NH) listeners is best fit with three dimensions, which are psychophysically related to the temporal envelope cues such as attack time, spectral envelope cues such as spectral centroid and spread, and spectral fine structure cues such as spectral irregularity, respectively (e.g., Grey 1977; McAdams et al. 1995). Timbre perception of sounds with systematically different spectral envelopes can be adequately described using subjective ratings on four verbal scales of dull-sharp, compact-scattered, colorful-colorless, and full-empty, among which the dull-sharp scale associated with the upper frequency limit and the spectral slope carries most of the variance (von Bismarck 1974a, b). The term timbre has been used extensively in the music literature but not in the speech literature. However, our identification of vowels and consonants in speech is in fact largely based on timbre-related spectral envelope cues such as the frequencies of spectral peaks and the slope of spectral envelope. Timbre (sometimes called sound quality) may also contribute to talker identification, vocal emotion recognition, and Mandarin tone recognition (e.g., Klatt and Klatt 1990; Lee 2009; Scherer 2003).
Although pitch and timbre have mutually exclusive definitions, their perception is not independent from each other. The perceptual interaction between pitch and timbre has been shown in studies using objective listening tasks. For example, Beal (1985) asked musicians and non-musicians to judge whether the two chords in each trial had the same or different notes (i.e., a pitch discrimination task) or whether the chords were played on the same or different instruments (i.e., a timbre discrimination task). The tested chords (E major, A major, C minor, etc.) were played on three distinctive instruments (guitar, piano, and harpsichord). Results showed that identical chords played on different instruments were more poorly recognized than those played on the same instrument. In contrast, the recognition of identical instruments was less affected when different chords were played instead of the same chord. Thus, the effect of timbre variations on pitch discrimination was stronger than that of pitch variations on timbre discrimination (i.e., an asymmetric interaction between pitch and timbre). Compared to non-musicians, musicians were better able to ignore the different timbres of instruments when performing pitch discrimination in diatonic chords that only used notes from the same key but not in non-diatonic chords that used notes from outside of the key. Pitt (1994) asked musicians and non-musicians to categorize the type of change (no, pitch, instrument, and both change) between two notes in each trial. The stimuli were a note D4 (294 Hz) and a note G#4 (417 Hz) played on a trumpet and a piano. The categorization errors again showed that non-musicians weighted timbre more heavily than pitch, while musicians did not. In addition, Pitt (1994) also used the speeded classification task (Garner 1974) to investigate the pitch-timbre interaction. For each note, subjects identified one of the two values along the target dimension (low and high in the pitch-focus condition; trumpet and piano in the timbre-focus condition). The value along the non-target dimension was fixed in the baseline condition, randomly varied in the filtering condition, and correlated with that along the target dimension in the correlated condition. Subjects responded more slowly and less accurately in the filtering condition than in the baseline condition, due to the failure of selective attention to the target dimension when the non-target dimension varied unpredictably. Timbre variations interfered with pitch perception more than the reverse in non-musicians, but similar to the reverse in musicians. Musicians had faster response time in the correlated condition than in the baseline condition, showing the ability to make use of the co-varied non-target cues to facilitate target perception. Performance of both musicians and non-musicians in the correlated condition was better with congruent (i.e., the low piano and high trumpet notes) than with incongruent trials (i.e., the high piano and low trumpet notes). The congruency effect possibly arose from a confusion between positive poles (i.e., high pitch and sharp timbre) or negative poles (i.e., low pitch and dull timbre) of the two dimensions. These speeded classification results were similar to those in Krumhansl and Iverson (1992) and Melara and Marks (1990). However, in all these studies, there was a limited number of stimuli and the pitch and timbre variations were not controlled for perceptual salience. Recently, Allen and Oxenham (2014) measured musicians and non-musicians’ sensitivity to small variations in F0 (i.e., pitch ranking) or spectral centroid (i.e., timbre ranking) of synthesized harmonic complex tones, first with no changes in the non-target dimension. The basic F0 and spectral centroid difference limens (DLs) of each listener were used to determine the amount of F0 and spectral centroid variations in the following experiments. When an increasing amount of random variations happened in the non-target dimension, both the F0 and spectral centroid DLs significantly worsened. In the correlated condition, the F0 and spectral centroid varied together by the same multiple of individual DLs either congruently or incongruently. The pitch and timbre ranking sensitivity both increased with congruent than with incongruent F0 and spectral centroid variations, showing that an increase (or decrease) in pitch was confused with an increase (or decrease) in timbre. Importantly, pitch and timbre perception interacted with each other symmetrically in both musicians and non-musicians, possibly due to the equalized perceptual salience of pitch and timbre variations across subjects.
So far, our understanding of the pitch-timbre interaction is mostly from studies of NH listeners, and little is known about how pitch and timbre perception may interact with each other in hearing impaired listeners with cochlear implants (CIs). Current CIs support good speech perception in quiet for profoundly deaf people using only temporal envelope cues from a small number of frequency channels (Shannon et al. 1995). However, it is widely held that the 12 to 22 implanted electrodes stimulated with broad current spread cannot resolve the F0 and harmonics of input sound (Oxenham 2008). Besides, most CI users cannot discern temporal modulations above 300 Hz (Zeng 2002) and CIs generally do not preserve temporal fine structures. As such, CI users are less sensitive to both the direction and size of pitch change than NH listeners (e.g., Gfeller et al. 2007; Kang et al. 2009; Luo et al. 2014a). The poor spectral resolution of CI users also affects their timbre perception. For example, CI users identify instruments less accurately than NH listeners and they often rate the sound quality of string instruments and those played in the high-frequency range more poorly (i.e., more scattered, less full, and duller) than NH listeners (e.g., Gfeller et al. 2002b). The timbre space of CI users based on the multidimensional scaling results (Kong et al. 2011; Macherey and Delpierre 2013) only slightly differs from that of NH listeners. Both have the first two dimensions strongly correlated with the temporal envelope attack time and the spectral envelope centroid, respectively, although it is inconclusive whether CI users give relatively more weight to the spectral dimension (and less weight to the temporal dimension) than NH listeners. Note that the ability of CI users to discriminate specific timbre cues such as the spectral centroid and spectral slope has not yet been measured. On top of that, there has been no systematic evaluation of the pitch-timbre interaction in CI users. Recently, Crew et al. (2016) created a sung speech database with monosyllabic words produced at the F0s of different musical notes to test speech and music perception with CIs. Sentence recognition (somewhat related to timbre perception) was similar for sung speech with constant or variable F0s, while pitch-related melodic contour identification was significantly better with constant than with variable words (timbre). Different F0s were not well represented in the CI stimulation patterns to impact sentence recognition, while the timbre variations across different words may have made spectral envelope cues unreliable for pitch perception and also interfered with pitch perception using temporal envelope cues. Although the results with sung speech indicated a possible asymmetric interaction between pitch and timbre perception in CI users, the salience of pitch and timbre variations was not carefully controlled and the effect of cue congruency was not investigated in Crew et al. (2016). For speech and music sounds in daily life, pitch and timbre may or may not vary congruently and their interaction may underlie CI users’ deficits in speech and music perception. A better understanding of the pitch-timbre interaction with CIs might provide important insights for signal processing or rehabilitation strategies to remediate these deficits in CI performance. For example, based on the pitch-loudness interaction, a pre-processing strategy varying the amplitude envelope to follow the F0 contour has been designed to improve CI users’ Mandarin tone recognition without adversely affecting vowel recognition (Luo and Fu 2004).
In experiment 1, we used the method of Allen and Oxenham (2014) to investigate the interaction between pitch perception associated with the F0 and sharpness perception associated with the spectral slope (von Bismarck 1974b) in both NH listeners and CI users. After measuring the F0 and spectral slope DLs with no variations in the non-target dimension, pitch and sharpness ranking was separately tested when the F0 and spectral slope of harmonic complex tones varied by the same multiple of individual DLs either congruently or incongruently. Based on the results of Allen and Oxenham (2014), pitch and sharpness perception was expected to have a symmetric interaction, and the polar correspondence between pitch and sharpness dimensions would lead to higher pitch and sharpness ranking sensitivity with congruent than with incongruent trials in NH listeners. Previous studies showed that the interaction between pitch and timbre perception in NH listeners may happen at different processing levels such as the sensory level and the post-sensory decision level (Allen and Oxenham 2014; Melara and Marks 1990; Silbert et al. 2009). We hypothesized that pitch and sharpness perception may also interact with each other in CI users at least due to the shifted boundary of pitch (and timbre) judgments in response to timbre (and pitch) changes (Silbert et al. 2009), despite the degraded sensory inputs with CIs. As a spectral envelope cue, the spectral slope for sharpness perception may require less spectral resolution and thus may be more salient and perceptible with CIs than the spectral fine structure of F0 for pitch perception. However, in this study, the pitch-sharpness interaction with CIs may be symmetric (similar to that in NH listeners), because the F0 and spectral slope variations were equalized in terms of individual DLs. In experiment 2, we extended the study of Crew et al. (2016) by testing melodic contour identification (MCI) of harmonic complex tones with or without spectral slope variations. When available, the spectral slope variations were congruent or incongruent with the F0 variations, both with the same amount of variations in terms of individual DLs. Loudness cues from spectral slope variations were removed by amplitude roving. We hypothesized that relative to no spectral slope variations, congruent spectral slope variations would improve MCI while incongruent spectral slope variations would impair MCI for CI users.
EXPERIMENT 1: PITCH AND TIMBRE PERCEPTION WITH CONGRUENT AND INCONGRUENT F0 AND SPECTRAL SLOPE VARIATIONS
Experiment 1 tested whether pitch and sharpness perception interacted with each other in both NH listeners and CI users, and whether the interaction reflected a confusion between congruent pitch and sharpness variations (e.g., a higher pitch was confused with a sharper timbre). To answer this question, pitch ranking based on the F0 variations was measured and compared when the spectral slope varied congruently or incongruently with the F0 by the same multiple of individual DLs. Also, sharpness ranking based on the spectral slope variations was measured and compared when the F0 varied congruently or incongruently with the spectral slope by the same amount.
Methods
Subjects
Eight NH listeners (five females and three males) were in the age range of 19–31 years with a mean age of 24 years. Their pure-tone thresholds at octave frequencies from 125 to 8000 Hz were below 20 dB HL in both ears. Ten post-lingually deafened CI users (five females and five males) in the age range of 33–75 years with a mean age of 62 years also participated in this experiment. Demographic details of the CI users can be found in Table 1. None of the participants had extensive musical training before the study. All of them gave informed consent and were compensated for their participation. The study was approved by the Institutional Review Board of Arizona State University.
Table 1.
Demographic details of CI users
| Subject | Age (years) | Gender | Etiology | CI processor/strategy (ear) | Years with CI | Experiment 1 | Experiment 2 |
|---|---|---|---|---|---|---|---|
| CI01 | 73 | Female | Heredity | Harmony/HiRes (R) | 11 | X | X |
| CI02 | 71 | Female | Mumps/genetic | Naida Q90/HiRes120 (R) | 15 | X | |
| CI03 | 67 | Male | Ischemic stroke | Rondo/Unknown (R) | 12 | X | X |
| CI04 | 52 | Female | Rubella | Naida/HiRes120 (L) | 8 | X | |
| CI05 | 60 | Female | Neural degeneration | Naida/Unknown (L) | 12 | X | X |
| CI06 | 33 | Female | Unknown | Harmony/HiRes (L) | 11 | X | |
| CI07 | 72 | Female | Heredity | Harmony/HiRes (L) | 9 | X | |
| CI08 | 69 | Male | Nerve damage | Harmony/HiRes (L) | 8 | X | |
| CI10 | 70 | Female | Ototoxicity | Naida Q70/Unknown (R) | 13 | X | |
| CI12 | 71 | Male | Unknown | Naida Q90/Unknown (L) | 8 | X | |
| CI14 | 55 | Male | Unknown | Naida/Unknown (L) | 8 | X | X |
| CI15 | 66 | Male | Unknown | Naida Q90/HiRes120 (R) | 3 | X | X |
| CI16 | 59 | Female | Unknown | Naida Q70/HiRes120 (R) | 11 | X | |
| CI17 | 64 | Female | Osteoporosis | Naida Q70/HiRes (L) | 3 | X | |
| CI18 | 75 | Male | Unknown | Sonnet/FS4 (L) | 7 | X | X |
Stimuli and Procedure
The stimuli were 400-ms harmonic complex tones with 20-ms raised cosine onset and offset ramps. All the harmonics up to 4000 Hz were included in sine phase. The F0 and spectral slope of the stimuli will be specified during the description of each listening task. Customized MATLAB programs were used to generate the stimuli and control their presentation. The sampling rate was 22,050 Hz and the resolution was 16 bits. The stimuli were presented to individual subjects via a JBL loudspeaker placed 1 m in front of the subject in a double-walled sound-treated booth. CI users were tested with a single CI processor of their own, using the clinical settings. Bimodal CI users were asked to take off their hearing aid in the non-implanted ear and an ear plug was inserted to avoid the use of residual acoustic hearing. For bilateral CI users, only the preferred CI was tested.
Subjects were first tested with the basic pitch and sharpness ranking tasks without non-target variations, which yielded the DLs for F0 and spectral slope, respectively. The individual DLs were needed for the setup of the subsequent tests with combined pitch and sharpness variations. Both pitch and sharpness ranking was tested using a two-alternative, forced-choice (2AFC) task. A 2-down/1-up adaptive procedure was used to track the F0 and spectral slope DLs with 70.7 % correct responses in each task.
For basic pitch ranking, the two stimuli in each trial had the same spectral slope of − 8 dB/octave, but their F0s were centered on a nominal F0 with an adaptive ∆F0. The nominal F0 was roved around 200 Hz by ± 1.58 semitones. As in Luo et al. (2014a), this frequency roving was used to avoid perceptual adaptation to any particular F0. The left panel of Fig. 1 is an example of the amplitude spectra of the two stimuli in a trial of basic pitch ranking. The root mean square (RMS) level of each stimulus was randomly chosen from a 20-dB range (from 55 to 75 dB SPL). This amplitude roving was the same as that needed for the sharpness ranking test (see below). The inter-stimulus-interval was 300 ms. There was an equal probability for the two stimuli to have a higher F0. Subjects were asked to select the stimulus higher in pitch by clicking on one of the two buttons representing the two stimuli. The correct response was the stimulus with a higher F0. Visual feedback regarding the correctness of response was provided after each trial. The adaptive procedure started with a ∆F0 of 6 semitones, which was large enough for most subjects to correctly rank the two pitches. ∆F0 was reduced after two consecutive correct responses, but increased after each incorrect response. ∆F0 was multiplied or divided by 2 during the first four reversals and by √2 thereafter. The procedure continued until 10 reversals or 60 trials were completed, whichever came first. The pitch ranking threshold or the F0 DL was the geometric mean of ∆F0 over the last six reversals. The average F0 DL was calculated geometrically over three runs of the adaptive procedure.
Fig. 1.
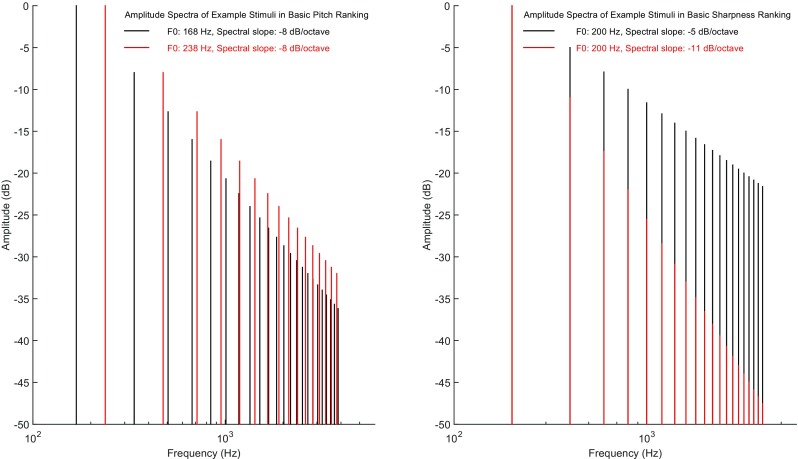
Amplitude spectra of example stimuli in a trial of basic pitch (left panel) and sharpness ranking (right panel). Black lines represent the amplitude in dB of each harmonic in one stimulus, while red lines are for the other stimulus. The F0 and spectral slope of each stimulus are also indicated
For basic sharpness ranking, the two stimuli in each trial had the same F0 of 200 Hz, while their spectral slopes were centered on a nominal spectral slope with an adaptive difference. The nominal spectral slope was roved around − 8 dB/octave by ± 1 dB/octave to avoid perceptual adaptation to any particular spectral slope. This nominal spectral slope was in the middle of the spectral slope range (from − 12 to − 4 dB/octave) of instrument sounds and human voices (Tsang and Trainor 2002). The two stimuli in each trial were separated by a 300-ms temporal gap and both had an equal probability to have a steeper negative spectral slope. Subjects were asked to select the stimulus sharper in timbre by clicking on one of the two buttons representing the two stimuli. Sounds with shallower negative spectral slopes and higher spectral prominence are usually perceived as sharper in timbre by NH listeners (von Bismarck 1974b). As such, the stimulus with a shallower negative spectral slope was considered as the correct response. Before testing, subjects were given examples of different instruments being different in sharpness (e.g., a violin has a sharper timbre than a cello). Practice with feedback was used to demonstrate how a sharper timbre sounded different from a duller timbre. Visual feedback was also given after each trial during formal testing. The adaptive procedure started with a spectral slope difference of 6 dB/octave, which was large enough for most subjects to correctly rank the two stimuli in sharpness. The spectral slope difference was reduced after two consecutive correct responses, but increased after each incorrect response. The difference in spectral slope was multiplied or divided by 2 during the first four reversals and by √2 thereafter. The procedure continued until 10 reversals or 60 trials were completed, whichever came first. The sharpness ranking threshold or the spectral slope DL was the geometric mean of spectral slope differences over the last six reversals. The average spectral slope DL was calculated geometrically over three runs of the adaptive procedure. As shown in the right panel of Fig. 1, the starting spectral slope difference of 6 dB/octave (also the largest one for most subjects) tested in this experiment may lead to an amplitude difference of 26 dB for the highest harmonic at 4000 Hz, if the F0 has a fixed amplitude. The RMS level of each stimulus was thus roved within a 20-dB range from 55 to 75 dB SPL to preclude the use of loudness variations both locally for individual harmonics and globally for the whole stimulus in sharpness ranking. The same range of amplitude roving has also been effectively used in a study of NH listeners’ spectral slope discrimination (Li and Pastore 1995). The CI systems had wide enough input acoustic dynamic ranges (e.g., up to 80 dB for the Advanced Bionics devices tested in this study) to accommodate the 20-dB roving. Although the roved acoustic levels were compressively mapped into the limited electric dynamic ranges of CI users, the 20-dB roving was able to degrade pitch perception across successive notes with CIs (see experiment 2).
After measuring the F0 and spectral slope DLs, pitch and sharpness ranking was separately tested with the F0 and spectral slope varying together in either a congruent or incongruent manner. The method of constant stimuli was used instead of the method of adaptive procedure. In each trial, the variations in F0 and spectral slope between the two stimuli had the same multiple (0.5, 1, 2, and 4) of individual DLs, so that the pitch and sharpness variations were similar in perceptual salience (e.g., Allen and Oxenham 2014). In trials with congruent F0 and spectral slope variations, the stimulus with a higher F0 had a shallower negative spectral slope, while that with a lower F0 had a steeper negative spectral slope (e.g., the left panel of Fig. 2). A higher pitch was thus accompanied by a sharper timbre, and a lower pitch by a duller timbre. In contrast, the incongruent trials combined a higher pitch with a duller timbre and a lower pitch with a sharper timbre. As shown in the right panel of Fig. 2, this was done by using a steeper negative spectral slope for the stimulus with a higher F0, and a shallower negative spectral slope for that with a lower F0. Each multiple of DLs (i.e., 0.5, 1, 2, and 4) was tested for each pairing type (i.e., congruent and incongruent) ten times. The 40 congruent, 40 incongruent, and 80 total trials were tested in random order within a session. The same stimuli were used to test pitch and sharpness ranking separately in counterbalanced order. Feedback was given after each trial. The percent correct scores were recorded for each multiple of DLs and pairing type. The results were averaged over three runs of the session.
Fig. 2.
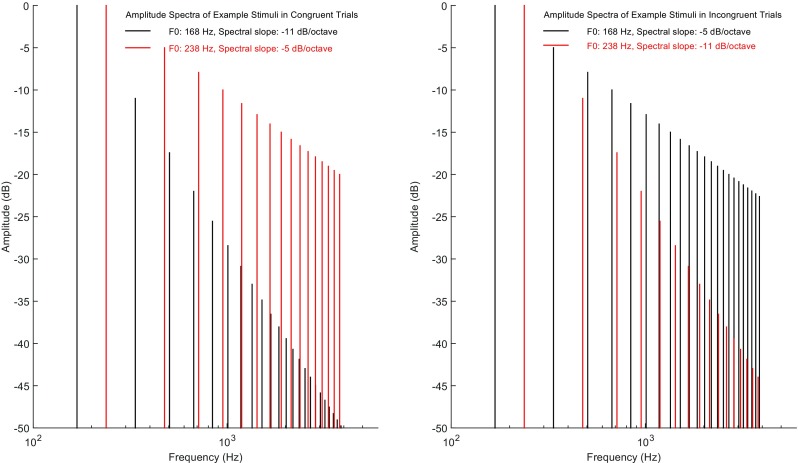
Amplitude spectra of example stimuli in a trial with congruent (left panel) and incongruent pitch and sharpness variations (right panel). Black lines represent the amplitude in dB of each harmonic in the stimulus with a lower F0, while red lines are for that with a higher F0. The F0 and spectral slope of each stimulus are also indicated
Statistical Analysis
NH listeners and CI users’ F0 DLs (and their spectral slope DLs) were compared using a t test if the normality and equal variance assumptions held true. Otherwise, a non-parametric Mann-Whitney rank sum test was used instead. The percent correct scores of pitch and sharpness ranking were converted into d’ values before being analyzed using a mixed-design analysis of variance (ANOVA) to reveal the effects of subject group (CI and NH), perceptual dimension (pitch and sharpness), amount of variations (0.5, 1, 2, and 4 DLs), and pairing type (congruent and incongruent), as well as their interactions. For significant main effects and interactions, post-hoc t tests with Bonferroni correction were performed for pairwise comparisons. SPSS 23 was used for all the statistical tests.
Results
The left panel of Fig. 3 shows the pitch ranking thresholds or F0 DLs of NH listeners and CI users. The F0 DLs with 70.7 % correct responses were on average 0.47 and 1.66 semitones for NH listeners and CI users, respectively. The group difference in F0 DL was significant, as found in a Mann-Whitney rank sum test (U = 7, p = 0.004). The F0 DLs of the two subject groups were not compared using a t test, due to the failure of normality test. The right panel of Fig. 3 shows the sharpness ranking thresholds or spectral slope DLs of NH and CI subjects. The spectral slope DLs with 70.7 % correct responses were on average 1.00 and 1.78 dB/octave for NH and CI subjects, respectively. A t test found that CI users had significantly worse spectral slope DLs than NH listeners (t16 = 2.33, p = 0.03).
Fig. 3.

F0 (left panel) and spectral slope (right panel) difference limens (DLs) of NH listeners (filled circles) and CI users (open circles). Circles represent the mean while error bars represent the standard deviation across subjects
NH and CI subjects’ percent correct scores of pitch and sharpness ranking in the congruent and incongruent trials as a function of the amount of F0 and spectral slope variations in terms of the multiple of DLs were converted into d’ values using the table of Hacker and Ratcliff (1979) by looking up the column for 2AFC task. The d’ value of 4.65 for a score of about 99.95 % correct was used to replace the infinite d’ value for a 100 % correct score; this method has been used by Allen and Oxenham (2014). The d’ values shown in Fig. 4 were analyzed using a mixed-design ANOVA with the perceptual dimension (pitch and sharpness), amount of variations (0.5, 1, 2, and 4 DLs), and pairing type (congruent and incongruent) as the within-subject factors and the subject group (CI and NH) as the between-subject factor. The main effect of subject group was significant (F1,16 = 5.02, p = 0.04), showing that NH listeners had overall higher d’ values than CI users. The perceptual dimension did not have a significant main effect (F1,16 = 0.00, p = 0.98), showing that performance was overall similar for pitch and sharpness ranking. There was a significant main effect of the amount of variations (F3,48 = 99.52, p < 0.001), reflecting the observation that the d’ values increased with larger F0 and spectral slope variations. Post-hoc Bonferroni t tests showed that the overall d’ values significantly differed between any two amounts of F0 and spectral slope variations (p < 0.001). The cue congruency also had a significant main effect (F1,16 = 16.82, p = 0.001), with the d’ values being overall higher in the congruent than in the incongruent trials.
Fig. 4.

Values of d’ for pitch (top panels) and sharpness ranking (bottom panels) of NH listeners (left panels) and CI users (right panels) in congruent (upward triangles) and incongruent trials (downward triangles) as a function of the amount of F0 and spectral slope variations in terms of the multiple of individual difference limens (DLs). Triangles show the mean while error bars represent the standard deviation across subjects. Circles indicate the d’ values of F0 and spectral slope DLs tested without non-target variations
The subject group significantly interacted with the amount of variations (F3,48 = 5.36, p = 0.003). Post-hoc Bonferroni t tests showed that the d’ values of either CI users or NH listeners significantly increased with larger F0 and spectral slope variations (p < 0.01), except from 0.5 to 1 or from 1 to 2 DLs (p > 0.08). Also, the group differences between NH listeners and CI users were significant with 4 DLs (p < 0.001) but not with 0.5, 1, and 2 DLs of F0 and spectral slope variations (p > 0.32). The subject group did not significantly interact with the perceptual dimension (F1,16 = 1.35, p = 0.26) or the cue congruency (F1,16 = 1.57, p = 0.23), suggesting that the group differences were similar for both pitch and sharpness ranking and in both congruent and incongruent trials. Post-hoc Bonferroni t tests showed that the effect of cue congruency was significant in both NH listeners (p < 0.001) and CI users (p = 0.03). The perceptual dimension had no significant interaction with the amount of variations (F3,48 = 1.59, p = 0.21) or the cue congruency (F1,16 = 0.13, p = 0.72), showing that pitch and sharpness ranking performance similarly increased with the amount of variations and varied with the cue congruency. There was a significant interaction between the amount of variations and cue congruency (F3,48 = 5.78, p = 0.002). Post-hoc Bonferroni t tests showed that the performance significantly differed between congruent and incongruent trials with 1, 2, and 4 DLs (p < 0.03) but not with 0.5 DLs (p = 0.37) of F0 and spectral slope variations. In congruent trials, the d’ values were significantly different between any two amounts of F0 and spectral slope variations (p < 0.02), while in incongruent trials, the d’ values significantly increased with larger F0 and spectral slope variations (p < 0.003), except from 0.5 to 1 or from 1 to 2 DLs (p > 0.14). None of the three- and four-way interactions was significant (p > 0.19).
The F0 and spectral slope DLs in the 2-down/1-up adaptive procedure had 70.7 % correct responses for the 2AFC task, which corresponded to a d’ value of 0.77 (Hacker and Ratcliff 1979). The circles in each panel of Fig. 4 show this d’ value for either the F0 or spectral slope variations of 1 DL without non-target variations. For pitch ranking of NH listeners, this d’ value was close to those with incongruent non-target variations, but smaller than those with congruent non-target variations (panel a). For sharpness ranking of NH listeners, this d’ value fell between those with congruent and incongruent non-target variations (panel b). For both pitch and sharpness ranking of CI users, this d’ value overlapped with those with congruent and incongruent non-target variations (panels c and d). Note that the condition without non-target variations was always tested before those with congruent and incongruent non-target variations using a different testing method (i.e., adaptive procedure rather than constant stimuli), making it difficult to compare the various conditions. It is also unclear how the d’ values without non-target variations may differ from those with congruent and incongruent non-target variations when the amount of target and non-target variations is more than 1 DL.
Discussion
This experiment added to the rich literature on the pitch perception deficits with CIs (e.g., Gfeller et al. 2002a; Kang et al. 2009). The loss of spectral and temporal fine structure cues in CI signal processing, along with the older ages of CI users, may explain why CI users had significantly worse F0 DLs than NH listeners in this experiment. The F0 DLs of NH listeners and CI users presented here were slightly worse than those in the previous studies with similar experimental designs, which may be due to the large range (i.e., 20 dB) of amplitude roving used in the current design. For NH non-musicians, Allen and Oxenham (2014) found a mean F0 DL of 1.9 % (or 0.32 semitones), while we found a mean F0 DL of 0.47 semitones. Also, our CI users’ mean F0 DL (1.66 semitones) was worse than that in Luo et al. (2014a) (0.77 semitones). Both Luo et al. (2014a) and Allen and Oxenham (2014) did not use amplitude roving.
This experiment also specifically showed the poorer ability of CI users to perceive sharpness associated with the spectral slope as compared to NH listeners. Contrary to our hypothesis, CI users did not rank the global slopes of spectral envelope, a critical aspect of spectral profile, as well as NH listeners did. The effect of the number of frequency channels and that of the degree of channel interactions on spectral slope processing is yet to be tested using acoustic CI simulations in NH listeners (e.g., Shannon et al. 1995). The pre-emphasis of high-frequency components in CI processing may also affect the representation and perception of spectral slopes. The basic F0 and spectral slope DLs without non-target variations did not correlate with each other in either NH listeners (r = 0.64, p = 0.09) or CI users (r = − 0.18, p = 0.61), suggesting that the two listening tasks may depend on different acoustic cues. For example, temporal periodicity cues may be useful for pitch but not sharpness perception with CIs. Comparing our NH results to those of Li and Pastore (1995) revealed a possible impact of listening task on the measured sensitivity to spectral slope variations. In Li and Pastore (1995), NH listeners listened to a standard stimulus followed by two test stimuli, one of which had the same spectral slope as the standard stimulus while the other did not. The task was to identify the test stimulus with a different spectral slope. NH performance in this spectral slope discrimination task (Li and Pastore 1995) was better than that in the present sharpness ranking task, which further required subjects to judge which stimulus had a shallower negative spectral slope. No previous data are available for direct comparison with the spectral slope DLs of CI users. However, the deficits in using spectral slope cues may be part of the reasons why CI users had less reliance on spectral envelope cues for instrument timbre perception than NH listeners (Kong et al. 2011).
The pitch and sharpness ranking results with congruent and incongruent F0 and spectral slope variations by the same multiple of individual DLs reflected the nature of interaction between the two perceptual dimensions. The better performance of pitch and sharpness ranking in the congruent than in the incongruent trials suggested that the non-target variations caused confusion for the perception of target variations. Because of the confusion, subjects may have sometimes responded to the non-target dimension. When it happened, the response would still be correct if the target and non-target variations were congruent, but would be incorrect if the variations were incongruent. This may explain the better performance in the congruent than in the incongruent trials. Also, there was a bidirectional and symmetric interaction between pitch and sharpness perception, because the F0 variations affected sharpness perception as much as the spectral slope variations affected pitch perception. The interaction between F0-based pitch perception and spectral slope-based timbre perception was similar to that between F0-based pitch perception and spectral centroid-based timbre perception (Allen and Oxenham 2014). Note that a sound with a shallower negative spectral slope also had a higher spectral centroid. As in Allen and Oxenham (2014), the overall similar pitch and sharpness ranking performance in this experiment showed that the F0 and spectral slope variations by the same multiple of individual DLs elicited equal perceptual salience. Equal perceptual salience of different cues is considered critical for their interaction (e.g., Allen and Oxenham 2014; Luo et al. 2012; McKay et al. 2000). If different cues are of different perceptual salience, subject responses may be dominated by the more salient cues (Luo et al. 2012).
An important finding of this experiment was that CI users had an overall similar interaction between pitch and sharpness perception as NH listeners. The interaction was slightly but not significantly reduced for CI users than for NH listeners when the F0 and spectral slope varied by 2–4 DLs. The poorer spectral resolution of CI users limited their sensitivity to the increased F0 and spectral slope variations. When the variations in F0 and spectral slope were equalized in terms of the multiple of DLs, the global spectral slope cues interacted with the spectral fine structure cues of F0 symmetrically in CI users. It is worth considering whether CI users and NH listeners had the same or different mechanisms behind the similar behavioral results. The confusion between higher F0 and higher spectral prominence in NH listeners may partially arise from the fact that the two cues often co-vary with each other in natural sounds (e.g., female speech has both higher F0s and higher formant frequencies than male speech). Post-lingually deafened CI users may have also learned this phenomenon from their previous acoustic hearing experience. Second, Silbert et al. (2009) found that for most NH subjects, the perceptual boundary on the F0 (or spectral centroid) dimension was affected by the value of spectral centroid (or F0). The post-sensory interaction between pitch and timbre perception during decision making may also take place in CI users as long as the sensory inputs for pitch and timbre variations are salient enough. Third, pitch and timbre perception may also interact with each other at the sensory level in NH listeners. For example, both the F0 and spectral centroid variations produce changes along the auditory tonotopic organization starting in the cochlea and activate largely overlapped regions in the auditory cortex (Allen et al. 2017). In CIs, the degraded peripheral coding of F0 and spectral slope may also cause sensory confusion. The HiRes, HiRes120, and FS4 strategies used by our CI users encode F0s not only by using temporal modulations and pulse bursts but also by adjusting the relative current levels on simultaneously or sequentially stimulated adjacent electrodes. On the other hand, spectral slopes are encoded by the whole profile of current levels on individual electrodes (e.g., less prominent high-frequency stimulation for steeper negative spectral slopes). The local changes to stimulation pattern across electrodes with different F0s and the global changes with different spectral slopes may interact with each other.
EXPERIMENT 2: MELODIC CONTOUR IDENTIFICATION OF CI USERS WITH CONGRUENT AND INCONGRUENT SPECTRAL SLOPE VARIATIONS
The interaction between pitch and sharpness perception observed in experiment 1 may also apply to speech and music perception. Experiment 2 tested the effect of spectral slope variations on the MCI performance related to music listening (Galvin et al. 2007). The F0 variations between successive notes in the melodic contours were commonly used musical intervals of 1, 3, and 5 semitones. The spectral slope varied between successive notes by the same multiple of individual DLs as the F0 congruently or incongruently. Experiment 2 also tested MCI with no spectral slope variations to directly compare with that with congruent and incongruent spectral slope variations. Only CI users were tested because a pilot study found ceiling effects in MCI of NH listeners.
Methods
Subjects
Eleven post-lingually deafened CI users (6 females and 5 males) in the age range of 55–75 years with a mean age of 67 years took part in experiment 2. Six of them also participated in experiment 1. Table 1 lists the subject demographic details. Again, none of the subjects had received musical training before the study.
Stimuli and Procedure
The harmonic complex tones used in experiment 2 (i.e., the notes of the melodic contours) were nearly identical to those in experiment 1, with the same upper frequency limit (4000 Hz), starting phase of each harmonic (0°), ramp duration (20 ms), sampling rate (22,050 Hz), and resolution (16 bits). However, the stimulus duration was increased to 500 ms and the F0, spectral slope, and RMS amplitude varied across tests and trials (see below). The apparatus was the same as in experiment 1, including the sound booth, the loudspeaker, and the single CI processor of each subject using the clinical settings.
The first step of experiment 2 was again to test basic pitch and sharpness ranking without non-target variations. The same procedures as in experiment 1 were used to find the F0 DLs for nominal F0s around 220, 440, and 880 Hz (roved by ± 1.58 semitones) with a fixed spectral slope of − 8 dB/octave and spectral slope DLs for a nominal spectral slope around − 8 dB/octave (roved by ± 1 dB/octave) with a fixed F0 of 440 Hz. The tested nominal F0s and spectral slope were those of the middle note in the melodic contours. Due to time constraints, spectral slope DLs were not tested with the F0 of 220 or 880 Hz. Although the spectral slopes may be sampled with different F0s and harmonics, F0 was expected to have a limited effect on spectral slope DLs (see the Results for a comparison of the spectral slope DLs with a F0 of 200 Hz in experiment 1 and those with a F0 of 440 Hz in experiment 2). The RMS amplitude of each stimulus was roved around 65 dB SPL by ± 10 dB (the same as in experiment 1). The F0 and spectral slope DLs were needed for creating the melodic contours with the F0 and spectral slope varying between successive notes by the same multiple of individual DLs.
Following Galvin et al. (2007), each melodic contour had a sequence of five notes with one of nine pitch variation patterns (i.e., rising, rising-flat, rising-falling, flat-rising, flat, flat-falling, falling-rising, falling-flat, and falling). The middle (i.e., the third) note of each contour had a F0 of 220 (A3), 440 (A4), and 880 Hz (A5) to test MCI in different frequency ranges. The F0 variations between successive notes were 1, 3, and 5 semitones to test MCI with different pitch intervals. Successive notes were separated by 100 ms. Each condition of the MCI test thus had a total of 81 melodic contours (3 middle F0s × 3 interval sizes × 9 contour patterns). The spectral slope of the middle note was always − 8 dB/octave. In the condition with no spectral slope variations, all the notes had the same spectral slope of − 8 dB/octave. In the condition with congruent spectral slope variations, the negative spectral slope was shallower with more high-frequency emphasis as the F0 increased, but was steeper with less high-frequency emphasis as the F0 decreased. This way, the sharpness and pitch both increased or both decreased from note to note. On the other hand, in the condition with incongruent spectral slope variations, the spectral slope and F0 (and thus the sharpness and pitch) varied in the opposite directions. Regardless of the change directions, the F0 and spectral slope variations between successive notes were equally salient with the same multiple of individual DLs (i.e., spectral slope variation = F0 variation / F0 DL × spectral slope DL). Figure 5 shows the F0 and spectral slope of each note for an example rising melodic contour in the conditions with no, congruent, and incongruent spectral slope variations. For F0s below the input frequency range of a CI processor, the notes may be inaudible with the CI if the negative spectral slope is too steep and the high-frequency harmonics receive too much attenuation. Sound detection of the notes below 220 Hz by 5, 6, and 10 semitones (i.e., the lowest notes in the melodic contours) showed that these notes must have spectral slopes shallower than − 12 dB/octave to remain audible to CI users. As such, during the test, if the spectral slope of any one of the lowest notes was calculated to be steeper than − 12 dB/octave for a CI user, the testing program automatically changed the spectral slope from whatever was calculated to a hard limit of − 12 dB/octave.
Fig. 5.
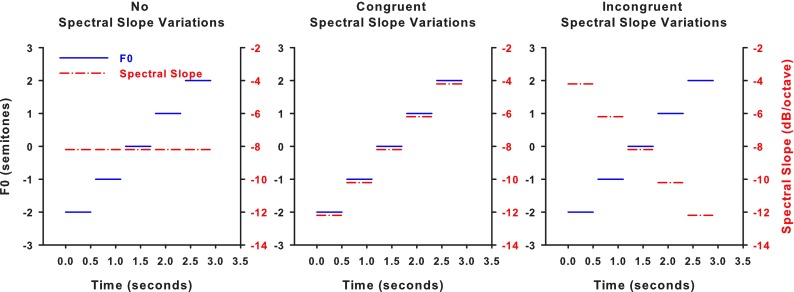
F0s in semitones (blue lines with reference to the left y axis) and spectral slopes in dB/octave (red dash-dotted lines with reference to the right y axis) of individual notes for an example rising melodic contour in the conditions with no (left panel), congruent (middle panel), and incongruent spectral slope variations (right panel)
The three spectral slope conditions were tested with the RMS amplitude of each note fixed at 65 dB SPL or roved around 65 dB SPL by ± 10 dB. As explained before, the 20-dB amplitude roving would limit the use of amplitude cues produced by spectral slope variations in MCI. Before formal testing, training with feedback was provided using 15 randomly selected melodic contours with no spectral slope variations and no amplitude roving. All of the participants could do the task in this practice. The six testing conditions (three spectral slope conditions × two amplitude conditions) were then tested in random order. The MCI test used a 9AFC task. In each condition, the melodic contours were tested in random order without replacement. Subjects were asked to select the pitch pattern of each melodic contour by clicking on one of the nine buttons with the corresponding contour picture. No feedback was given during formal testing. The overall percent correct scores of MCI, those of the different middle F0s, and those of the different interval sizes were recorded for the different testing conditions.
Statistical Analysis
A one-way repeated-measures (RM) ANOVA was used to analyze the F0 DLs of CI users across the three nominal F0s. To check the consistency of CI performance in pitch and sharpness ranking between experiments 1 and 2, the F0 and spectral slope DLs tested with similar nominal F0s and spectral slopes in the two experiments were compared using t tests for all CI users and using paired t tests for those who participated in both experiments. The overall MCI scores averaged across different middle F0s and interval sizes were analyzed using a two-way RM ANVOA to reveal the effects of amplitude roving and spectral slope variations together with their interaction. The detailed MCI scores of different middle F0s were analyzed using a three-way RM ANVOA to reveal the effect of middle F0 as well. Similarly, the detailed MCI scores of different interval sizes were analyzed using a three-way RM ANOVA to also test the effect of interval size. If a main effect or an interaction was significant, post-hoc Bonferroni t tests were used for pairwise comparisons. All the statistical tests were performed in SPSS 23.
Results
The left panel of Fig. 6 shows CI users’ F0 DLs as a function of the nominal F0. A one-way RM ANOVA revealed that the F0 DLs of CI users were not significantly different for the three nominal F0 s (F2,20 = 1.76, p = 0.20). The F0 DLs for the 220-Hz nominal F0 in experiment 2 were significantly worse than those for the 200-Hz nominal F0 in experiment 1 (t test: t19 = 2.28, p = 0.03). The insignificant effect of nominal F0 in experiment 2 suggests that the different F0 DLs in the two experiments were unlikely due to the small difference in nominal F0. For the six CI users who participated in both experiments, they also had significantly worse F0 DLs for the nominal F0 of 220 Hz in experiment 2 than for the nominal F0 of 200 Hz in experiment 1 (paired t test: t5 = 3.05, p = 0.03). It is unclear why these six CI users performed much worse in almost the same pitch ranking test of experiment 2, which took place about 6 months after experiment 1. Although worse than those in experiment 1, the F0 DLs in experiment 2 were still within the performance range of a large cohort of CI users (Won et al. 2010). The right panel of Fig. 6 shows the spectral slope DLs of CI users for the nominal spectral slope of − 8 dB/octave with a F0 of 440 Hz in experiment 2, which were also worse than those with a F0 of 200 Hz in experiment 1. However, the spectral slope DLs did not significantly differ with different F0s in the two experiments, either for all the CI users (t test: t19 = 2.02, p = 0.06) or just for the six CI users who took part in both experiments (paired t test: t5 = 1.45, p = 0.21).
Fig. 6.

CI users’ F0 difference limens (DLs) as a function of the nominal F0 (left panel) and spectral slope DLs for the nominal spectral slope of − 8 dB/octave (right panel). Circles indicate the mean while error bars represent the standard deviation across subjects
The top panel of Fig. 7 shows the overall MCI scores averaged across different interval sizes and middle F0s with or without amplitude roving in the three spectral slope conditions. A two-way RM ANOVA with the amplitude (0- and 20-dB amplitude roving) and spectral slope conditions (no, congruent, and incongruent spectral slope variations) as the two factors showed that both the spectral slope variations (F2,20 = 29.13, p < 0.001) and amplitude roving (F1,10 = 48.93, p < 0.001) significantly affected MCI performance, and the two factors significantly interacted with each other (F2,20 = 7.89, p = 0.003). Post-hoc Bonferroni t tests revealed that with no amplitude roving, CI users had significantly better MCI performance with congruent than with no (p = 0.01) and with no than with incongruent spectral slope variations (p < 0.001). With 20-dB amplitude roving, CI users’ MCI performance was significantly better with congruent than with incongruent (p = 0.001), but not with congruent than with no (p = 0.30) or with no than with incongruent spectral slope variations (p = 0.09). In any of the spectral slope conditions, CI users’ MCI performance significantly degraded with the addition of amplitude roving (p < 0.002).
Fig. 7.

Overall MCI scores averaged across interval sizes and middle F0s (top panel), those of different interval sizes (middle panel), and those of different middle F0s (bottom panel) with or without amplitude roving (open and filled vertical bars and symbols, respectively) in the conditions with no, congruent, and incongruent spectral slope variations. Vertical bars and symbols indicate the mean while error bars represent the standard deviation across subjects
The middle panel of Fig. 7 shows the detailed MCI scores of the three interval sizes in the different amplitude and spectral slope conditions. These results were analyzed using a three-way RM ANOVA with the amplitude (0- and 20-dB roving), spectral slope (no, congruent, and incongruent spectral slope variations), and interval size conditions (1, 3, and 5 semitones) as the three factors. The significant effects of spectral slope variations and amplitude roving, as well as their significant interaction, were the same as described above. In addition, the interval size also significantly affected CI users’ MCI performance (F2,20 = 36.29, p < 0.001). Post-hoc Bonferroni t tests showed that the MCI scores of 3- and 5-semitone intervals were similar to each other (p = 0.36) and both were significantly better than those of 1-semitone intervals (p < 0.001). The amplitude roving significantly interacted with the interval size (F2,20 = 8.76, p = 0.002). However, post-hoc Bonferroni t tests showed that either with or without amplitude roving, the MCI scores were similar for the 3- and 5-semitone intervals (p > 0.41) but significantly worse for the 1-semitone intervals (p < 0.001). Also, amplitude roving significantly degraded the MCI scores of all three interval sizes (p < 0.001). The interval size did not significantly interact with the spectral slope variations (F4,40 = 2.21, p = 0.09), suggesting that for the three interval sizes, the MCI scores similarly improved with congruent and degraded with incongruent spectral slope variations, as compared to those with a fixed spectral slope.
The bottom panel of Fig. 7 shows the detailed MCI scores of the three middle F0s in the different amplitude and spectral slope conditions. These results were analyzed using a three-way RM ANOVA with the amplitude (0- and 20-dB roving), spectral slope (no, congruent, and incongruent spectral slope variations), and middle F0 conditions (220, 440, and 880 Hz) as the three factors. The significant effects of spectral slope variations and amplitude roving, as well as their significant interaction, were again the same as seen in the overall MCI scores. Further, there was a significant effect of middle F0 on CI users’ MCI performance (F2,20 = 6.34, p = 0.01). Post-hoc Bonferroni t tests found that the MCI scores of 220- and 440-Hz middle F0s were similar to each other (p = 1.0) and both were significantly worse than those of the 880-Hz middle F0 (p < 0.001). The middle F0 did not significantly interact with the amplitude roving (F2,20 = 0.25, p = 0.78) or spectral slope variations (F4,40 = 2.11, p = 0.10). As such, the MCI scores of different middle F0s were similarly affected by the congruency of spectral slope variations.
Discussion
CI users had significantly better MCI performance when the interval size between successive notes increased from 1 to 3 or 5 semitones. This was likely the result of higher pitch sensitivity with larger F0 variations of CI users as shown in experiment 1. CI users’ MCI performance was also significantly better with the 880- than with the 220- and 440-Hz middle F0s, similar to the findings of Galvin et al. (2007). As argued by Galvin et al. (2007), the frequency-place mismatch due to the shallow insertion of electrode array may be reduced for higher F0s and the frequency selectivity may also be better for higher F0s due to the frequency allocation or electrode selectivity with CIs. However, as in Luo et al. (2014a), there was a lack of effect of the nominal F0 on F0 DLs, possibly attributable to the tradeoff between place and temporal pitch cues with CIs (that is, the stimulation place cues may enhance while the temporal periodicity cues may degrade for higher F0s). The different effects of F0 on the MCI scores and F0 DLs may be because the two tasks had different perceptual demands; each melodic contour had five notes and the F0 variations between notes often exceeded the F0 DLs while there were only two notes in each trial of pitch ranking and the adaptive F0 variations were mostly around the F0 DLs.
CI users’ MCI performance significantly degraded with amplitude roving. Luo et al. (2014b) also found that CI users’ MCI performance significantly improved when the amplitude varied from note to note in a congruent manner as the F0 (i.e., both increased or both decreased). Note that both this study and Luo et al. (2014b) did not equalize the salience of F0 and amplitude variations. Based on these results, loudness contours from amplitude variations may affect the perception of pitch contours from F0 variations either positively or negatively, depending on the congruency of F0 and amplitude variations. Contours in both dimensions may share common central representations and thus interact with each other (McDermott et al. 2008; Neuhoff et al. 1999). To better understand the effect of amplitude variations on MCI, future studies should include both congruent and incongruent amplitude variations that are similarly salient as the F0 variations.
The effect of spectral slope variations on MCI reflected the perceptual interaction between pitch and sharpness. While congruent and incongruent spectral slope variations were both correlated with the F0 variations, they did not similarly improve (i.e., generally facilitate) or similarly degrade (i.e., generally distract) the MCI performance as compared to the fixed spectral slope. Instead, a sharper (or duller) timbre may be confused with a higher (or lower) pitch to improve and degrade the MCI performance with congruent and incongruent spectral slope variations, respectively. The effect of spectral slope variations on MCI may also be explained by the interaction of contour patterns between pitch and timbre dimensions, similar to that between the pitch and loudness contours as mentioned above. Contours are commonly represented in the pitch, loudness, and timbre dimensions, likely at a central locus, as evidenced by previous results that contours in one dimension can be recognized in the other dimensions (McDermott et al. 2008). When the spectral slope co-varied with the F0, pitch contour identification may have improved when the sharpness and pitch contours shared the same pattern, but degraded when the two had the opposite patterns. Significantly better MCI scores with congruent than with no and in turn than with incongruent spectral slope variations were only found when there was no amplitude roving. With amplitude roving, the overall MCI performance was nearing floor, which was likely a major reason why the performance differences were obscured between the spectral slope conditions. The greater effect of spectral slope variations on MCI without amplitude roving may also indicate the use of local loudness variations at high-frequency harmonics produced by congruent and incongruent spectral slope variations, which had the same or opposite contour patterns as the pitch variations, respectively. Such loudness cues would be masked when the RMS amplitude of each note was roved.
GENERAL DISCUSSION AND SUMMARY
Using harmonic complex tones with both the F0 and spectral slope varying by the same multiple of individual DLs, we found a similar symmetric interaction between pitch and sharpness perception in both NH listeners and CI users, although pitch and sharpness cues were impaired with CIs. The interaction reflected a confusion between higher (or lower) pitch and sharper (or duller) timbre rather than a general facilitation or distraction effect (meaning that the target sensitivity would always improve or degrade regardless of the congruency between target and non-target variations). Due to the interaction, both NH listeners and CI users had higher pitch and sharpness ranking sensitivity with congruent than with incongruent F0 and spectral slope variations. Also, CI users had better MCI performance when the spectral slope variations between successive notes were congruent rather than incongruent with the F0 variations. Together, these results add to the existing literature that pitch and timbre are not independent perceptual dimensions in both NH and CI listeners. Besides, CI users’ significantly degraded MCI performance with the 20-dB amplitude roving also indicated a perceptual interaction between pitch and loudness.
The present results provide new insights into CI users’ pitch perception in real life. When different notes are played by the same instrument in different styles (e.g., hitting the piano keys softly or heavily) or when different notes are sung with different words (e.g., in vocal music; Crew et al. 2016), spectral slope may be one of the timbre cues that varies independently from the F0 to affect CI users’ MCI performance. Although not tested here, spectral centroid is another timbre cue that may also interfere with musical pitch perception in these situations (e.g., Allen and Oxenham 2014). Similarly, spectral envelope variations across phonemes and talkers in speech may affect CI performance in pitch-related listening tasks such as lexical tone and vocal emotion recognition, due to the interaction between pitch and timbre perception. The present results also have important implications for how to improve pitch perception for CI users. The significantly higher pitch ranking sensitivity and MCI scores with congruent than with incongruent spectral slope variations suggested that the spectral slope may be manipulated congruently with the F0 to enhance pitch perception in speech and music with CIs. When using congruent sharpness cues to compensate for the limited pitch cues, it is of course important to make sure that the introduced spectral slope variations are not too large to change the identity of a phoneme, talker, and instrument.
Acknowledgments
We are grateful to all the subjects for their participation in this study. Research was supported by Arizona State University.
Contributor Information
Xin Luo, Phone: (480) 965-9251, Email: xinluo@asu.edu.
Samara Soslowsky, Email: samarasoslowsky@gmail.com.
Kathryn R. Pulling, Email: Kathryn.Pulling@asu.edu
References
- Allen EJ, Oxenham AJ. Symmetric interactions and interference between pitch and timbre. J Acoust Soc Am. 2014;135:1371–1379. doi: 10.1121/1.4863269. [DOI] [PMC free article] [PubMed] [Google Scholar]
- Allen EJ, Burton PC, Olman CA, Oxenham AJ. Representations of pitch and timbre variation in human auditory cortex. J Neurosci. 2017;37:1284–1293. doi: 10.1523/JNEUROSCI.2336-16.2016. [DOI] [PMC free article] [PubMed] [Google Scholar]
- ANSI (1994) S1.1-1994, American Standard Acoustical Terminology (R2004). American National Standards Institute, New York
- Beal AL. The skill of recognizing musical structures. Mem Cogn. 1985;13:405–412. doi: 10.3758/BF03198453. [DOI] [PubMed] [Google Scholar]
- Crew JD, Galvin JJ, Fu Q. Perception of sung speech in bimodal cochlear implant users. Trends Hear. 2016;20:1–15. doi: 10.1177/2331216516669329. [DOI] [PMC free article] [PubMed] [Google Scholar]
- Dowling WJ, Fujitani DS. Contour, interval, and pitch recognition in memory for melodies. J Acoust Soc Am. 1971;49:524–531. doi: 10.1121/1.1912382. [DOI] [PubMed] [Google Scholar]
- Galvin JJ, Fu Q-J, Nogaki G. Melodic contour identification by cochlear implant listeners. Ear Hear. 2007;28:302–319. doi: 10.1097/01.aud.0000261689.35445.20. [DOI] [PMC free article] [PubMed] [Google Scholar]
- Garner WR. The processing of information and structure. Potomac: Erlbaum; 1974. [Google Scholar]
- Gfeller K, Turner C, Mehr M, Woodworth G, Fearn R, Knutson JF, Witt S, Stordahl J. Recognition of familiar melodies by adult cochlear implant recipients and normal-hearing adults. Cochlear Implants Int. 2002;3:29–53. doi: 10.1179/cim.2002.3.1.29. [DOI] [PubMed] [Google Scholar]
- Gfeller K, Witt S, Mehr M, Woodworth G, Knutson JF. Effects of frequency, instrumental family, and cochlear implant type on timbre recognition and appraisal. Ann Otol Rhinol Laryngol. 2002;111:349–356. doi: 10.1177/000348940211100412. [DOI] [PubMed] [Google Scholar]
- Gfeller K, Turner C, Oleson J, Zhang X, Gantz B, Froman R, Olszewski C. Accuracy of cochlear implant recipients on pitch perception, melody recognition, and speech reception in noise. Ear Hear. 2007;28:412–423. doi: 10.1097/AUD.0b013e3180479318. [DOI] [PubMed] [Google Scholar]
- Grey JM. Multidimensional perceptual scaling of musical timbres. J Acoust Soc Am. 1977;61:1270–1277. doi: 10.1121/1.381428. [DOI] [PubMed] [Google Scholar]
- Hacker MJ, Ratcliff R. A revised table of d’ for M-alternative forced choice. Percept Psychophys. 1979;26:168–170. doi: 10.3758/BF03208311. [DOI] [Google Scholar]
- Kang R, Nimmons GL, Drennan W, Longnion J, Ruffin C, Nie K, Won JH, Worman T, Yueh B, Rubinstein J. Development and validation of the University of Washington clinical assessment of music perception test. Ear Hear. 2009;30:411–418. doi: 10.1097/AUD.0b013e3181a61bc0. [DOI] [PMC free article] [PubMed] [Google Scholar]
- Klatt DH, Klatt LC. Analysis, synthesis, and perception of voice quality variations among female and male talkers. J Acoust Soc Am. 1990;87:820–857. doi: 10.1121/1.398894. [DOI] [PubMed] [Google Scholar]
- Kong Y, Mullangi A, Marozeau J, Epstein M. Temporal and spectral cues for musical timbre perception in electric hearing. J Speech Lang Hear Res. 2011;54:981–995. doi: 10.1044/1092-4388(2010/10-0196). [DOI] [PMC free article] [PubMed] [Google Scholar]
- Krumhansl CL, Iverson P. Perceptual interactions between musical pitch and timbre. J Exp Psychol Hum Percept Perform. 1992;18:739–751. doi: 10.1037/0096-1523.18.3.739. [DOI] [PubMed] [Google Scholar]
- Lee C-Y. Identifying isolated, multispeaker mandarin tones from brief acoustic input: a perceptual and acoustic study. J Acoust Soc Am. 2009;125:1125–1137. doi: 10.1121/1.3050322. [DOI] [PubMed] [Google Scholar]
- Li XF, Pastore RE. Perceptual constancy of a global spectral property: spectral slope discrimination. J Acoust Soc Am. 1995;98:1956–1968. doi: 10.1121/1.413315. [DOI] [PubMed] [Google Scholar]
- Luo X, Fu Q-J. Enhancing Chinese tone recognition by manipulating amplitude envelope: implications for cochlear implants. J Acoust Soc Am. 2004;116:3659–3667. doi: 10.1121/1.1783352. [DOI] [PubMed] [Google Scholar]
- Luo X, Padilla M, Landsberger DM. Pitch contour identification with combined place and temporal cues using cochlear implants. J Acoust Soc Am. 2012;131:1325–1336. doi: 10.1121/1.3672708. [DOI] [PMC free article] [PubMed] [Google Scholar]
- Luo X, Masterson ME, Wu C-C. Melodic interval perception by normal-hearing listeners and cochlear implant users. J Acoust Soc Am. 2014;136:1831–1844. doi: 10.1121/1.4894738. [DOI] [PMC free article] [PubMed] [Google Scholar]
- Luo X, Masterson ME, Wu C-C. Contour identification with pitch and loudness cues using cochlear implants. J Acoust Soc Am. 2014;135:EL8–E14. doi: 10.1121/1.4832915. [DOI] [PMC free article] [PubMed] [Google Scholar]
- Macherey O, Delpierre A. Perception of musical timbre by cochlear implant listeners: a multidimensional scaling study. Ear Hear. 2013;34:426–436. doi: 10.1097/AUD.0b013e31827535f8. [DOI] [PubMed] [Google Scholar]
- McAdams S, Winsberg S, Donnadieu S, De Soete G, Krimphoff J. Perceptual scaling of synthesized musical timbres: common dimensions, specificities, and latent subject classes. Psychol Res. 1995;58:177–192. doi: 10.1007/BF00419633. [DOI] [PubMed] [Google Scholar]
- McDermott JH, Lehr AJ, Oxenham AJ. Is relative pitch specific to pitch? Psychol Sci. 2008;19:1263–1271. doi: 10.1111/j.1467-9280.2008.02235.x. [DOI] [PMC free article] [PubMed] [Google Scholar]
- McKay CM, McDermott HJ, Carlyon RP. Place and temporal cues in pitch perception: are they truly independent? Acoust Res Lett Online. 2000;1:25–30. doi: 10.1121/1.1318742. [DOI] [Google Scholar]
- Melara RD, Marks LE. Interaction among auditory dimensions: timbre, pitch, and loudness. Percept Psychophys. 1990;48:169–178. doi: 10.3758/BF03207084. [DOI] [PubMed] [Google Scholar]
- Neuhoff JG, McBeath MK, Wanzie WC. Dynamic frequency change influences loudness perception: a central, analytic process. J Exp Psychol Hum Percept Perform. 1999;25:1050–1059. doi: 10.1037/0096-1523.25.4.1050. [DOI] [PubMed] [Google Scholar]
- Oxenham AJ. Pitch perception and auditory stream segregation: implications for hearing loss and cochlear implants. Trends Amplif. 2008;12:316–331. doi: 10.1177/1084713808325881. [DOI] [PMC free article] [PubMed] [Google Scholar]
- Pitt MA. Perception of pitch and timbre by musically trained and untrained listeners. J Exp Psychol Hum Percept Perform. 1994;20:976–986. doi: 10.1037/0096-1523.20.5.976. [DOI] [PubMed] [Google Scholar]
- Scherer KR. Vocal communication of emotion: a review of research paradigms. Speech Comm. 2003;40:227–256. doi: 10.1016/S0167-6393(02)00084-5. [DOI] [Google Scholar]
- Shannon RV, Zeng FG, Kamath V, Wygonski J, Ekelid M (1995) Speech recognition with primarily temporal cues. Science 80. 10.1126/science.270.5234.303 [DOI] [PubMed]
- Silbert NH, Townsend JT, Lentz JJ. Independence and separability in the perception of complex nonspeech sounds. Atten Percept Psychophysiol. 2009;71:1900–1915. doi: 10.3758/APP.71.8.1900. [DOI] [PubMed] [Google Scholar]
- Tsang CD, Trainor LJ. Spectral slope discrimination in infancy: sensitivity to socially important timbres. Infant Behav Dev. 2002;25:183–194. doi: 10.1016/S0163-6383(02)00120-0. [DOI] [Google Scholar]
- von Bismarck G. Timbre of steady sounds: a factorial investigation of its verbal attributes. Acustica. 1974;30:146–159. [Google Scholar]
- von Bismarck G. Sharpness as an attribute of the timbre of steady sounds. Acustica. 1974;30:159–172. [Google Scholar]
- Won JH, Drennan WR, Kang RS, Rubinstein JT. Psychoacoustic abilities associated with music perception in cochlear implant users. Ear Hear. 2010;31:796–805. doi: 10.1097/AUD.0b013e3181e8b7bd. [DOI] [PMC free article] [PubMed] [Google Scholar]
- Zeng FG. Temporal pitch in electric hearing. Hear Res. 2002;174:101–106. doi: 10.1016/S0378-5955(02)00644-5. [DOI] [PubMed] [Google Scholar]