Abstract
Tumor hypoxia plays a major role in radio- and chemotherapy resistance in solid tumors. Carbonic Anhydrase IX (CAIX) is an endogenous hypoxia-related protein, which is associated with poor patient outcome. The quantitative assessment of CAIX expression of tumors may steer cancer treatment by predicting therapy response or patient selection for antihypoxia or CAIX-targeted treatment. Recently, the single-photon emission computerized tomography (SPECT) tracer [111In]In-DTPA-girentuximab-F(ab′)2 was developed and validated for targeting CAIX. The aim of this study was to optimize quantitative microSPECT/CT of CAIX expression in vivo in head and neck tumor models. Athymic mice with subcutaneous SCCNij153 and SCCNij202 head and neck squamous cell carcinoma xenografts were injected with [111In]In-DTPA-girentuximab-F(ab′)2. First, the protein dose, timing, and image acquisition settings were optimized. Tracer uptake was determined by quantitative SPECT, ex vivo radioactivity counting, and by autoradiography of tumor sections. The same tumor sections were immunohistochemically stained for CAIX expression and hypoxia. Highest tumor-normal-tissue contrast was obtained at 24 h after injection of the tracer. A protein dose of 10 μg resulted in the highest tumor-to-muscle ratio at 24 h p.i. Ex vivo biodistribution studies showed a tumor uptake of 3.0 ± 0.6%ID/g and a tumor-to-muscle ratio of 8.7 ± 1.4 (SCCNij153). Quantitative analysis of the SPECT images enabled us to distinguish CAIX antigen blocked from nonblocked tumors, fractions positive for CAIX expression: 0.22 ± 0.02 versus 0.08 ± 0.01 (p < 0.01). Immunohistochemical, autoradiographic, and microSPECT/CT analyses showed a distinct intratumoral spatial correlation between localization of the radiotracer and CAIX expression. Here, we demonstrate that [111In]In-DTPA-girentuximab-F(ab′)2 specifically targets CAIX-expressing cells in head and neck cancer xenografts. SPECT imaging with indium-labeled girentuximab-F(ab′)2 allows quantitative assessment of the fraction of CAIX positive tissue in head and neck cancer xenografts. These results indicate that [111In]In-DTPA-girentuximab-F(ab′)2 is a promising tracer to image hypoxia-related CAIX expression.
Keywords: Head and neck cancer, CAIX imaging, hypoxia, girentuximab, preclinical
Introduction
Hypoxia is a common feature of solid tumors and has been associated with increased metastatic behavior, resistance to chemotherapy and radiotherapy, and a poor patient outcome.1,2 Carbonic anhydrase IX (CAIX) is a well-known hypoxia related biomarker. It is a transmembrane protein expressed on cells that have adapted to hypoxic conditions and its expression is strongly associated with treatment resistance.3 CAIX is also a potential target for cancer treatment.4,5 A quantitative method to image CAIX expression could have prognostic and predictive value and may steer treatment decisions in cancer patients.
Hypoxic tumor areas are found dispersed throughout the tumor. Below an oxygen pressure of 20 mmHg, hypoxia inducible factor (HIF-1α) is stabilized and catalyzes multiple hypoxia-adaptation pathways including upregulation of CAIX expression.6,7 The primary function of CAIX is to maintain a stable intracellular pH by excreting hydrogen ions. Recent studies also suggested a function in the efflux of lactate8 and in tumor migration and invasion.9
Many solid tumors express CAIX in hypoxic regions, including head and neck squamous cell carcinomas (HNSCC). A meta-analyses by Van Kuijk et al. showed that CAIX expression was associated with poor outcome in patients with various tumor types.10 The expression of CAIX in normal tissue is very low, only the gallbladder and gut express CAIX.5 CAIX expression occurs heterogeneously throughout the tumor and expression patterns change over time.11 Detection of CAIX on biopsies does not provide the clinician with an overview of the total CAIX expression, nor will it be adequate for tracking CAIX over time.
CAIX imaging can be used as a prognostic tool since CAIX has been validated as a prognostic biomarker in solid tumors, but even more interesting is the potential application in a predictive setting. Imaging of CAIX could be used for patient selection for multiple treatments. For example, radiotherapy tumor dose could be escalated in hypoxic tumor areas to overcome hypoxia mediated radioresistance.12 Furthermore, imaging could allow patient selection for antihypoxic or CAIX-targeting drugs.13
The chimeric antibody girentuximab (cG250) targets the extracellular domain of humane CAIX, and when labeled with a fluorophore or radionuclide, it can be used for molecular imaging of CAIX-positive tumors.14−16 Because girentuximab is an intact IgG, blood clearance is relatively slow. This slow clearance hampers imaging at early time points after injection. To address this issue, we developed a tracer based on girentuximab-F(ab′)2 fragments.17,18
The aim of this study was to develop a noninvasive imaging technique to measure CAIX-expression in two different HNSCC xenografts using the CAIX-targeting compound [111In]In-DTPA-girentuximab-F(ab′)2 and to correlate the intratumoral distribution of this radiotracer to the expression of CAIX and hypoxic tumor areas visualized using Pimonidazole.
Experimental Section
Conjugation, Radiolabeling, and Quality Control
Fifteen milligrams of girentuximab (5 mg/mL chimeric anti-CAIX antibody G250, Wilex AG) was enzymatically digested with 250 μg of pepsine (Boehringer, Ingelheim, Germany), in 0.1 M citrate buffer, pH 3.8. After 4 h, digestion was stopped by adjusting the pH to 7.4 with 0.7 mL of 1 M Tris, pH 10. The reaction mixture was purified on a HiTrap protein A column (Sigma-Aldrich Chemie NV, Zwijndrecht, The Netherlands) in binding buffer, 3 M NaCl/1.5 M glycine buffer, pH 8.9, to remove the nondigested IgG. Next, the reaction mixture was concentrated and pepsine was removed by ultrafiltration in a Centriprep concentrator (MW cutoff 50 kDa). Sodium dodecyl sulfate polyacrylamide gel electrophoresis (SDS-PAGE) analysis of the purified sample showed no apparent residual IgG or presence of Fab′ fragments.
Girentuximab and girentuximab F(ab′)2 fragments were conjugated in a molar ratio of 1:10 at pH 9.5 with isothiocyanatobenzyl-diethylenetriaminepentaacetic acid (ITC-DTPA, Macrocyclis, Houston, TX, USA) as described previously.19 DTPA-conjugated girentuximab and girentuximab-F(ab′)2 fragments were radiolabeled with 111InCl (Mallinckrodt, Petten, The Netherlands), and twice the volume of 0.5 M 2-(N-morpholino)ethanesulfonic acid (MES) buffer, pH 5.4, was added. The reaction mix was incubated at room temperature for 30 min. Labeling efficiency was between 45 and 84%, with a molar activity of 0.15 MBq/μmol. Tracers were purified on a PD10 column that was eluted with PBS 0.5% bovine serum albumin (BSA). Radiochemical purity was determined by instant thin-layer chromatography (ITLC) on silica gel chromatography strips (Biodex, Shirley, NY, USA), using 0.1 M citrate buffer pH 6.0 as the mobile phase. In case of labeling efficiency < 95%, the labeled product was purified on a PD-10 column (GE, Woerden, The Netherlands) that was eluted with 25 mM phosphate-buffered saline containing 0.5% bovine serum albumin (PBS-BSA). Radiochemical purity of 111In-labeled girentuximab-F(ab′)2 exceeded 95% in all experiments.
Tumor Models
The Radboud University Medical Center maintains several patient-derived HNSCC xenograft models, including SCCNij153 and SCCNij202. These two tumor models are previously characterized and differ in tumor biology,18,20,21 but both showed consequent high levels of CAIX expression in previous experiments.16,20 Phenotype and morphology of the tumor are regularly assessed by HE and IHC staining (Pimonidazole, CD31 and Ki67). Six- to 8-week-old athymic BALB/c nu/nu mice were implanted subcutaneously with small tumor pieces (2 mm3) subcutaneously on the right hind leg (Janvier Laboratories, Le Genest-Saint-Ile, France). Both sexes were used with regard to translatability and for ethical reasons. At the start of the experiment, mean diameter of tumors was 8 mm (range, 6–9 mm, 4–5 weeks after inoculation). Animals were housed in filter-topped cages in a specific pathogen-free unit in accordance with institutional guidelines. Group allocation was randomized and stratified by tumor size. The Nijmegen Medical Center animal ethics committee (RUDEC) and the Dutch animal ethics committee (CCD) approved the project (2016–053). All procedures were performed according to the Institute of Laboratory Animal Research guidelines.
Dose-Escalation and Pharmacokinetics of 111In-girentuximab-F(ab′)2
The optimal dose of girentuximab-F(ab′)2 to visualize CAIX expression was determined in a dose–escalation study. Five groups of five mice with subcutaneous SCCNij153 tumors were injected intravenously with [111In]In-DTPA-girentuximab-F(ab′)2 at increasing protein doses of 1, 3, 10, 30, and 100 μg of girentuximab-F(ab′)2 (0.8–2.5 MBq). To demonstrate the specificity for CAIX, a separate group was preinjected with a blocking dose of 300 μg unlabeled girentuximab IgG to block all CAIX in vivo and subsequently (72 h later) injected with 10 μg of 111In-girentuximab-F(ab′)2. Mice were euthanized by cervical dislocation 24 h after injection of the radiotracer.
To determine the optimal time-point for CAIX imaging, the biodistribution of 111In-girentuximab-F(ab′)2 (10 μg, 0.8–1.2 MBq) was evaluated at 4, 24, and 48 h after injection (five mice per group). To demonstrate the specificity for CAIX, a separate group (n = 3) received a blocking dose of unlabeled girentuximab as described previously. Two additional mice were administered 111In-girentuximab-F(ab′)2 (10 μg, 11–13.7 MBq) and underwent microsingle-photon emission computerized tomography (SPECT)/CT imaging (U SPECT-II; MILabs) at all three time points. Mice were scanned in prone position under general anesthesia (isoflurane/air) using the 1.0 mm-diameter multipinhole mouse collimator tube. SPECT scans were acquired for 45 min, 126 bed positions, followed by 180 s CT scans (615 μA, 65 kV). Mice were injected with the nitro imidazole derivative Pimonidazole 80 mg/kg i.p. (J. A. Raleigh Department of Radiation Oncology, University of North Carolina, USA) to mark hypoxia 50 min prior to cervical dislocation. Scans were reconstructed with MILabs reconstruction software, using an ordered-expectation maximization algorithm with a voxel size of 0,375 mm2, three iterations, and 1.0 mm Gaussian filter. From all mice, tumors and tissue samples (blood, skin, muscle, small intestine, lung, heart, kidney, and liver) were harvested and weighed. Subsequently, radioactivity uptake was determined in a γ-counter (2480 Wizard 3″, LKB/Wallace, PerkinElmer, Boston, MA). Radioactivity concentrations in the tissues were calculated as percentage of the injected dose per gram of tissue (%ID/g). To correct for radioactive decay, injection standards were counted simultaneously.
Quantitative microSPECT Imaging of HNSCC
Ten mice with SCCNij202 tumors were injected with 10 μg of 111In-girentuximab-F(ab′)2 (12.9 ± 1.7 MBq). Half of them were used to assess the specificity for CAIX and received 300 μg of unlabeled girentuximab 72 h prior to the tracer injection. At 24 h post-injection, two microSPECT/CT scans were acquired as described previously.18 In addition, an extra SPECT scan of the tumor region was acquired for 45 min with 12 scan positions. All mice were injected with Pimonidazole as described previously.18
Uptake of the radiolabel in the tissues was determined ex vivo in a γ-counter. Scans were reconstructed as described in the previous paragraph. Volumes of interest (VOIs) were drawn around the tumor and the contralateral hind leg muscle (background region) to quantitatively determine the uptake (%ID/mL). The measured counts were converted to %ID/mL using standards with known radioactivity concentrations scanned with the same SPECT settings.
CAIX positive tumor fractions were determined using a fixed voxel intensity threshold. Areas with voxel intensity above threshold were considered CAIX-positive. Thresholds were corrected for variances in injected dose and decay per individual mouse. Analyses were performed using the Inveon Research Workplace software (version 3.0; Siemens Preclinical Solutions).
Immunohistochemistry and Autoradiography
Half of the tumor was used for biodistribution measurements. The other half of each tumor was snap frozen directly after excision and was cut into sections of 5 μm. These were mounted on poly-l-lysine coated slides and stored at −80 °C. The sections were fixed with acetone for 10 min at 4 °C. The intratumoral distribution of the radiolabeled antibody fragment was determined by autoradiography. Tumor sections were exposed to a Fujifilm BAS cassette 2025 overnight (Fuji Photo Film). Phospholuminescence plates were scanned using a Fuji BAS-1800 II bioimaging analyzer at a pixel size of 25 × 25 μm. Images were analyzed with Aida Image Analyzer software (Raytest). Immunohistochemical staining was performed on the same tumor sections for CAIX, Pimonidazole, and vessels as described previously.17
Immunohistochemistry Image Acquisition and Analysis
Tumor sections were analyzed using a digital image analysis system, as described previously.22 After whole-tissue sections had been scanned, gray scale images (pixel size, 2.59 × 2.59 μm) for vessels, CAIX, and Pimonidazole were obtained and subsequently converted into binary images. Thresholds for segmentation of the fluorescent signals were interactively set above the background staining for each individual marker. Binary images were used to calculate the CAIX-positive fraction and hypoxic faction relative to the total tumor. Areas of necrosis, determined using hematoxylin- and eosin-stained neighboring tumor sections, were excluded from analysis.
Statistics
Statistical analyses were performed using GraphPad Prism (version 6.0e). The unpaired t test and one-way ANOVA were used to compare groups and multiple groups. Linear regression analysis was used to assess correlations between different parameters, and a P value <0.05 was considered statistically significant. Results are expressed as mean value ± SD, unless stated otherwise.
Results
Antibody Protein Dose- and Time Optimization in SCCNij153
The dose-escalation study with 111In-girentuximab-F(ab′)2 showed highest tumor uptake in mice, which received doses up to 10 μg (1, 3, 10 μg; 3.0 ± 0.6, 3.7 ± 1.4, and 3.1 ± 0.6 %ID/g, respectively). When specific binding was blocked with an excess unlabeled girentuximab IgG to determine unspecific tracer uptake, tumor uptake decreased to 1.5 ± 0.1 %ID/g as shown in Figure 1 (p < 0.05).
Figure 1.
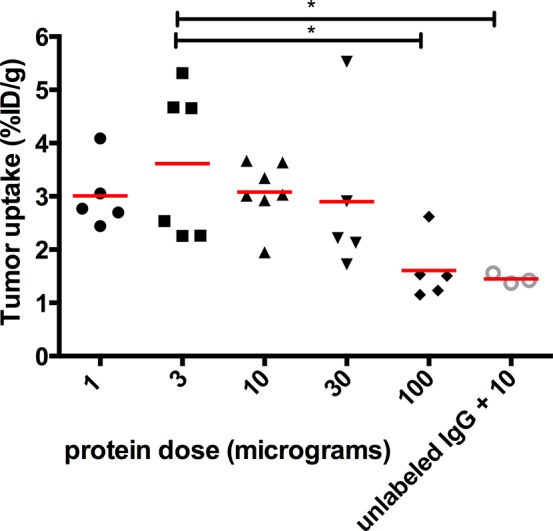
Dose-escalation of 111In-girentuximab-F(ab′)2. Uptake of 111In-girentuximab-F(ab′)2 in subcutaneous SCCNij153 tumors 24 h after injection. *p < 0.05.
Biodistribution of the tracer at 4, 24, and 48 h after injection showed significant increasing tumor-to-blood (t/b) ratios from 4 to 24 h, but no further increase at 48 h: 1.1 ± 0.4, 19 ± 15, and 24 ± 13 (p < 0.05). Tumor-to-muscle ratios (t/m) were more stable: 6.2 ± 2.2, 8.7 ± 1.9, and 7.6 ± 4.5. When specific binding was blocked with an excess unlabeled girentuximab IgG, t/b ratios dropped to 0.5 ± 0.1, 5.8 ± 1.3, and 8.0 ± 1.0; t/m ratios decreased to 2.8 ± 0.7, 2.9 ± 0.4, and 3.8 ± 1.8 (Table 1).
Table 1. Time Optimization Dataa.
| time point (h) | tumor tracer uptake (%ID/g) | tumor-to-muscle | tumor-to-blood | |
|---|---|---|---|---|
| nonblocked | 4 | 3.0 ± 1.5 | 6.2 ± 2.2 | 1.1 ± 0.4 |
| 24 | 3.0 ± 1.8 | 8.7 ± 1.9 | 19 ± 15 | |
| 48 | 1.7 ± 0.8 | 7.6 ± 4.5 | 24 ± 13 | |
| blocked | 4 | 1.5 ± 0.5 | 2.8 ± 0.7 | 0.5 ± 0.1 |
| 24 | 1.1 ± 0.3 | 2.9 ± 0.4 | 5.8 ± 1.3 | |
| 48 | 0.6 ± 0.1 | 3.8 ± 1.8 | 8.0 ± 1.0 |
Time optimization experiment of 111In-girentuximab-F(ab′)2 performed on mice baring SCCNij153 tumors. Specific binding was blocked by preinjecting an excess amount of unlabeled girentuximab IgG.
Detecting Intratumoral Heterogeneous Expression of CAIX in HNSCC Xenografts
Qualitative analysis of the microSPECT/CT images confirmed the results obtained from the ex vivo biodistribution studies in the SCCNij153 model. At 4 h post-injection, high background signal resulted in relatively low contrast between tumor and normal tissue, while images acquired at 24 and 48 h showed better tumor-to-background contrast (Figure 2). The absolute signal from tumor was higher at 24 h post-injection compared with 48 h post-injection. Next to tumor uptake, high tracer uptake in kidneys, liver, and spleen was observed at all time points (Figure 3)
Figure 2.
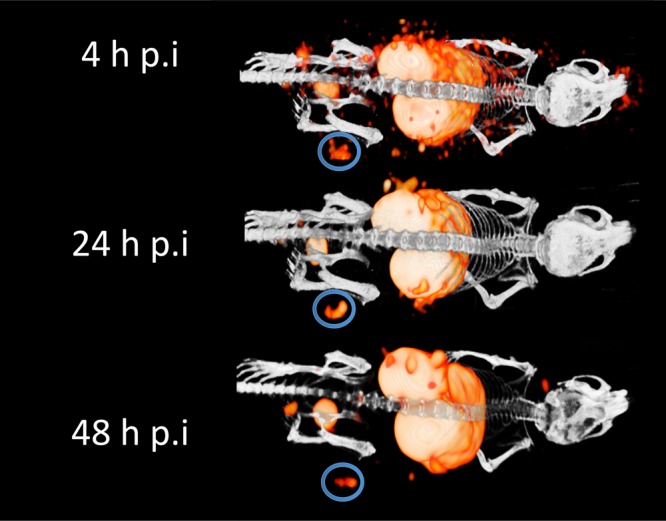
Serial MicroSPECT images of mice bearing a SCCNij153 xenograft were obtained 4, 24, and 48 h post-injection of 111In-girentuximab-F(ab′)2. The circles indicate the tumor.
Figure 3.
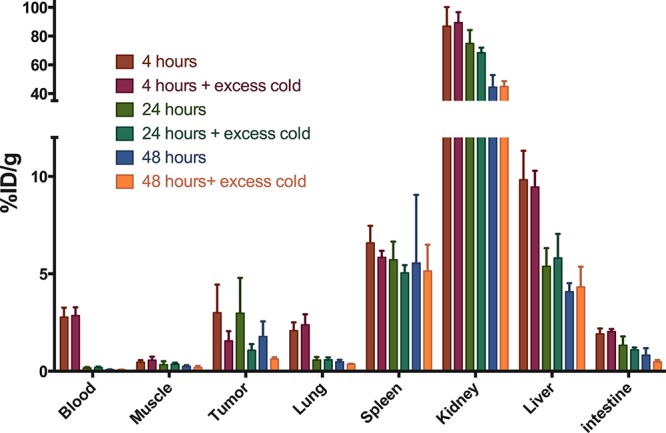
Time optimization biodistribution of 111In-girentuximab-F(ab′)2 in SSCNij153 tumors and selected normal tissues at 4, 24, and 48 h post-injection.
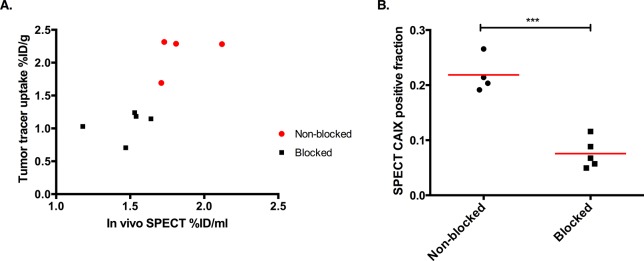
Quantitative microSPECT imaging in SCCNij202 showed tumor tracer uptake per volume (%ID/mL) derived from the whole body SPECT imaging was in line with the biodistribution results (Pearson correlation coefficient 0.78, Figure 4A). Tumor-to-muscle and tumor-to-liver ratios derived from quantitative scans were 3.2 ± 0.7 and 0.34 + 0.08. Next to tracer uptake per volume, we also determined the CAIX-positive fraction per tumor. CAIX positive fractions of tumors without blocking were significantly higher than tumors of mice that received an excess unlabeled antibody: 0.22 ± 0.02 versus 0.08 ± 0.01 (p < 0.01) (Figure 4B). These data demonstrate the specificity of 111In-girentuximab-F(ab′)2 for CAIX-positive tumor areas.
Figure 4.
SPECT quantification. (A) Scatterplot correlating tumor SPECT quantification with tumor tracer uptake in the SCCNij202 xenograft. (B) CAIX positive fraction determined by SPECT quantification. Both groups were injected with 10 μg of 111In-girentuximab-F(ab′)2, and the blocked group was preinjected with 300 μg of unlabeled girentumab IgG (p < 0.001).
Tracer Uptake Shows Spatial Correlation with CAIX Expression and Pimonidazole Uptake
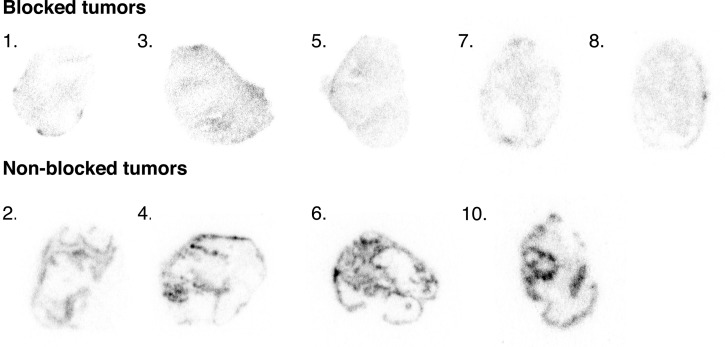
Nine xenograft sections were successfully stained for Pimonidazole and CAIX. The SCCNij202 xenografts showed mean CAIX-positive fractions of 0.25 ± 0.06 and mean hypoxic fractions of 0.44 ± 0.13. Autoradiography of the tumor sections showed a heterogeneous uptake pattern of 111In-girentuximab-F(ab′)2 in the nonblocked group (specific uptake), while uptake in the blocked group was significantly lower and showed a diffuse pattern (nonspecific uptake) (Figure 5).
Figure 5.
Autoradiography images acquired overnight. Top row shows tumors from blocked group (mice were preinjected with 300 μg of unlabeled girentuximab IgG); bottom row shows tumors from the nonblocked group.
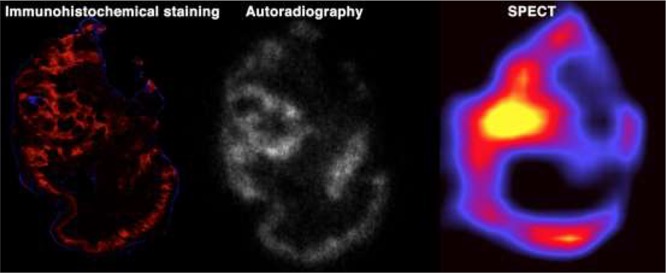
Intratumoral distribution pattern of 111In-girentuximab-F(ab′)2 was similar to the distribution patterns observed for CAIX expression as determined immunohistochemically. Figure 6 shows an example where in vivo microSPECT imaging of 111In-girentuximab-F(ab′)2 shows a similar distribution pattern as observed with autoradiography and immunohistochemistry for CAIX.
Figure 6.
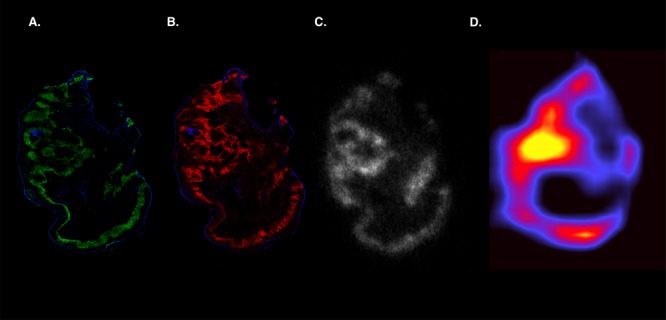
Visualization of tumor heterogeneity. Example SCCNij202 xenograft imaged after immunohistochemical staining (A,B; green = pimonidazol, red = CAIX, blue = vessels), autoradiography (C), and microSPECT (D).
Discussion
In this study, we determined the optimal conditions to visualize CAIX expression with 111In-girentuximab-F(ab′)2 in two different HNSCC xenografts models. The protein dose escalation experiment showed optimal tracer uptake at antibody doses ≤10 μg/mouse, which is comparable to intact girentuximab IgG.23 Biodistribution studies showed high tumor-to-blood ratios as early as 24 h. Also, biodistribution studies showed high tracer uptake in kidneys, liver, and spleen, which is nonspecific since girentuximab does not target murine CAIX.24 Our intended application is to assess the distribution of hypoxia as a radioresistance feature within the primary tumor. In this situation, we know the exact localization of the tumor, and the application of the new tracer is to study the heterogeneity of tracer uptake within the tumor. Therefore, nonspecific uptake in liver and kidneys is not an issue for this application.
Quantitative analysis of the images indicated that a threshold could be defined to discriminate CAIX-positive from CAIX negative areas. Furthermore, preinjection of an excess of unlabeled girentuximab demonstrated that the uptake of 111In-girentuximab-F(ab′)2 was specific for CAIX. Importantly, the heterogeneous uptake of 111In-girentuximab-F(ab′)2 within tumors showed a spatial correlation with the expression of CAIX and hypoxia measured by pimonidazole staining indicating the potential applicability for radiation dose painting studies.
In recent years, a series of CAIX-targeted imaging agents have been tested, which were elegantly reviewed in the article of Lau and colleagues recently.25 The excellent tumor uptake of intact radiolabeled girentuximab (chimeric G250) has not been surpassed, but due to their high tumor-to-background ratios, several other radiotracers (i.e., Tc-99-acetazolamide and Tc-99-ZCAIX:2) also show great promise (Table 2). Fair comparison of these tracers is challenging due to the differences in study design, different tumor models, mice, time points, doses, etc. In general, larger compounds require a later time point to obtain images with optimal tumor-to-normal tissue contrast. Particularly, small molecule and affibody-based tracers reveal high tumor-to-background contrast already within 4 h post tracer injection. A head to head comparison of these promising tracers is warranted to select the most optimal compound for noninvasive imaging of CAIX expression.
Table 2. Overview of Papers Published on Promising CAIX Targeting Tracers18,33−39.
| author | tracer type | compound | in vivo tumor | %ID/g | t/b | t/m | time p.i. |
|---|---|---|---|---|---|---|---|
| Brouwers et al. 2004 | antibody | Lu-177-DOTA-cG250 | SK-RC-52 (renalca.) | 74.5 | 12.4 | 124 | 7 days |
| Carlin et al. 2010 | antibody | In-111-DOTA-cg250 | HT-29 (colonca.) | 26.4 | 6.6 | 69 | 7 days |
| Ahlskog et al. 2009 | antibodyfragment | Lu-177-SIP(A3) | LS174T (colonca.) | 2.4 | 16.7 | 24 h | |
| Carlin et al. 2010 | antibody fragment | In-111-DOTA-cg250-F(ab′)2 | HT-29 (colonca.) | 9.3 | 4.6 | 8.9 | 24 h |
| Huizing et al. 2017 | antibody fragment | In-111-DTPA-cg250-F(ab′)2 | SCCNij153 (HNSCC) | 4.0 | 31 | 12 | 24 h |
| Yang and Minn et al. 2015 | small molecule | In-111-XYIMSR-01 | SK-RC-52 (renalca.) | 21 | 32 | 21 | 4 h |
| Garousi et al. 2016 | affibody | Tc-99-ZCAIX:2 | SK-RC-52 (renalca.) | 16 | 44 | 108 | 4 h |
| Krall et al. 2016 | small molecule | Tc-99-acetazolamide | SK-RC-52 (renalca.) | 22 | 70 | 3 h | |
| Lau et al. 2016 | small molecule | Ga-68-NOTGA-(AEBSA)3 | HT-29 (colonca.) | 2.3 | 2.7 | 4.2 | 1 h |
The importance of early imaging is mostly interesting for clinical applicability and the possibility to rapidly repeat scans to track change in live uptake induced by treatment. Because of the long half-life of CAIX,26 change in CAIX is slower than change in pO2. Therefore, when CAIX imaging is used for therapy monitoring early imaging is possibly less relevant compared to imaging with a nitroimidazole derivative based hypoxia radiotracer.
Although CAIX is considered to be an intrinsic hypoxia related marker in tumors, there are a few limitations with the use of CAIX imaging that should be taken into account. Besides hypoxia, there are different mechanisms that are also involved in upregulation of CAIX. For example, decreasing extracellular pH precludes CAIX expression.27 Furthermore, pathways such as PI3K28 or the unfolded protein response29 can also induce CAIX expression. Finally, not all hypoxic tumors express CAIX.30 Apart from these uncertainties in the mechanism of upregulation, CAIX expression in solid tumors clearly has a negative prognostic value and is associated with poor treatment outcome.10
Immunohistochemical staining of vessels, CAIX, and hypoxia showed similar patterns as seen before in these HNSCC xenografts by our group.21,30 Generally, CAIX was expressed at a shorter distance from the vessels compared to hypoxia (pimonidazole staining). Also, areas of mismatch were found, with a positive pimonidazole staining and no CAIX expression, or vice versa (Supporting Figure S1). This can be explained by multiple reasons, which are mentioned above. Another explanation can be found in changes in perfusion because it takes several hours for cells to adapt to hypoxia and express CAIX.26
Most CAIX-targeting radiotracers have been studied in renal cell carcinoma models (i.e., SK-RC-52) in which CAIX is expressed constitutively at a high level on the tumor cells. The CAIX antigen is expressed in the SK-RC-52 due to a mutation in the Von Hippel Lindau (VHL) gene, which leads to constitutive overexpression of HIF1α, which is not related to hypoxia. Although this homogeneous high expression allows determining the specificity of CAIX-targeting of these tracers, the CAIX expression levels in this model are much higher than the expression levels found in hypoxic tumors without the VHL mutation. Thus, these renal cell carcinoma models are relevant for targeting, but not to study CAIX in hypoxic tumor areas. Therefore, we selected HNSCC xenograft models to characterize 111In-girentuximab-F(ab′)2, and because in patients with solid tumors, such as HNSCC, hypoxia and CAIX expression are highly correlated with treatment resistance.
Our high-resolution SPECT images of two different HNSCC xenografts, SCCNij202 and SCCNij153, showed heterogeneous tumor uptake. Autoradiographic and immunohistochemical analysis of the same tumor sections showed that uptake correlated with CAIX expression. Also, positive areas were mainly located around necrotic areas. Our results demonstrate that it is feasible to image and quantify the fraction of hypoxic areas in HNSCC tumors. Although immunohistochemistry provides information on a micrometer scale, it generally does not allow measurement of whole tumor lesions and potentially also its metastases. Thus, noninvasive imaging provides a better overview of the total hypoxic fraction of a certain tumor and allows sequential imaging over time of the same lesion.
In the clinical setting, this overview is important since it provides important information on the tumor biology. For example, accurate CAIX imaging could enable intensity modulated radiotherapy “dose painting” with specific boosting of CAIX positive, radioresistant tumor regions.31
Girentuximab-F(ab′)2 has been successfully labeled with zirconium-89, which has a similar half-life as indium; therefore, PET imaging with this tracer is also feasible.17 Previously, we showed that In-111-labeled and Zr-89-labeled girentuximab-F(ab′)2 have a similar biodistribution.18 Preclinically, In-111 is the preferred isotope with (ultra high resolution) SPECT scanning, but in clinical studies, Zr-89 is preferable because of the higher resolution of PET in clinical applications. We think the selection and optimization of an optimal radiotracer is crucial.
Even with promising results in rodent studies, translation and implementation of CAIX imaging to the clinic will be a challenge. Girentuximab IgG has been tested in several clinical studies and showed high tumor to background ratios, being among the highest reported in studies of solid tumors.32 Therefore, we expect it to be an excellent tracer to image CAIX in head and neck tumors. However, future clinical studies have to demonstrate that this is indeed the case.
The first step for the clinical development of this tracer could be a feasibility study (phase I) in patients with head and neck cancer. In later studies, the correlation between the CAIX PET signal and radiation sensitivity could be investigated. The most straightforward clinical application of CAIX imaging is in the function of treatment prediction. As a stable hypoxia-related marker, CAIX potentially is a predictive marker for hypoxia targeting or modulating treatment. At the moment, several promising CAIX targeting and hypoxia modulating treatments are studied in clinical trials (NCT03450018, NCT02020226). If these studies prove to be successful, accurate pretreatment discrimination between CAIX positive and negative tumors could help patient selection and thus improve clinical outcome for patients with solid tumors, such as head and neck cancer.
Conclusion
Here, we demonstrate the feasibility to quantify the CAIX-positive fraction in two different HNSCC xenograft models, using SPECT and 111In-girentuximab-F(ab′)2. These results show that 111In-girentuximab-F(ab′)2 is a promising tracer to image hypoxia-related CAIX expression and may be used in the future to identify patients with therapy resistant tumors to individualize cancer treatment.
Acknowledgments
We thank Jasper Lok for his technical assistance.
Supporting Information Available
The Supporting Information is available free of charge on the ACS Publications website at DOI: 10.1021/acs.molpharmaceut.8b00950.
Arrows indicate a vessel, which is surrounded by an area of mismatch (green = pimonidazol, red = CAIX, blue = vessels) (PDF)
The authors declare no competing financial interest.
Supplementary Material
References
- Hockel M.; Vaupel P. Tumor hypoxia: definitions and current clinical, biologic, and molecular aspects. Journal of the National Cancer Institute 2001, 93 (4), 266–76. 10.1093/jnci/93.4.266. [DOI] [PubMed] [Google Scholar]
- Bussink J.; Kaanders J. H.; van der Kogel A. J. Tumor hypoxia at the micro-regional level: clinical relevance and predictive value of exogenous and endogenous hypoxic cell markers. Radiother. Oncol. 2003, 67 (1), 3–15. 10.1016/S0167-8140(03)00011-2. [DOI] [PubMed] [Google Scholar]
- Koukourakis M. I.; Bentzen S. M.; Giatromanolaki A.; Wilson G. D.; Daley F. M.; Saunders M. I.; Dische S.; Sivridis E.; Harris A. L. Endogenous markers of two separate hypoxia response pathways (hypoxia inducible factor 2 alpha and carbonic anhydrase 9) are associated with radiotherapy failure in head and neck cancer patients recruited in the CHART randomized trial. J. Clin. Oncol. 2006, 24 (5), 727–35. 10.1200/JCO.2005.02.7474. [DOI] [PubMed] [Google Scholar]
- Denko N. C. Hypoxia, HIF1 and glucose metabolism in the solid tumour. Nat. Rev. Cancer 2008, 8 (9), 705–13. 10.1038/nrc2468. [DOI] [PubMed] [Google Scholar]
- Pastorekova S.; Parkkila S.; Zavada J. Tumor-associated carbonic anhydrases and their clinical significance. Adv. Clin. Chem. 2006, 42, 167–216. 10.1016/S0065-2423(06)42005-9. [DOI] [PubMed] [Google Scholar]
- Wykoff C. C.; Beasley N. J.; Watson P. H.; Turner K. J.; Pastorek J.; Sibtain A.; Wilson G. D.; Turley H.; Talks K. L.; Maxwell P. H.; Pugh C. W.; Ratcliffe P. J.; Harris A. L. Hypoxia-inducible expression of tumor-associated carbonic anhydrases. Cancer Res. 2000, 60 (24), 7075–83. [PubMed] [Google Scholar]
- Meijer T. W.; Kaanders J. H.; Span P. N.; Bussink J. Targeting hypoxia, HIF-1, and tumor glucose metabolism to improve radiotherapy efficacy. Clin. Cancer Res. 2012, 18 (20), 5585–94. 10.1158/1078-0432.CCR-12-0858. [DOI] [PubMed] [Google Scholar]
- Jamali S.; Klier M.; Ames S.; Barros L. F.; McKenna R.; Deitmer J. W.; Becker H. M. Hypoxia-induced carbonic anhydrase IX facilitates lactate flux in human breast cancer cells by non-catalytic function. Sci. Rep. 2015, 5, 13605. 10.1038/srep13605. [DOI] [PMC free article] [PubMed] [Google Scholar]
- Swayampakula M.; McDonald P. C.; Vallejo M.; Coyaud E.; Chafe S. C.; Westerback A.; Venkateswaran G.; Shankar J.; Gao G.; Laurent E. M. N.; Lou Y.; Bennewith K. L.; Supuran C. T.; Nabi I. R.; Raught B.; Dedhar S. The interactome of metabolic enzyme carbonic anhydrase IX reveals novel roles in tumor cell migration and invadopodia/MMP14-mediated invasion. Oncogene 2017, 36 (45), 6244–6261. 10.1038/onc.2017.219. [DOI] [PMC free article] [PubMed] [Google Scholar]
- van Kuijk S. J.; Yaromina A.; Houben R.; Niemans R.; Lambin P.; Dubois L. J. Prognostic Significance of Carbonic Anhydrase IX Expression in Cancer Patients: A Meta-Analysis. Front. Oncol. 2016, 6, 69. 10.3389/fonc.2016.00069. [DOI] [PMC free article] [PubMed] [Google Scholar]
- Coleman C. N. Hypoxia in tumors: a paradigm for the approach to biochemical and physiologic heterogeneity. Journal of the National Cancer Institute 1988, 80 (5), 310–7. 10.1093/jnci/80.5.310. [DOI] [PubMed] [Google Scholar]
- Bussink J.; van Herpen C. M.; Kaanders J. H.; Oyen W. J. PET-CT for response assessment and treatment adaptation in head and neck cancer. Lancet Oncol. 2010, 11 (7), 661–9. 10.1016/S1470-2045(09)70353-5. [DOI] [PubMed] [Google Scholar]
- Overgaard J. Hypoxic radiosensitization: adored and ignored. J. Clin. Oncol. 2007, 25 (26), 4066–74. 10.1200/JCO.2007.12.7878. [DOI] [PubMed] [Google Scholar]
- Divgi C. R.; O’Donoghue J. A.; Welt S.; O’Neel J.; Finn R.; Motzer R. J.; Jungbluth A.; Hoffman E.; Ritter G.; Larson S. M.; Old L. J. Phase I clinical trial with fractionated radioimmunotherapy using 131I-labeled chimeric G250 in metastatic renal cancer. J. Nucl. Med. 2004, 45 (8), 1412–21. [PubMed] [Google Scholar]
- Muselaers C. H.; Boerman O. C.; Oosterwijk E.; Langenhuijsen J. F.; Oyen W. J.; Mulders P. F. Indium-111-labeled girentuximab immunoSPECT as a diagnostic tool in clear cell renal cell carcinoma. Eur. Urol. 2013, 63 (6), 1101–6. 10.1016/j.eururo.2013.02.022. [DOI] [PubMed] [Google Scholar]
- Hekman M. C. H.; Rijpkema M.; Aarntzen E. H.; Mulder S. F.; Langenhuijsen J. F.; Oosterwijk E.; Boerman O. C.; Oyen W. J. G.; Mulders P. F. A. Positron Emission Tomography/Computed Tomography with (89)Zr-girentuximab Can Aid in Diagnostic Dilemmas of Clear Cell Renal Cell Carcinoma Suspicion. Eur. Urol. 2018, 74, 257. 10.1016/j.eururo.2018.04.026. [DOI] [PubMed] [Google Scholar]
- Hoeben B. A.; Kaanders J. H.; Franssen G. M.; Troost E. G.; Rijken P. F.; Oosterwijk E.; van Dongen G. A.; Oyen W. J.; Boerman O. C.; Bussink J. PET of hypoxia with 89Zr-labeled cG250-F(ab′)2 in head and neck tumors. J. Nucl. Med. 2010, 51 (7), 1076–83. 10.2967/jnumed.109.073189. [DOI] [PubMed] [Google Scholar]
- Huizing F. J.; Hoeben B. A. W.; Franssen G.; Lok J.; Heskamp S.; Oosterwijk E.; Boerman O. C.; Bussink J. Preclinical validation of (111)In-girentuximab-F(ab′)2 as a tracer to image hypoxia related marker CAIX expression in head and neck cancer xenografts. Radiother. Oncol. 2017, 124 (3), 521–525. 10.1016/j.radonc.2017.07.025. [DOI] [PubMed] [Google Scholar]
- Heskamp S.; Hobo W.; Molkenboer-Kuenen J. D. M.; Olive D.; Oyen W. J. G.; Dolstra H.; Boerman O. C. Noninvasive Imaging of Tumor PD-L1 Expression Using Radiolabeled Anti–PD-L1 Antibodies. Cancer Res. 2015, 75 (14), 2928–2936. 10.1158/0008-5472.CAN-14-3477. [DOI] [PubMed] [Google Scholar]
- Hoeben B. A.; Starmans M. H.; Leijenaar R. T.; Dubois L. J.; van der Kogel A. J.; Kaanders J. H.; Boutros P. C.; Lambin P.; Bussink J. Systematic analysis of 18F-FDG PET and metabolism, proliferation and hypoxia markers for classification of head and neck tumors. BMC Cancer 2014, 14, 130. 10.1186/1471-2407-14-130. [DOI] [PMC free article] [PubMed] [Google Scholar]
- Stegeman H.; Kaanders J. H.; van der Kogel A. J.; Iida M.; Wheeler D. L.; Span P. N.; Bussink J. Predictive value of hypoxia, proliferation and tyrosine kinase receptors for EGFR-inhibition and radiotherapy sensitivity in head and neck cancer models. Radiother. Oncol. 2013, 106, 383. 10.1016/j.radonc.2013.02.001. [DOI] [PMC free article] [PubMed] [Google Scholar]
- Rademakers S. E.; Rijken P. F.; Peeters W. J.; Nijkamp M. M.; Barber P. R.; van der Laak J.; van de Kogel A. J.; Bussink J.; Kaanders J. H. Parametric mapping of immunohistochemically stained tissue sections; a method to quantify the colocalization of tumor markers. Cellular oncology (Dordrecht) 2011, 34 (2), 119–29. 10.1007/s13402-010-0008-2. [DOI] [PMC free article] [PubMed] [Google Scholar]
- Muselaers C. H. J.; Oosterwijk E.; Bos D. L.; Oyen W. J. G.; Mulders P. F. A.; Boerman O. C. Optimizing Lutetium 177–Anti–Carbonic Anhydrase IX Radioimmunotherapy in an Intraperitoneal Clear Cell Renal Cell Carcinoma Xenograft Model. Mol. Imaging 2014, 13 (4), 7290.2014.00008. 10.2310/7290.2014.00008. [DOI] [PubMed] [Google Scholar]
- Zatovicova M.; Jelenska L.; Hulikova A.; Ditte P.; Ditte Z.; Csaderova L.; Svastova E.; Schmalix W.; Boettger V.; Bevan P.; Pastorek J.; Pastorekova S. Monoclonal antibody G250 targeting CA: Binding specificity, internalization and therapeutic effects in a non-renal cancer model. Int. J. Oncol. 2014, 45 (6), 2455–67. 10.3892/ijo.2014.2658. [DOI] [PubMed] [Google Scholar]
- Lau J.; Lin K. S.; Benard F. Past, Present, and Future: Development of Theranostic Agents Targeting Carbonic Anhydrase IX. Theranostics 2017, 7 (17), 4322–4339. 10.7150/thno.21848. [DOI] [PMC free article] [PubMed] [Google Scholar]
- Rafajova M.; Zatovicova M.; Kettmann R.; Pastorek J.; Pastorekova S. Induction by hypoxia combined with low glucose or low bicarbonate and high posttranslational stability upon reoxygenation contribute to carbonic anhydrase IX expression in cancer cells. Int. J. Oncol. 2004, 24 (4), 995–1004. 10.3892/ijo.24.4.995. [DOI] [PubMed] [Google Scholar]
- Andreucci E.; Peppicelli S.; Carta F.; Brisotto G.; Biscontin E.; Ruzzolini J.; Bianchini F.; Biagioni A.; Supuran C. T.; Calorini L. Carbonic anhydrase IX inhibition affects viability of cancer cells adapted to extracellular acidosis. J. Mol. Med. (Heidelberg, Ger.) 2017, 95 (12), 1341–1353. 10.1007/s00109-017-1590-9. [DOI] [PubMed] [Google Scholar]
- Kaluz S.; Kaluzova M.; Chrastina A.; Olive P. L.; Pastorekova S.; Pastorek J.; Lerman M. I.; Stanbridge E. J. Lowered oxygen tension induces expression of the hypoxia marker MN/carbonic anhydrase IX in the absence of hypoxia-inducible factor 1 alpha stabilization: a role for phosphatidylinositol 3′-kinase. Cancer Res. 2002, 62 (15), 4469–77. [PubMed] [Google Scholar]
- van den Beucken T.; Ramaekers C. H. M. A.; Rouschop K.; Koritzinsky M.; Wouters B. G. Deficient carbonic anhydrase 9 expression in UPR-impaired cells is associated with reduced survival in an acidic microenvironment. Radiother. Oncol. 2009, 92 (3), 437–442. 10.1016/j.radonc.2009.06.018. [DOI] [PubMed] [Google Scholar]
- Troost E. G.; Bussink J.; Kaanders J. H.; van E. J.; Peters J. P.; Rijken P. F.; Boerman O. C.; van der Kogel A. J. Comparison of different methods of CAIX quantification in relation to hypoxia in three human head and neck tumor lines. Radiother. Oncol. 2005, 76 (2), 194–199. 10.1016/j.radonc.2005.06.031. [DOI] [PubMed] [Google Scholar]
- Bentzen S. M.; Gregoire V. Molecular-imaging-based dose painting – a novel paradigm for radiation therapy prescription. Seminars in radiation oncology 2011, 21 (2), 101–110. 10.1016/j.semradonc.2010.10.001. [DOI] [PMC free article] [PubMed] [Google Scholar]
- Steffens M. G.; Boerman O. C.; Oosterwijk-Wakka J. C.; Oosterhof G. O.; Witjes J. A.; Koenders E. B.; Oyen W. J.; Buijs W. C.; Debruyne F. M.; Corstens F. H.; Oosterwijk E. Targeting of renal cell carcinoma with iodine-131-labeled chimeric monoclonal antibody G250. J. Clin. Oncol. 1997, 15 (4), 1529–37. 10.1200/JCO.1997.15.4.1529. [DOI] [PubMed] [Google Scholar]
- Brouwers A. H.; van Eerd J. E.; Frielink C.; Oosterwijk E.; Oyen W. J.; Corstens F. H.; Boerman O. C. Optimization of radioimmunotherapy of renal cell carcinoma: labeling of monoclonal antibody cG250 with 131I, 90Y, 177Lu, or 186Re. J. Nucl. Med. 2004, 45 (2), 327–337. [PubMed] [Google Scholar]
- Carlin S.; Khan N.; Ku T.; Longo V. A.; Larson S. M.; Smith-Jones P. M. Molecular Targeting of Carbonic Anhydrase IX in Mice with Hypoxic HT29 Colorectal Tumor Xenografts. PLoS One 2010, 5 (5), e10857 10.1371/journal.pone.0010857. [DOI] [PMC free article] [PubMed] [Google Scholar]
- Ahlskog J. K.; Schliemann C.; Marlind J.; Qureshi U.; Ammar A.; Pedley R. B.; Neri D. Human monoclonal antibodies targeting carbonic anhydrase IX for the molecular imaging of hypoxic regions in solid tumours. Br. J. Cancer 2009, 101 (4), 645–57. 10.1038/sj.bjc.6605200. [DOI] [PMC free article] [PubMed] [Google Scholar]
- Lau J.; Zhang Z.; Jenni S.; Kuo H. T.; Liu Z.; Vullo D.; Supuran C. T.; Lin K. S.; Benard F. PET Imaging of Carbonic Anhydrase IX Expression of HT-29 Tumor Xenograft Mice with (68)Ga-Labeled Benzenesulfonamides. Mol. Pharmaceutics 2016, 13 (3), 1137–46. 10.1021/acs.molpharmaceut.5b00934. [DOI] [PubMed] [Google Scholar]
- Krall N.; Pretto F.; Mattarella M.; Muller C.; Neri D. A 99mTc-Labeled Ligand of Carbonic Anhydrase IX Selectively Targets Renal Cell Carcinoma In Vivo. J. Nucl. Med. 2016, 57 (6), 943–9. 10.2967/jnumed.115.170514. [DOI] [PubMed] [Google Scholar]
- Yang X.; Minn I.; Rowe S. P.; Banerjee S. R.; Gorin M. A.; Brummet M.; Lee H. S.; Koo S. M.; Sysa-Shah P.; Mease R. C.; Nimmagadda S.; Allaf M. E.; Pomper M. G. Imaging of carbonic anhydrase IX with an 111In-labeled dual-motif inhibitor. Oncotarget 2015, 6 (32), 33733–42. 10.18632/oncotarget.5254. [DOI] [PMC free article] [PubMed] [Google Scholar]
- Garousi J.; Honarvar H.; Andersson K. G.; Mitran B.; Orlova A.; Buijs J.; Lofblom J.; Frejd F. Y.; Tolmachev V. Comparative Evaluation of Affibody Molecules for Radionuclide Imaging of in Vivo Expression of Carbonic Anhydrase IX. Mol. Pharmaceutics 2016, 13 (11), 3676–3687. 10.1021/acs.molpharmaceut.6b00502. [DOI] [PubMed] [Google Scholar]
Associated Data
This section collects any data citations, data availability statements, or supplementary materials included in this article.


