Abstract
Meiotic recombination differs between males and females; however, when and how these differences are established is unknown. Here we identify extensive sex differences at recombination initiation by mapping hotspots of meiotic DNA double-strand breaks in male and female mice. Contrary to past findings in humans, few hotspots are used uniquely in either sex. Instead, grossly different recombination landscapes result from up to 15-fold differences in hotspot usage between males and females. Indeed, most recombination occurs at sex-biased hotspots. Sex-biased hotspots appear to be partly determined by chromosome structure, and DNA methylation, absent in females at the onset of meiosis, plays a substantial role. Sex differences are also evident later in meiosis as the repair frequency of distal meiotic breaks as crossovers diverges in males and females. Suppression of distal crossovers may help to minimize age-related aneuploidy that arises due to cohesion loss during dictyate arrest in females.
Genetic recombination links homologous chromosomes and facilitates their orderly segregation at the first meiotic division. Recombination is initiated by programmed DNA double-strand breaks (DSBs) that are subsequently repaired as either crossovers (COs) or non-crossovers (NCOs). Recombination frequency and patterning can differ between males and females of the same species: the female CO rate is higher in humans and mice while in most studied mammals, COs are highly concentrated at sub-telomeric regions in males, but not in females1. This pattern is not universal, however, and in some species, such as pigs, subtelomeric crossovers are elevated in females2. Sex differences in recombination have been studied by comparing the genetic end products of recombination, primarily COs, between the sexes. However, sex-specific variation at the initiation of meiotic recombination has not been studied. We therefore generated quantitative, high-resolution, genome-wide maps of meiotic DSBs in both male and female mice to examine when and where sex biases in recombination are established, and to elucidate the mechanism(s) that give rise to these biases.
Sex-specific maps of meiotic DSBs
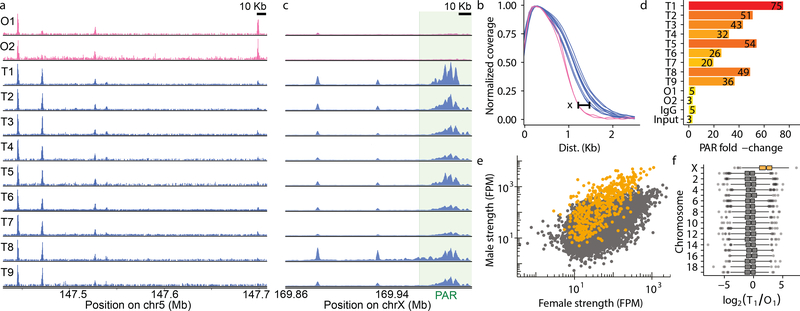
To map meiotic DSBs in female meiosis we exploited a method we previously developed3 to map DSB hotspots in mouse4–6 and human7 males. This variant of ChIP-Seq (single-stranded DNA sequencing, SSDS) detects single-stranded DNA (ssDNA) bound to DMC1 protein, an early intermediate in the DSB repair process7,8. In female mice, meiotic DSBs form in the fetal ovary. Each ovary contains <10,000 meiocytes at the required stage9, ~100 times fewer such cells than adult testis; thus, mapping DSBs from a single ovary is not possible. Instead, we mapped DSBs from one pool of 230 fetal ovaries and one pool of 90. From the 230-ovary pool, we generated a DSB map of similar quality to that of nine independent DSB maps generated from male individuals (Fig 1a; Extended Data Fig 1, 2a; Signal Percentage of Tags (SPoT) Sample O1 = 33%; SPoT for testis maps = 22–47%). The DSB map from the 90-ovary pool (Sample O2) was of lower quality (SPoT = 6%; Extended Data Fig 1b) but shared most hotspots (91%) with the better ovary DSB map (Extended Data Fig 2).
Fig 1.
Detectable meiotic DSB hotspots in females. a, Ovary(pink) and testis(blue) DSB maps. b, SSDS coverage (3’ distance to center) at hotspots (HS) is narrower in females (maximum difference (X) is ~400 bp). c,d, PAR SSDS signal (green) is enriched in males, but not females. c, Coverage normalized by total chrX SSDS. d, Fold-change = PAR SSDS / (mean SSDS of chrX 50 Kb intervals). The PAR SSDS signal is elevated (3–5×) in controls (Input & IgG) because of unassembled repetitive DNA. e,f, Hotspots on chrX (orange) appear stronger in males (grey = autosomal). FPM = SSDS fragments per million.
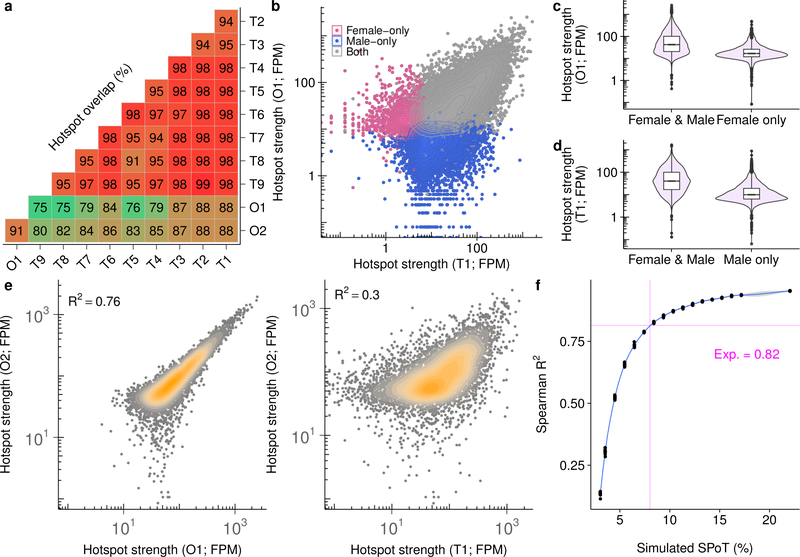
Most DSB hotspots are found in both sexes (Extended Data Fig 2a); 88% of hotspots from the better ovary DSB map are found in males and this increases to 97% of hotspots common to both ovary maps. Hotspots unique to either sex are weak (Extended Data Fig 2b-d) and contribute <2% of the SSDS signal. Given that strength estimates at weak hotspots are noisy and that ChIP-Seq provides relative rather than absolute estimates of hotspot use, it is likely that these hotspots are also used in the other sex, but with a frequency below our detection threshold. Sex-specific hotspots have been described in humans10; however, this was likely an incorrect conclusion from an under-powered study. For example, if we just examine the strongest 5,000 (of >13,000) hotspots in each sex, we would erroneously conclude that 30% of hotspots are sex-specific. In contrast, we find few, if any, hotspots that are used exclusively in either sex, in agreement with more recent data from humans11. One intriguing difference between the sexes is that the DMC1-SSDS signal at hotspots appears narrower in females than in males (by ~400 bp at the widest point; Fig 1b, Extended Data Fig 3). The narrower SSDS signal in females may be explained by shorter DSB end resection, by DMC1 loading over a shorter distance, or by differences in repair dynamics between the sexes. These findings and other evidence12–14 imply that meiotic DSB processing differs between the sexes.
There are striking differences in meiotic DSB repair on the sex chromosomes in males and females. The sex chromosomes share ~700 kb of homology (pseudoautosomal region, PAR)15, and a meiotic CO at the PAR is required in males, the heterogametic sex. Females have two copies of chrX, so crossover formation in the PAR is not essential. Relative to controls, PAR DSBs were enriched in all nine males but in neither female sample (Fig 1c,d). In males, DSBs outside the PAR either remain unrepaired16 or are continually formed17 after autosomal DSBs have been repaired. This elevates the SSDS signal such that chrX hotspots appear stronger in males than in females (Fig 1e,f). Because of these systematic differences, the sex chromosomes are excluded from subsequent analyses unless explicitly mentioned.
Sex differences at recombination initiation
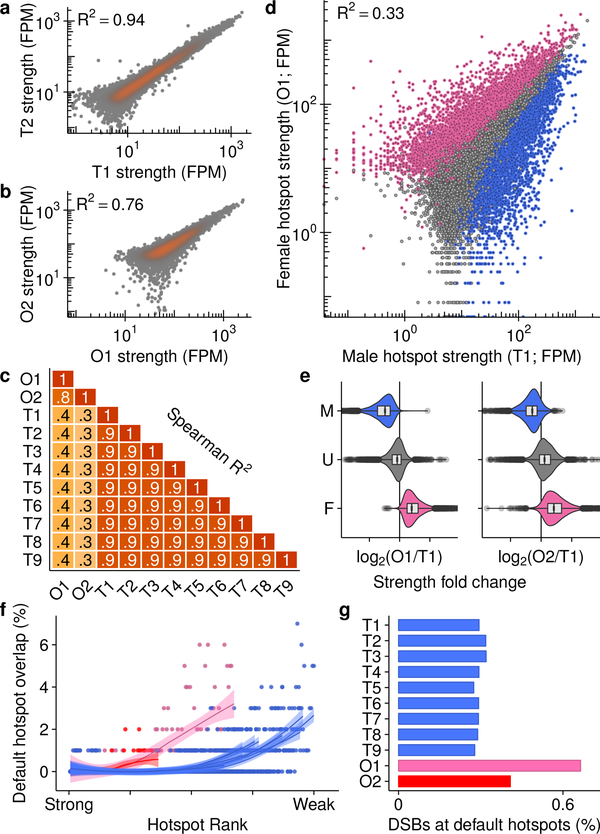
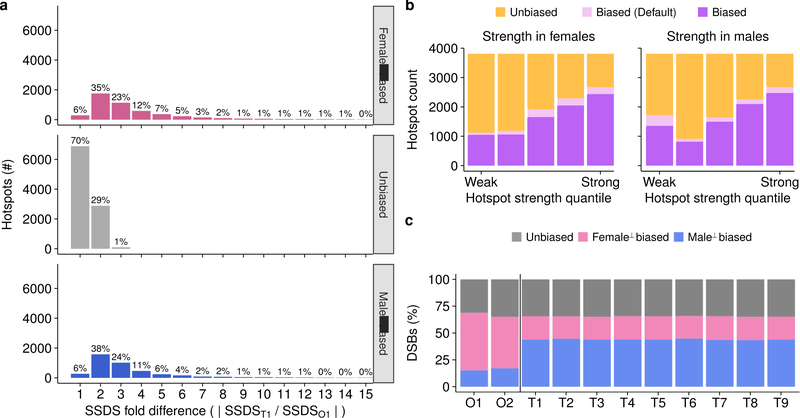
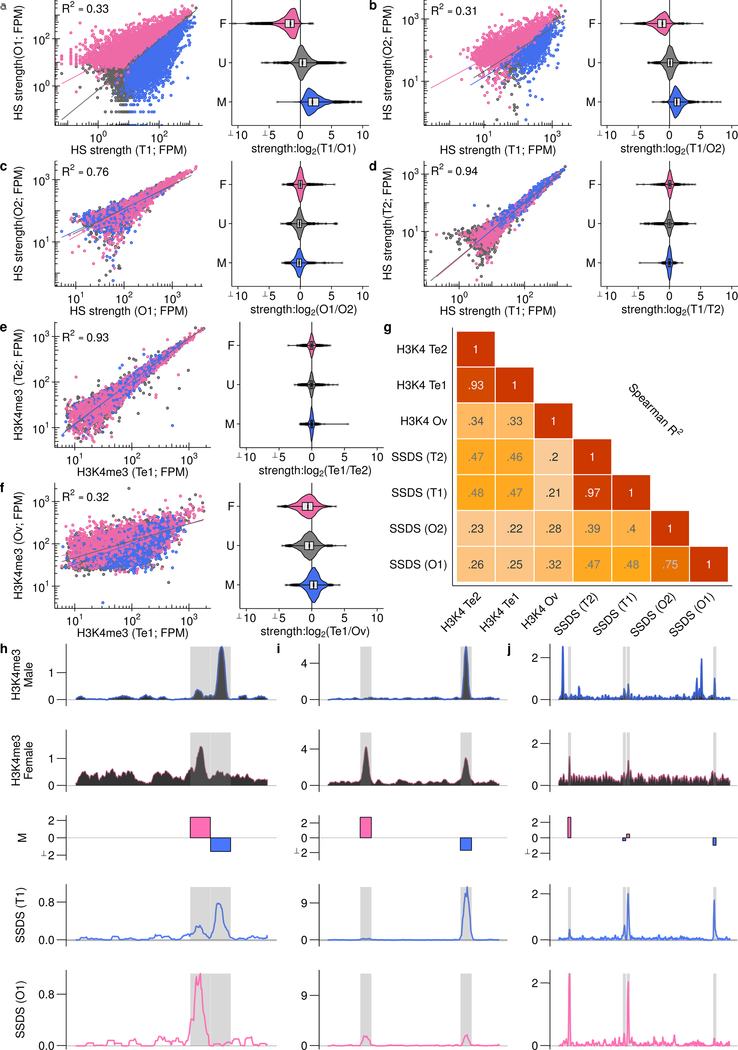
The SSDS signal at hotspots is highly reproducible in males, with little inter-individual variability (Fig 2a,c; Spearman R2 ≥0.90). Between females, the SSDS signal is also highly correlated (Fig 2b; Spearman R2 = 0.76) but to a slightly lesser degree; noise in SSDS estimates for the lower quality O2 map likely reduced this correlation (Extended Data Fig 2e-f) but stochasticity of hotspot targeting in individual females cannot be ruled out. This is unlikely however as the mice are genetically homogeneous and negligible inter-individual variation is seen in males. The SSDS signal at hotspots is strikingly different between males and females (Fig 2c,d; Spearman R2 ≤0.4). Indeed, examination of all DSB hotspots found in the best male (T1) or best female (O1) sample (20,119 hotspots; see Methods) revealed that 48% of autosomal hotspots are sex-biased (P <0.001, MAnorm18 - see Methods; Fig 2d; Nmale-bias = 4,169 [22%], Nfemale-bias = 5,021 [26%]; Nunbiased = 9,863 [52%]). The average sex-biased hotspot differed between the sexes by 4.0 ± 4.3-fold (mean ± s.d.; median = 2.7-fold), and 1,746 hotspots showed over 5-fold difference (Extended Data Fig 4a). Sex-biased hotspots are likely under-detected, because at stronger hotspots, where we have the greatest power to detect sex differences, >60% of hotspots are sex-biased (Extended Data Fig 4b). Importantly, sex biases are consistent between the O1 and O2 samples (Fig. 2e, Extended Data Fig 5a,b), therefore they reflect true sex differences, and not sampling noise in the pooled ovary maps. 44 ± 0.4% of the SSDS signal in males and 51 ± 4% (mean ± s.d.) in females occurs at hotspots biased to their respective sex (Extended Data Fig 4c). In addition, a further 16 – 21% occurs at hotspots biased to the opposite sex (female-biased hotspots in males or male-biased hotspots in females). Therefore, although most hotspots are used in both sexes, the majority of the SSDS signal, in both sexes, originates at sex-biased hotspots.
Fig 2.
Extensive sex differences in DSB hotspot usage. a-c, Hotspot strength is consistent between replicates from the same sex, c,d, but differs between males and females. a-c, Only hotspots called in both maps are considered. d, Strength differs between males and females (female-biased (pink), unbiased (grey) and male-biased hotspots (blue)). e, Sex biases are consistent in replicate ovary maps. Curves show LOESS smoothing for each sample. f, Default hotspots are used more frequently in females (O1 = pink, O2 = red, T1–9 = blue). Overlaps counted in 250-hotspot bins. g, More DSBs occur at default hotspots in females.
SSDS is an accurate measure of DSB frequency (hotspot strength), tightly correlated with an independent measure of hotspot strength in male mice16. Nonetheless, since the SSDS signal is likely affected by the lifespan of DSB repair intermediates16,19, a component of the observed sex biases may arise from differential DSB repair dynamics between the sexes. To establish if sex biases precede DSB formation, we examined Histone 3 Lysine 4 trimethylation (H3K4me3), a histone modification introduced at hotspots by PRDM920. The H3K4me3 signal at hotspots correlated better with SSDS signal from the respective sex (Extended Data Fig 5e-j): 69% of female-biased hotspots coincided with a H3K4me3 ChIP-Seq peak in fetal ovary, but just 39% of male-biased, and 43% of unbiased hotspots overlapped these sites. Importantly, sex-biased hotspots defined using SSDS showed similar sex biases in H3K4me3 signal (Extended Data Fig 5f). The magnitude of sex bias is reduced in H3K4me3 ChIP-Seq compared to SSDS, perhaps reflecting the reduced sensitivity of H3K4me3 ChIP-Seq at hotspots compared to SSDS. Thus, while the contribution of repair dynamics to sex biases remains unclear, sex biases in recombination appear to be established before DSB formation.
PRDM9 defines most DSB hotspots in both sexes, however, the default targeting pathway that targets DSBs to functional genomic sites in the absence of PRDM94, is used more frequently by females (Fig 2f,g; pink & red) than by males (Fig 2f,g; blue). Increased default targeting may arise because PRDM9 is limiting or because these sites become more accessible in female meiosis. Intriguingly, the recombination (CO) rate increases locally around functional genomic elements in human females but not males11. It remains unclear however, if the default targeting pathway is active in humans21.
Large-scale influences on sex biases
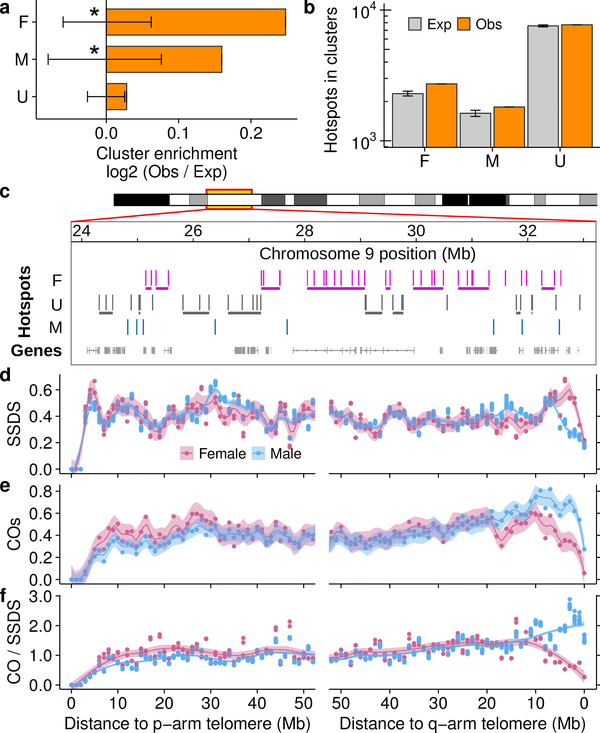
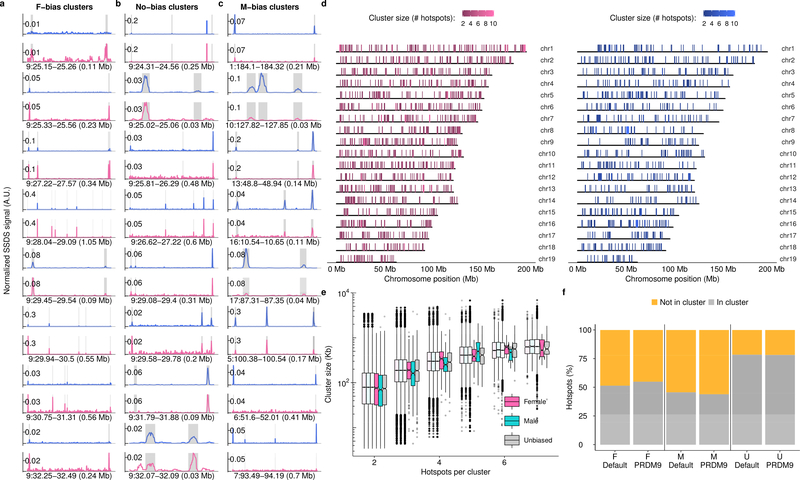
Chromatin context can modulate DSB hotspot usage6,19,22. Since meiotic chromosome packaging differs between males and females23,24 we looked for evidence of large-scale epigenetic effects that modulate sex biases. Both male-biased and female-biased hotspots occurred in clusters more frequently than expected (see methods; Fig 3a-c; Extended Data Fig 6a-c). Unbiased hotspots did not cluster (Fig 3a,b). Biased hotspot domains are evenly distributed across chromosomes (Extended Data Fig 6d) and there appears to be no constraint on cluster size (Extended Data Fig 6e). A similar proportion of default and PRDM9-defined hotspots were found in clusters (Extended Data Fig 6f) suggesting that domain-scale regulation of hotspot usage is independent of the mechanism that targets DSBs. Spatial clustering of sex biased crossovers occurs in humans10, prompting the question if these biases occur by a similar mechanism at the initiation of recombination. Deciphering the factors that govern clustering will require genome-wide analyses of meiotic chromosome structure in both sexes.
Fig 3.
Large-scale influences on sex-biased recombination. a,b, Sex-biased hotspots cluster more than expected (empirical P <0.001 (*); see Methods; error bars = ± 99.9% bootstrapped CI) b, Grey = median of 10,000 bootstraps; error bars: ± 99.9% CI; Obs = Observed. c, Clusters of female-biased hotspots (horizontal lines below hotspots). d, SSDS decreases in males (blue) relative to females (pink) adjacent to the q-arm telomere. e, COs25 increase in males in this region. f, Sex dimorphism in the CO:SSDS ratio. Profiles use 1 Mb non-overlapping windows. We focus on the q-arm because unassembled centromeric DNA abuts the p-arm telomere in mice.
Recombination in subtelomeric regions is of particular interest because both human and mouse females have decreased distal COs relative to males11,25. Distal COs in oocytes may be disfavored as they can increase the risk of chromosome mis-segregation26. The SSDS signal in sub-telomeric regions contrasts starkly with that of COs: SSDS is high in females relative to males (Fig 3d), whereas, COs25 are less frequent in females (Fig 3e). Distal COs in females may reduce gamete survival26 and be under-detected in pedigree studies. However, in fetal oocytes, where selection against karyotypic defects should be minimal, CO depletion was still seen at two subtelomeric hotspots27. Thus, the CO:SSDS ratio decreases close to the telomere in females, but increases in males (Fig 3f). Coupled with existing data27,28, this suggests that there are fewer COs per DSB in distal regions in females. Importantly, DMC1-SSDS underestimates DSB frequency in the distal 5 Mb of male mouse chromosomes29. Similar underestimation in females would amplify the DSB:CO deficit in females. Irrespectively, these data imply that DSB frequency is not the driver of sex differences in distal CO density.
DNA methylation modulates sex biases
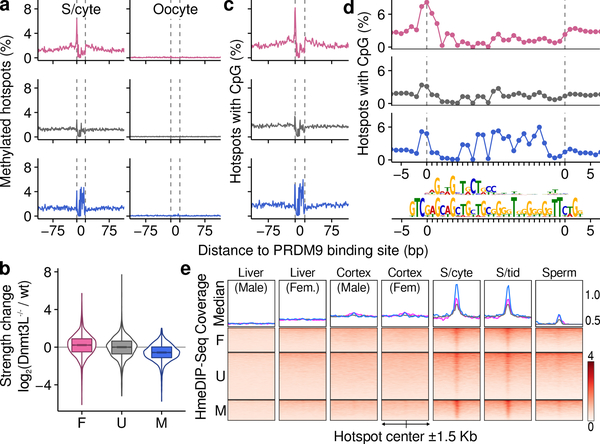
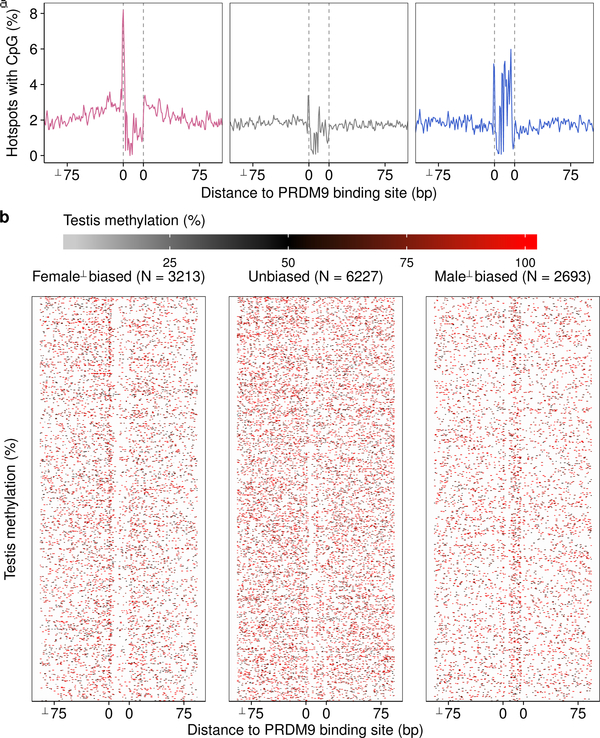
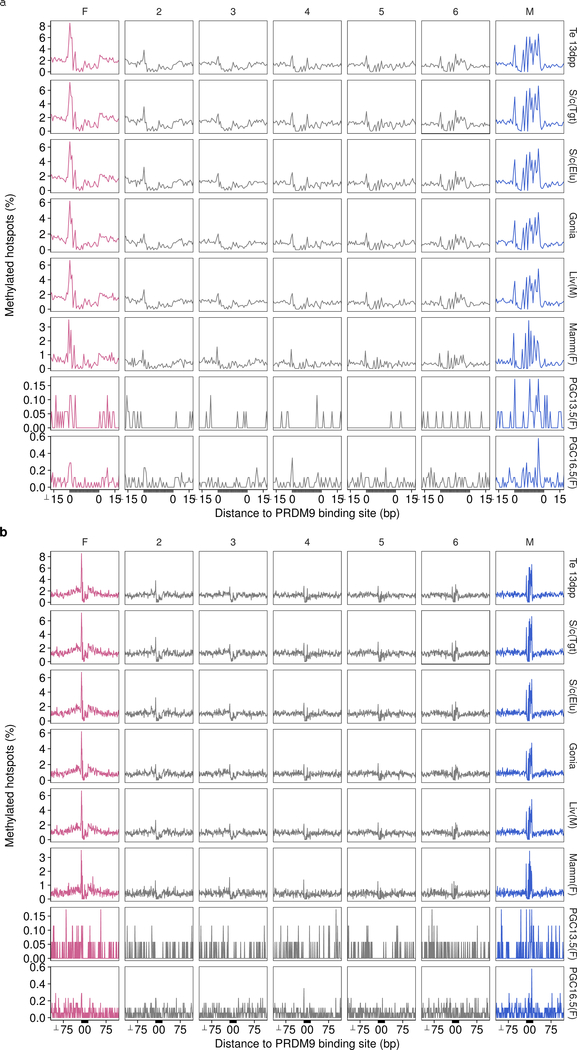
A remarkable difference between the sexes at the time of DSB formation is that the genome is globally demethylated in females but not in males30. DNA methylation can alter the site preferences of DNA binding proteins31; we therefore hypothesized that differential DNA methylation may cause sex biases at the initiation of recombination. Bisulfite sequencing data (Extended Data Figure 1h,i) revealed that the PRDM9 binding site (PrBS) is frequently methylated at male-biased hotspots (Fig 4a; Extended Data Fig 7), whereas at female-biased hotspots, DNA methylation instead increases in the region ± 75 bp adjacent to the PrBS. A methylation “spike” at the PrBS 5’ end is common to all hotspots. Neither sex-specific pattern is seen at unbiased hotspots and both patterns are most pronounced at hotspots with greatest sex biases (Extended Data Fig 8). Meiosis-specific processes do not give rise to these methylation patterns, because qualitatively similar patterns are seen in somatic tissue of both sexes (Extended Data Fig 8). Importantly, these sites do not escape demethylation in the female germ line (primordial germ cells (oocytes) at 16.5 dpc30; see Methods) (Fig 4a; Extended Data Fig 8).
Fig 4.
Sex-dimorphic DNA methylation at sex-biased hotspots. Female-biased (pink), unbiased (grey) and male-biased (blue). a, Average per base methylation from 13 dpp testis40 (spermatocytes (S/cyte); left) or 16.5 dpc primordial germ cells30 (oocyte; right). b, Sex-biased hotspots are altered in Dnmt3L−/− males. Female-biased hotspots strengthen (P = 10−123, Wilcoxon test) and male-biased hotspots weaken (P = 10−28, Wilcoxon test) relative to unbiased hotspots. c, DNA methylation mirrors CpG content. d, CpG density at inferred PrBS (upper motif). In silico predicted PrBS shown below. e, hMeDIP-Seq at DSB hotspots; data from liver & cortex41, spermatocytes (S/cyte)38, spermatids (S/tids)38 and sperm38.
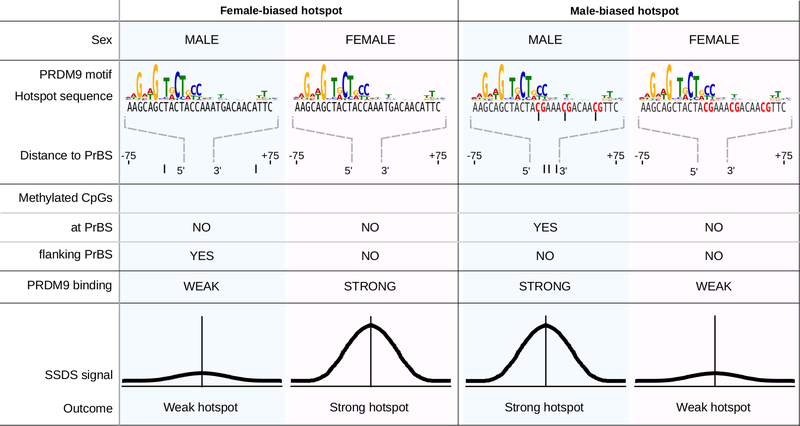
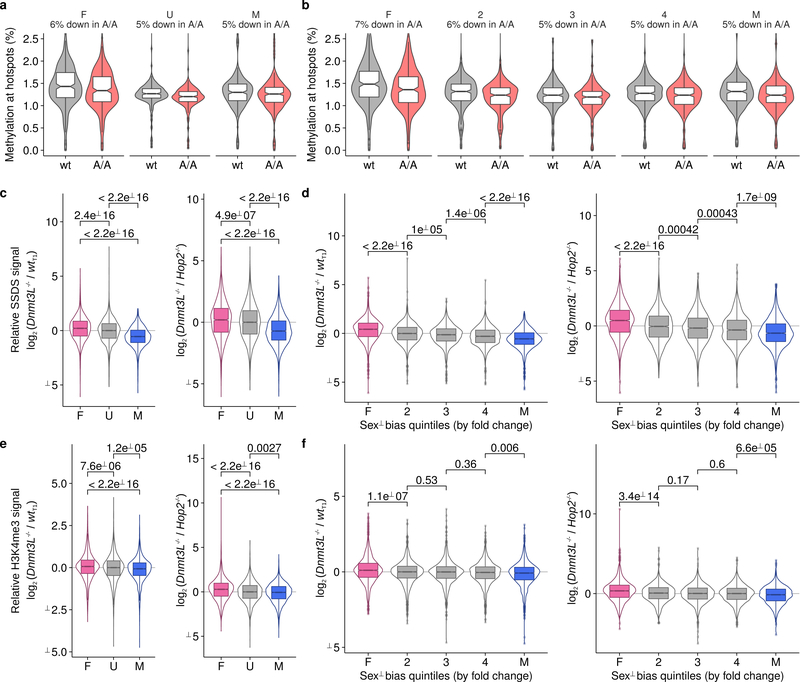
The distinct methylation patterns at male- and female-biased hotspots suggest that DNA methylation in males has a dual role in driving sex biases. At PrBS with particular methylated cytosines, PRDM9 binding and DSB formation is favored, whereas, DNA methylation flanking the PrBS disfavors DSBs (Extended Data Fig 9). To test this prediction, we mapped DSBs in male mice lacking functional DNMT3L, a DNA methyltransferase critical to meiosis32. In mice with non-functional DNMT3L33, DNA methylation is reduced by just 5–7% at PrBS (Extended Data Figure 10a,b). Despite a reported relocalization of DSBs in Dnmt3L mice34, most SSDS-defined hotspots coincide with those in wild type (94 ± 2%; mean ± s.d. in T1-T9). Female-biased hotspots were significantly stronger in Dnmt3L−/− compared to wild-type males, whereas male-biased hotspots were weaker (Fig 4b, Extended Data Fig 9, 10c,d). This strongly implies that DNA methylation indeed suppresses DSB formation at female-biased hotspots in males, but promotes DSB formation at male-biased hotspots. Importantly, a similar pattern was seen in the Dnmt3L−/− H3K4me3 ChIP-Seq signal at hotspots (Extended Data Fig 10e,f), implying that DNA methylation mediates sex differences before DSB formation.
DNA methylation occurs primarily at CpG dinucleotides35, and methylation patterns at hotspots closely reflect CpG density (Fig. 4c). Thus, underlying differences in the DNA bound by PRDM9, by virtue of being frequently methylated, can result in sex biases. At female-biased hotspots, DNA methylation flanking the PrBS appears to suppress hotspot usage. Although high copy repeats are generally methylated, we find no repeat elements specifically enriched at female-biased hotspots (see Methods). Alternatively, the observed DNA methylation may favor nucleosome assembly36 or exert other epigenetic effects that inhibit DSB formation at these loci in males. At male-biased hotspots, CpG density is highest at the 3’ end of the PrBS (Fig. 4d; upper motif). This region of the empirically determined PrBS has few apparent binding preferences, however an in silico prediction of the PrBS5,37 revealed a G-rich consensus at the 3’ end (Fig. 4d; lower motif), consistent with more frequent DNA methylation on the C-rich complementary strand (data not shown). This heretofore unappreciated complexity of PRDM9 binding appears to dictate male sex biases, and therefore, the extent of sex biases may vary among Prdm9 alleles. The most prevalent allele of PRDM9 in humans binds a C-rich sequence and therefore, is potentially affected by DNA methylation mediated sex biases. Male-biased recombination in humans is most prominent in distal regions11 and intriguingly, PrBSs containing a CpG are closer to chromosome ends (28 ± 28 Mb; mean ± s.d.) than other PrBSs (36 ± 29 Mb; mean ± s.d.).
Bisulfite sequencing does not distinguish between methylated (5-mC) and hydroxymethylated (5-HmC) cytosines. Therefore, putatively “methylated” nucleotides may be a compound signature of 5-mC and 5-HmC. 5-HmC is highly enriched at DSB hotspots in elutriated (primarily pachytene) spermatocytes38 and in spermatids38. Only residual 5-HmC at hotspots remains in sperm38, and in contrast to 5-mC (Extended Data Fig 8), the 5-HmC signal at hotspots is absent in somatic cells (Fig 4e). Thus, 5-HmC is transiently enriched at hotspots during male meiosis. 5-HmC or DNA demethylation may therefore contribute to meiotic DSB repair, consistent with previous studies that implicated in the DNA damage response in mitotic cells39. It remains to be seen if the role of 5-HmC in meiotic DSB processing differs between the sexes.
Altogether, these data reveal extensive sex biases at the onset of meiotic recombination and several mechanisms that modulate these biases. Future examination of these mechanisms will yield additional insights into how females and males differentially shape evolution of the genome.
Methods
Animal procedures
All animal procedures have been approved by the USUHS Institutional Animal Care and Use Committee or were performed according to the NIH Guide for the Care and Use of Laboratory Animals.
SSDS sample preparation and sequencing
DSBs form in the fetal ovary and the number of cells undergoing DSB repair are maximal between 15 and 16 days post coitum (dpc)9 (63–84% of meiocytes are in leptotene/zygotene stages). Thus, fetal ovaries were dissected from embryos at 15.5 dpc. Ovaries were dissected in cold PBS and stored at −80 oC until use. For SSDS, 90 or 230 ovaries were fixed in 1 ml PBS with 1% paraformaldehyde for 3 min, quenched and homogenized with Dounce homogenizer. Cells were collected by 10 min centrifugation at 900g using a bucket rotor. The pellet was washed in 1 ml of the following buffers: 1) PBS 2) 0.25% Triton X-100, 10 mM EDTA, 0.5 mM EGTA, 10 mM Tris pH 8. Cells were lysed in 0.5 ml of the lysis buffer (1% SDS, 10 mM EDTA, 50 mM TrisCl pH 8 with complete protein inhibitor cocktail (Roche)) and the chromatin was sheared with Misonix sonicator with the following parameters: efficiency 1, 10 s on, 20 s off, total sonication time 4 min. Chromatin was cleared by 10 min centrifugation at 12,000g at 4 °C. The supernatant was diluted 2-fold by ChiP buffer (0.01% SDS, 1.1% Triton X-100, 1.2 mM EDTA, 16.7 mM Tris-HCl, 167 mM NaCl) and dialyzed against the same buffer for 5 hr at 4 oC.
Chromatin was incubated with 6 μg of custom-made anti-DMC1 antibody and 20 μl Dynabeads (10002D, Invitrogen) at 4 oC overnight followed by washing with 500 μl of the following buffers: 1) 0.1% SDS, 1% Triton X-100, 2 mM EDTA, 20 mM TrisHCl, 150 mM NaCl; 2) 0.1% SDS, 1% Triton X-100, 2 mM EDTA, 20 mM Tris-HCl pH 8, 500 mM NaCl; 3) 0.25 M LiCl, 1% Igepal, 1 mM EDTA, 10 mM Tris-HCl, pH 8, 1% deoxycholic acid. DNA protein complexes were eluted by two consecutive 15 min incubations at 65 °C using elution buffer (0.1M NaHCO3, 1% SDS, 5 mM DTT). The eluates were combined and crosslinking was reversed at 65 °C for 5 hr. The samples were deproteinized and cleaned up with MinElute PCR purification kit (QIAGEN).
The sequencing library was prepared as previously described4 with minor modifications. Briefly, the end repair step was done in 1× T4 DNA ligase buffer with 10 mM ATP in the presence of 0.25 mM dNTPs, 0.6 U T4 DNA polymerase, 0.5 U Klenow, 2 U T4 polynucleotide kinase for 30 min at 20 °C. DNA was purified with MinElute kit. The second step was done in the presence of 1 mM dATP and 1U Klenow Exo-. Reaction was incubated at 37 °C for 30 min and DNA was purified with MinElute kit. To enrich for ssDNA the sample was denatured for 2 min at 95 °C, then cooled to room temperature. The sequencing adaptor mix (Illumina) was diluted 1:200 and added for the ligation step. DNA was purified by MinElute kit and amplified using Phusion Polymerase (0.5 μl per reaction), in the presence of 1 μl of each Illumina PE primers. The following parameters were used: initial denaturation at 98 °C for 30 s; 21 cycles: 98 °C 10 s, 65 °C 30 s, 72 °C 30 s; final extension for 5 min at 72 °C. Size selection was done in 2% agarose gel, 180–250 bp slice was excised and purified using MinElute Gel Extraction kit.
H3K4me3 ChIP-Seq sample preparation and sequencing
For H3K4me3 ChIP-Seq in oocytes, we isolated SCP3 positive meiotic oocytes from 14 15.5 dpc females using BiTS-CHiP42. Briefly, this method uses FACS to isolate nuclei on the basis of the presence of an intra-nuclear marker (in this case, anti-SCP3 (Santa Cruz: sc-74569)). Oocytes were isolated by gating for 4C nuclei with SCP3 signal above that from secondary antibodies alone. The gating strategy is outlined in Supplementary Figure 1. Kapa Hyper Prep kit (catalog #KR0961) was used to prepare the sequencing library due to the limited starting material relative to experiments in whole testis.
Testis sample preparation was performed as described previously4. The following antibodies were used: anti-DMC1: Santa Cruz (C-20, sc-8973), anti-DMC1: (custom), anti-H3K4me3: Millipore (#07–473). All sequencing was performed on an Illumina HiSeq 2500 at the NIDDK genomics core.
Targeted bisulfite sequencing
H3K4me3 ChIP-Seq was performed from whole testis as described before; however, the library preparation protocol was modified to perform bisulfite sequencing. Immediately following sequencing adapter ligation, we performed bisulfite conversion using the Qiagen EpiTect Bisulfite Kit (Cat #59104). Subsequent library amplification was performed using KAPA HiFi Uracil+ Kit, which is designed to tolerate uracil residues in bisulfite-treated DNA. Sequencing was performed on an Illumina HiSeq 2500 at the NIDDK genomics core and on an Illumina HiSeq X Ten by Admera Health.
Alignment of sequencing reads
For SSDS, reads were aligned to the genome and ssDNA derived reads were identified using the single stranded DNA sequencing (SSDS) processing pipeline3. Briefly, the first read of each mate pair is mapped to the genome with bwa (v0.7.12)43. The second read is then mapped to the genome using a modified bwa algorithm that finds the longest mapping suffix for each read. ssDNA is determined from the structure of inverted terminal repeats on the first and second end reads. The SSDS alignment pipeline is available at https://github.com/kevbrick/callHotspotsSSDS
All other sequencing data were aligned to the reference genome using bwa aln (0.7.12)43.
Evaluation of SSDS sensitivity for DSB detection in ovary
To estimate the lower hotspot detection limit using SSDS, we generated a DSB map using 2 × 10⁵ testis cells from Hop2−/− (Psmc3ip−/−) mice44. HOP2 is required for DSB repair, and ~37% of cells in testis of Hop2−/− mice harbor unrepaired DSBs (data not shown). The signal percentage of tags (SPoT) for this sample was 21% (Sample N1; Extended Data Fig. 1a); this is slightly lower than the SPoT for DSB maps from whole testis (23–46%; Samples T1–9; Extended Data Fig. 1a), but far above the 2% SPoT expected by chance. The estimated library size of N1 was about 10× smaller than for the smallest whole testis sample (Extended Data Fig. 1d), likely because of the limited starting amount of DNA. Small library size complicates hotspot detection, therefore we first attempted to map DSBs in females using approximately 10× more target cells (a pool of 90 ovaries; approximately 9 × 10⁵ target cells). This sample (O2) had a library size close to that of wt whole testis samples (Extended Data Fig. 1d) but a lower SPoT (7%; Extended Data Fig. 1a) suggested that hotspot DNA recovery from oocytes was less efficient than from testis. Subsequently, we pooled 230 fetal ovaries to generate a second ovary-derived DSB map (O1). This map was of similar quality to DSB maps derived from testis (SPoT = 33%; library size = 3.8 × 10⁷ fragments; Sample O1; Fig 1, Extended Data Fig. 1a,d).
DSB hotspot identification
Uniquely mapping fragments unambiguously derived from ssDNA (ssDNA type 1) and having both reads with a mapping quality score ≥30 were used for identifying hotspot locations (peak calling). NCIS45 was used to estimate the background fraction for each library. Peak calling was performed using MACS (v.2.1.0.20150420)46 with the following parameters: --ratio [output from NCIS] -g mm --bw 1000 --keep-dup all --slocal 5000. We use a mixture-model-based approach that accounts for GC-biases to calculate a corrected p-value for each hotspot (model = negative binomial; num. iterations for refinement = 100)47. P-values were adjusted for multiple testing using the Benjamini-Hochberg method. Hotspots with a GC-corrected P-value > 0.05 and DSB hotspots within regions previously blacklisted5 were discarded.
H3K4me3 peak calling
Uniquely mapping reads with a mapping quality score ≥30 were used for peak calling. NCIS was used to estimate the background fraction relative to an input DNA library. Peak calling was performed using MACS (v.2.1.0.20150420)46 with the following parameters: --ratio [output from NCIS] -g mm --bw 1000 --keep-dup all --slocal 5000. Peak strength was subsequently calculated by subtracting the NCIS45 normalized input read count from the ChIP-Seq read count.
H3K4me3 peaks that result from PRDM9 activity were inferred from the overlap with DSB hotspot locations. We also exclude any such sites that coincide with a DSB hotpot in Prdm9−/− mice4, as these are sites of PRDM9-independent H3K4me3.
Hotspot overlaps and merging hotspot sets
Unless otherwise stated, when assessing if hotspots occur at the same location, we restrict the overlap to the ± 200 bp region of DSB hotspots. Previously, we have shown that using a ± 200 bp regions is sufficient for detecting true overlaps and limits the number of spurious overlaps4. We merged DSB hotspots from the best testis and ovary samples (T1 and O1 respectively). The center of overlapping hotspots was defined as the mean center point of the T1 and O1 hotspot and the flanks were defined as the maximum distance from this center to the original T1 and O1 hotspot edges. Non-overlapping hotspots from each sample were retained as originally defined.
Strength metrics at hotspots
Hotspot strength measured by SSDS was calculated as described previously5. Briefly, the center-point of the Watson- and Crick-strand ssDNA fragment distributions was used to define the hotspot center. ssDNA fragments on the Watson (top) strand to the left and Crick (bottom) strand to the right of this center were considered signal. Background was extrapolated from the count of ssDNA fragments of opposite polarity around the center (excluding the very center of the hotspot). Hotspot strength is then calculated as the signal - background fragment count. This strength is used as a proxy for DSB frequency4,5. Scripts for peak calling and strength quantitation are available at https://github.com/kevbrick/SSDSpipeline. Hotspot strength measured from SPO11-oligo mapping was calculated as the sum of the strengths of SPO11 oligo peaks overlapping each hotspot. SPO11-oligo peaks were downloaded from the processed data associated with the GEO record (GSM2247727)16. H3K4me3 strength at hotspots was calculated as the sum of the strength of overlapping H3K4me3 peaks.
Sample SPoT reduction
SPoT is calculated as the number of in-hotspots ssDNA fragments divided by the total number of ssDNA fragments. To reduce SPoT, the required number of randomly selected in-hotspot fragments are discarded. If necessary background fragments are added from an input DNA library.
Default hotspots
Hotspots found in Prdm9−/− DSB maps and lacking a putative PrBS were designated as “default” hotspots. Default hotspots constitute 8.5% (427/5,021) of female-biased hotspots but only 1.3% (58/4,169) of male-biased hotspots, therefore we distinguish PRDM9-dependent and default hotspots in subsequent analyses.
Sex bias determination
We used MAnorm18 to infer differential usage of DSB hotspots between the T1 and O1 samples. All hotspots from the T1, O1 merge were used as “common” peaks. Hotspots on chromosomes X, Y and M were excluded from this analysis. MAnorm p-values were adjusted for multiple testing using the Benjamini-Hochberg method and hotspots with a corrected p-value <0.01 were considered differential.
Cluster analysis
We identified groups of adjacent hotspots that shared the same sex-bias (female-biased, male-biased, unbiased). Only uninterrupted runs of hotspots with the same bias were considered. A cluster is >1 consecutive hotspots with the same sex bias. To estimate the expected numbers of hotspots in clusters, hotspot bias designations were shuffled and the aforementioned process was repeated. 10,000 iterations of this randomization process were performed. P-values are calculated from the empirical distribution of expected values for clusters of each size.
Generation of randomized maps of DSB hotspots
DSB hotspot locations were randomized as described in4. Briefly, hotspots were uniformly distributed per chromosome, but prohibited from being placed at unmappable regions. Specifically, a mapability score for 40-bp sequencing reads at each mm10 base was calculated using the GEM library (20100419–003425)48. Hotspot excluded regions were defined as annotated assembly gaps from UCSC), in addition to 1 kb genomic intervals with <50% uniquely mappable bases plus 1 kb either side. Hotspot width and strength were preserved at the randomized location for each hotspot.
Genetic crossovers
The locations of mouse crossovers in were obtained from the Collaborative Cross25. To assess if the elevated male crossover rate in the q-arm subtelomeric region is Prdm9 dependent, we inferred genetic crossovers that were likely to have been formed by the B6, CAST or PWD alleles of PRDM9. Crossovers likely defined by the B6, CAST and PWD/PWK alleles of PRDM9 were determined by first identifying crossovers that occurred in hybrids involving any of these pure strains (MGP,MGM,PGP,PGM). Crossovers that coincided with a single DSB hotspot from only one of the parental PRDM9 alleles were then designated as having originated from that allele. All hotspots between B6, 129 and WSB mice that coincided with a B6, C3H or 13R-defined DSB hotspot were designated as having originated from Mus musculus domesticus (Dom). COs that did not overlap any DSB hotspot from either parental genotype and COs from crosses for which DSB hotspot maps were not available were designated as “Ambiguous”. Crossovers derived from all PRDM9 alleles showed similar sub-telomeric enrichment for males relative to females (not shown), consistent with previous reports25. Thus, this enrichment appears a Prdm9-independent phenomenon.
DNA methylation
For BSSC, BSH3K4me3, BSSG, BSDAA, BSDWT (Extended Data Fig 1h,i), bismark49 was used to align whole genome bisulfite sequencing (WGBS-Seq) data to the reference mm10 genome. For BSrahu, BSPGC, BS13.5, BSLIV, BSMG (Extended Data Fig 1i), pre-processed nucleotide-resolution methylation data were available, therefore UCSC liftover50 was used to convert these data from mouse mm9 to mouse mm10 genomic coordinates where necessary. hMeDIP-Seq reads38 were mapped to the genome using bwa mem (0.7.12)43 and default parameters.
To examine methylation patterns, we first inferred a high confidence set of PrBSs at DSB hotspots. We used FIMO51 to identify matches to the B6 PrBS4 PWM within hotspots. The number of matches to the position weight matrix (PWM) of the PrBS depends on the alignment score threshold used, therefore we identified the PWM p-value alignment threshold that yielded the maximal number of DSB hotspots with a single match to the PRDM9 PWM within the central ± 250 bp. We tested the following threshold values: P ≤ 5×10⁻³, 1×10⁻⁴, 2×10⁻⁴, 4×10⁻⁴, 6×10⁻⁴, 8×10⁻⁴, 1×10⁻⁵, 2×10⁻⁵, 4×10⁻⁵, 6×10⁻⁵, 8×10⁻⁵, 1×10⁻⁶, 1×10⁻⁷, 1×10⁻⁸. 12,097 / 19,053 hotspots (63%) contained a single PrBS at the optimal threshold (P ≤ 4×10⁻⁴).
High copy repeats at DSB hotspots
High copy repeats determined by repeatmasker52 for the mouse mm10 genome were split into 67 groups by family. Repeat families that overlapped <0.2% of any hotspot set were excluded. To assess if hotspots biased to each sex associated with different DNA high copy repeat families, we counted the frequency of repeats overlapping the central ± 200 bp of female-biased, unbiased and male-biased hotspots. To assess differences, we performed a two-sided binomial test for all pairwise comparisons (male/female, male/unbiased, female/unbiased). P-values were Bonferroni corrected to account for multiple testing and a corrected P-value of P <0.01 was used to assess differences. Repeats that showed significantly different enrichment in one set of hotspots compared to both others were investigated. From this analysis, two families of LTR retrotransposons (LTR & LTR/ERVK) are depleted at male-biased hotspots, whereas LINE/L1, SINE/Alu and SINE/1D elements are depleted at female-biased hotspots relative to the other two sets. Notably however, no repeat families are elevated exclusively at either set of sex-biased hotspots.
Extended Data
Extended Data Fig 1: Sample details and quality metrics for DSB maps.
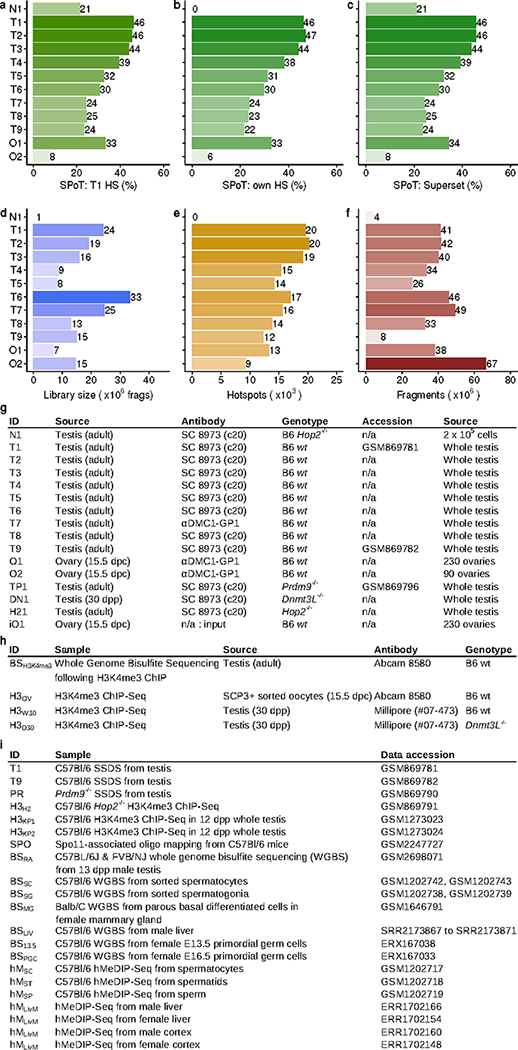
The fraction of reads in peaks is calculated for all samples at a, hotspots identified in the T1 sample. Sample identifiers are in panel g. b, Hotspots identified in each respective sample or c, hotspots in the combined T1/O1 superset. Peak calling was not performed for N1 (see Methods). d, The estimated library size (x) was inferred using bisection root finding for f(x) = (1-NNR/x)-exp(NTOT/x), 104 <= x <= 1012; NNR = # unique fragments; NTOT = # total fragments. e, The number of hotspots identified in each sample. f, The number of ssDNA fragments sequenced for each sample. g, Details of SSDS samples. Sample N1 was generated from Hop2−/− mice using 2 × 10⁵ cells. This sample was run in single-end mode, and not processed through the ssDNA pipeline. Previously published samples are referenced by GEO accession number. Note that the use of the SC8973 (c20) and αDMC1-GP1 antibodies gave indistinguishable SSDS results in males (Figure 2C, Extended Data Figure 2A). h, Details of samples from H3K4me3 ChIP-Seq. i, Details of publicly available datasets used.
Extended Data Fig 2: Most DSB hotspots are used in both male and female meiosis.
a, The maximum reciprocal overlap between hotspots in each sample was calculated using the central ± 200 bp of hotspots. b, Hotspots exclusively found in either sex are weak. Hotspots were split into those found in both O1 and T1 (both; grey), O1 but not T1 (Female-only; pink) and T1 but not O1 (Male-only; blue). c, Female-only hotspots are weak in females, relative to shared hotspots. d, Male-only hotspots are weak in males, relative to shared hotspots. e, The O2 SSDS correlates better with hotspot strength in ovary (O1) than in testis (T1). Only hotspots that are detected in both samples are shown for each comparison. Note that the correlation between hotspot strength in ovary samples (Spearman R2O2O1 = 0.76) is not as high as that between replicates of SSDS in males (minimum R2 ≥0.9; Fig 2). f, Noise in SSDS estimates can fully explain this diminished correlation between ovary-derived SSDS maps. We generated a series of down-sampled O1 SSDS datasets to test if reducing the SPoT would reduce the maximum possible R2. For each simulated dataset, signal reads were randomly chosen from the uniquely mapping in-hotspot ssDNA fragments of the O1 DMC1 SSDS sample. Background fragments were randomly chosen from all uniquely mapping ssDNA fragments of the O1 input DNA SSDS sample. Samples at different SPoTs were then generated by varying the number of signal and background-derived reads (SPoT = signal/(signal+background)). The number of fragments was matched to the number of uniquely mapping fragments in O2. 10 replicate samples were generated for each SPoT, and the correlation coefficient (Spearman R2) with the original O1 SSDS sample was calculated. The magenta lines indicate the expected maximum R2 for a sample with a SPoT matching that of O2. The expected maximum R2 is very close to the observed R2. Thus, noise in SSDS estimates can reduce the R2 to within the observed range for a sample of this quality.
Extended Data Fig 3: SSDS signal at hotspots is narrower in ovaries than in spermatocytes.
a, SSDS coverage is a measure of DMC1-bound ssDNA either side of each meiotic DSB. In a population of meiocytes, DSBs will occur in a several hundred nucleotide window around the hotspot center (orange rectangle). To assess coverage, we first convert the position of each SSDS fragment into the distance along ssDNA from the hotspot center. Merging the top and bottom strand fragments in this way increases coverage two-fold and minimizes the influence of asymmetric gaps and fluctuations in coverage. Coverage at each hotspot was normalized by the maximum value at the hotspot to prevent strong hotspots from dominating the average profile. The average normalized coverage across all hotspots was then calculated. DSB hotspots identified in b, females (ovary sample O1) and c, males (testis sample T1) were each split into three bins by strength. Coverage was calculated for all nine male and two female samples for each set. The SSDS signal is narrower for all female samples compared to male samples. The difference is particularly pronounced at stronger hotspots, where coverage estimates are most accurate. At the widest point, the mean male and female profiles diverge by ~0.4 Kb. d, We also examined the MACS-determined hotspot boundaries to further negate the possibility that the average profiles in B-C are not a reflection of the population. By this metric, the mean hotspot width estimated from male samples (1,759 ± 73 bp; mean (solid blue line) ± SEM (dashed blue lines); n = 9) is significantly wider the mean width of hotspots in female samples (1,490 ± 89 bp; mean (solid pink line) ± SEM (dashed pink lines); n = 2) (t-test; P = 0.0007). Sequencing quality and sample SPoT can affect width estimates, therefore, we processed each sample as follows; we reduced the SPoT of each sample to that of the lowest quality sample (O2; see Methods), considering only uniquely mapping and high quality (Q >30) ssDNA type 1 fragments. We then reduced all samples to have the same number of fragments as the smallest. On these datasets, we performed peak calling and retained only DSB hotspots that were called in all samples (N = 1,975). e, Potential mechanistic explanations for the difference in SSDS signal between males and females. These differences may manifest in all meiocytes or in sub-populations. Importantly, we see no evidence of shape differences at hotspots in sub-populations of spermatocytes (data not shown).
Extended Data Fig 4: Most meiotic DSBs occur at sex-biased hotspots.
a, Quantification of SSDS fold change at sex biased and unbiased hotspots. The percentages show the percentage of hotspots in each category with a given absolute fold-change. b, The hotspots in the testis/ovary super set were split into quintiles by strength in either females (left panel) or males (right panel). In both sexes, over 60% of the strongest hotspot subset exhibit sex-biased DSB formation. This is a proxy for the true amount of sex-biased DSB formation. In progressively weaker hotspot sets, fewer biased hotspots are detected. One outlier is the set of weak male hotspots. This set contains many female-biased default hotspots that form independently of PRDM9. c, We quantified the total in-hotspot SSDS signal at female-biased, unbiased and male-biased hotspots in the two ovary-derived samples and in the nine testis samples. In all cases, over half of the in-hotspot sequencing tags (referred to as total DSBs) occur at sex-biased hotspots. Hotspots biased towards usage in females are enriched in ovary samples, while those biased towards male usage are enriched in testis-derived samples.
Extended Data Fig 5: Sex biased hotspots are consistent across replicates and are defined before DSB formation.
Hotspot strength was calculated at all autosomal hotspots from the merged O1/T1 DSB maps. The strength of hotspots was re-calculated in two testis (T1, T2) and two ovary (O1, O2) maps. Female-biased (pink), unbiased (grey) and male-biased hotspots (blue) were determined by comparing the T1 and O1 maps. These hotspots are colored the same in all panels. a, Sex-biased hotspots are distributed as expected when comparing the O1 and T1 DSB maps. These data are also plotted in Fig. 2d,e. b, Sex-biased hotspots exhibit the same sex-biases in the O2 sample. c,d, Sex-biased hotspots exhibit no biased usage between samples derived from mice of the same sex. e-g, Sex biases that precede DSB formation were studied by performing H3K4me3 ChIP-Seq in fluorescence assisted cell sorting (FACS)-purified fetal oocytes at 15.5 dpc (see Methods). The H3K4me3 signal at hotspots was quantified and compared to existing maps of H3K4me3 in juvenile mouse testis68. e, The H3K4me3 signal at hotspots is tightly correlated in replicate samples from mouse testis (H3KP1, H3KP2; (Extended Data Fig 1i). f, Akin to what we observe when examining the SSDS signal at DSB hotspots, there is extensive variation in the H3K4me3 signal at hotspots between male and female meiosis. This implies that sex biases are established before DSB formation. Sex biases determined using SSDS remain broadly conserved when we compare H3K4me3 in females to males. g, H3K4me3 at hotspots is better correlated with SSDS from the respective sex. h-j, Sex biases in H3K4me3 ChIP-Seq parallel differences in SSDS signal. H3K4me3 ChIP-Seq coverage is shown in upper panels; Testis (H3KP1; blue) and Ovary (H3OV; pink). The middle panel shows the log2 fold difference (M) between the SSDS signal in testis (T1) and ovary (O1). SSDS coverage for these samples is shown in the lower panels. Grey boxes represent DSB hotspot positions. To allow for quantitative cross comparison, the coverage in each sample is normalized by median signal strength at DSB hotspots in that sample. The genomic coordinates of each window are given underneath.
Extended Data Fig 6: Clustering of sex-biased hotspots.
a,b,c, SSDS coverage at a subset of biased hotspot clusters. The a, female-biased and b, unbiased clusters are those shown in Fig 3a. c, Since no male-biased clusters are depicted in Fig 3a, eight clusters were randomly chosen. Testis (T1; blue) and ovary (O1; pink) SSDS coverage are shown for each cluster. To allow for quantitative cross comparison, coverage in each sample is normalized by the median hotspot strength. Grey boxes represent DSB hotspot positions. d, Genomic patterning of sex-biased DSB hotspots. Female-biased (left; pink) and Male-biased (right; blue) hotspot clusters on all autosomes. Biased hotspots do not exhibit particular spatial patterning, aside from a slight enrichment of female-biased hotspots at the q-Arm telomere. e, The physical size of hotspot clusters scales with the number of hotspots per cluster. It therefore seems unlikely that clustering results from a physical size constraint imposed by sex-specific chromatin structure. Importantly however, the presence of such a size constraint may be masked by the presence of a large number of clusters that occur by chance. Semi-transparent boxplots show the expected size distribution for randomly distributed clusters (n = 1,000 bootstraps). Clusters of three male-biased hotspots are marginally smaller than expected. There are no significant differences for clusters of other sizes. f, Similar proportions of PRDM9-defined and default hotspots occur in clusters. Hotspots in clusters of ≥ 2 consecutive hotspots of the same type were counted.
Extended Data Fig 7: Differing patterns of DNA methylation at sex-biased hotspots.
a, Mean DNA methylation40 at the putative PrBS (grey bar) of female-biased (pink), unbiased (grey) and male-biased (blue) hotspots. Note that this panel is also shown in Fig 4a. b, Heatmap rows depict methylation at individual hotspots. Note that the density of methylation appears higher at unbiased hotspots because rows are more densely spaced.
Extended Data Fig 8: DNA methylation at PrBSs is present across tissues and absent in the female germ line.
The pattern of DNA methylation is very similar across cell types and between the sexes. Hotspots are split by the magnitude of sex bias (SSDSO1/SSDST1) into seven sets. Sets are ranked from most female-biased (pink; left) to most male-biased (blue; right) by fold-change. Methylation signal is binarized such that methylation > 0% is considered methylated. Thus, the proportion of all hotspots with methylated cytosine at each position is shown. Variations in the magnitude of the signal may be expected for technical reasons. Plots are anchored by the C57Bl6 PrBS (grey area). Only hotspots with a single PRDM9 binding site are used (see Methods). a, Plot of ± 100 bp to show methylation flanking the PrBS for female-biased hotspots. b, Plot of ± 15 bp to show methylation at the PrBS for male-biased hotspots. Methylation data are from whole genome bisulfite sequencing (WGBS) in tissue derived from whole testis in 13dpp mice40 (Te 13 dpp), from WGBS following H3K4me3 CHiP-Seq in whole adult testis (S/c(Tgt)); Extended Data Fig 1h), from WGBS in elutriated spermatocytes38 (S/c(Elu)), from WGBS in spermatogonia38 (Gonia), from WGBS in tissue from male liver53 (Liv(M)), from WGBS in tissue from female parous basal differentiated mammary gland cells54 (Mamm(F)) and from WGBS in sorted primordial germ cells at 13.5 dpc (PGC13.5(F)) and at 16.5 dpc30 (PGC16.5(F)). WGBS in female PGCs captures the methylation status of the genome in oocytes during meiosis30. 13.5 dpc and 16.5 dpc likely represent earlier and later meiotic prophase I populations, respectively.
Extended Data Fig 9: Dual role of DNA methylation at hotspots in defining sex biases.
DNA methylation has a dual role in modulating sex-biased DSB formation. (Left panels) At female-biased hotspots, DNA methylation in the region flanking the PrBS can suppress PRDM9 binding. Thus, in males, the use of these PrBS is reduced, resulting in a female-biased hotpsot. Methylated CpG dinucleotides (in males) are schematically shown as filled black circles. (Right panels) At male-biased hotspots, DNA methylation at CpGs appears to favor PRDM9 binding and DSB formation. This results in a relatively strong DSB hotspot in males, but a relatively weak hotspot in females, where DNA methylation at these sites is absent.
Extended Data Fig 10: Hotspot strength variation in Dnmt3L−/− mice.
(A,B) CpG methylation is partly reduced at PRDM9 binding sites in mice lacking functional DNMT3L. We compared WGBS data from Dnmt3LA/A (A/A) and matched wild-type (wt) mice33. The ± 100-bp region around the PRDM9 binding sites was examined. Hotspots were split either by (A,C,E) sex-bias (female-biased, F, pink; unbiased, U, grey; male-biased, M, blue) or (B,D,F) into quintiles by the fold change between the O1 and T1 SSDS samples (most female-biased, F on left to most male-biased, M on right). The percentage decrease in the mean DNA methylation signal in Dnmt3LA/A mice for each set is given in the sub-panel title. DNA methylation is reduced 5–7%. (C-F) The usage of sex-biased hotspots is altered in mice where DNA methylation is reduced (Dnmt3L−/−). (C) The log2 fold change between the tags per million normalized signal at hotspots in Dnmt3L−/− and wt (T1) male mice is shown (left panels). To control for spermatocyte population changes resulting from meiotic arrest, in the right-hand panels, we compare to experiments in Hop2−/− males instead of wt. HOP2 is essential for stabilizing recombination intermediates and mice lacking functional HOP2 exhibit spermatogenic arrest after DSB formation. Hotspots overlapping gene promoters or default hotspots are excluded as the non-PRDM9 derived H3K4me3 signal would confound these analyses. Furthermore, only hotspots detected in all samples being compared were analysed to remove spurious potential background correlation (C-F; Nhotspots = 9,137). P-values for all comparisons are shown above the data (Wilcoxon test). (C) The SSDS signal at female-biased hotspots is significantly increased in Dnmt3L−/− mice compared to male-biased hotspots or unbiased hotspots. The strength of male-biased hotspots is relatively decreased. (D) This is also seen when we simply split hotspots by fold change. (E) H3K4me3 at female-biased hotspots is significantly increased in Dnmt3L−/− mice compared to male-biased hotspots. H3K4me3 signal at each hotspot was calculated as the sum of overlapping H3K4me3 peak strengths. This is a proxy for DSB hotspot strength, because PRDM9 trimethylates histone H4 lysine 3 before DSB formation. (F) This is more apparent when we split hotspots into quintiles by sex-bias, likely because H3K4me3 at hotspots is a weak signal.
Supplementary Material
Acknowledgments
We thank P. Hsieh for critical feedback and the NIDDK genomics core and NHLBI flow cytometry core for assistance. This work utilized the computational resources of the NIH HPC Biowulf cluster (http://hpc.nih.gov).
This research was supported by NIGMS grant R01GM084104 (G.V.P.), March of Dimes Foundation grant 1-FY13–506 (G.V.P.) and by the NIDDK Intramural Research Program (R.D.C-O.). Sequencing data are archived at www.ncbi.nlm.nih.gov/geo (GSE99921).
Footnotes
The authors declare no conflicts of interest.
Data Availability
Sequencing data are archived at the Gene Expression Omnibus (accession GSE99921; www.ncbi.nlm.nih.gov/geo).
References
- 1.Lenormand T, Engelstädter J, Johnston SE, Wijnker E & Haag CR Evolutionary mysteries in meiosis. Philos. Trans. R. Soc. Lond. B Biol. Sci 371, 20160001 (2016). [DOI] [PMC free article] [PubMed] [Google Scholar]
- 2.Tortereau F et al. A high density recombination map of the pig reveals a correlation between sex-specific recombination and GC content. BMC Genomics 13, 586 (2012). [DOI] [PMC free article] [PubMed] [Google Scholar]
- 3.Khil PP, Smagulova F, Brick KM, Camerini-Otero RD & Petukhova GV Sensitive mapping of recombination hotspots using sequencing-based detection of ssDNA. Genome Res. 22, 957–965 (2012). [DOI] [PMC free article] [PubMed] [Google Scholar]
- 4.Brick K, Smagulova F, Khil P, Camerini-Otero RD & Petukhova GV Genetic recombination is directed away from functional genomic elements in mice. Nature 485, 642–645 (2012). [DOI] [PMC free article] [PubMed] [Google Scholar]
- 5.Smagulova F, Brick K, Pu Y, Camerini-Otero RD & Petukhova GV The evolutionary turnover of recombination hot spots contributes to speciation in mice. Genes Dev. 30, 266–280 (2016). [DOI] [PMC free article] [PubMed] [Google Scholar]
- 6.Smagulova F et al. Genome-wide analysis reveals novel molecular features of mouse recombination hotspots. Nature 472, 375–378 (2011). [DOI] [PMC free article] [PubMed] [Google Scholar]
- 7.Pratto F et al. Recombination initiation maps of individual human genomes. Science 346, 1256442–1256442 (2014). [DOI] [PMC free article] [PubMed] [Google Scholar]
- 8.Bishop DK, Park D, Xu L & Kleckner N DMC1: a meiosis-specific yeast homolog of E. coli recA required for recombination, synaptonemal complex formation, and cell cycle progression. Cell 69, 439–456 (1992). [DOI] [PubMed] [Google Scholar]
- 9.Peters H Migration of Gonocytes Into the Mammalian Gonad and Their Differentiation. Philos. Trans. R. Soc. Lond. B Biol. Sci 259, 91–101 (1970). [DOI] [PubMed] [Google Scholar]
- 10.Kong A et al. Fine-scale recombination rate differences between sexes, populations and individuals. Nature 467, 1099–1103 (2010). [DOI] [PubMed] [Google Scholar]
- 11.Bhérer C, Campbell CL & Auton A Refined genetic maps reveal sexual dimorphism in human meiotic recombination at multiple scales. Nat. Commun 8, 14994 (2017). [DOI] [PMC free article] [PubMed] [Google Scholar]
- 12.Cole F et al. Mouse tetrad analysis provides insights into recombination mechanisms and hotspot evolutionary dynamics. Nat. Genet 46, 1072–1080 (2014). [DOI] [PMC free article] [PubMed] [Google Scholar]
- 13.Halldorsson BV et al. The rate of meiotic gene conversion varies by sex and age. Nat. Genet 48, 1377–1384 (2016). [DOI] [PMC free article] [PubMed] [Google Scholar]
- 14.Lenzi ML et al. Extreme heterogeneity in the molecular events leading to the establishment of chiasmata during meiosis i in human oocytes. Am. J. Hum. Genet 76, 112–127 (2005). [DOI] [PMC free article] [PubMed] [Google Scholar]
- 15.Perry J, Palmer S, Gabriel A & Ashworth A A short pseudoautosomal region in laboratory mice. Genome Res. 11, 1826–1832 (2001). [DOI] [PMC free article] [PubMed] [Google Scholar]
- 16.Lange J et al. The Landscape of Mouse Meiotic Double-Strand Break Formation, Processing, and Repair. Cell 167, 695–708.e16 (2016). [DOI] [PMC free article] [PubMed] [Google Scholar]
- 17.Kauppi L et al. Numerical constraints and feedback control of double-strand breaks in mouse meiosis. Genes Dev. 27, 873–886 (2013). [DOI] [PMC free article] [PubMed] [Google Scholar]
- 18.Shao Z et al. MAnorm: a robust model for quantitative comparison of ChIP-Seq data sets. Genome Biol. 13, R16 (2012). [DOI] [PMC free article] [PubMed] [Google Scholar]
- 19.Davies B et al. Re-engineering the zinc fingers of PRDM9 reverses hybrid sterility in mice. Nature 530, 171–176 (2016). [DOI] [PMC free article] [PubMed] [Google Scholar]
- 20.Baudat F, Imai Y & de Massy B Meiotic recombination in mammals: localization and regulation. Nat. Rev. Genet 14, 794–806 (2013). [DOI] [PubMed] [Google Scholar]
- 21.Narasimhan VM et al. Health and population effects of rare gene knockouts in adult humans with related parents. Science 352, 474–477 (2016). [DOI] [PMC free article] [PubMed] [Google Scholar]
- 22.Walker M et al. Affinity-seq detects genome-wide PRDM9 binding sites and reveals the impact of prior chromatin modifications on mammalian recombination hotspot usage. Epigenetics Chromatin 8, 31 (2015). [DOI] [PMC free article] [PubMed] [Google Scholar]
- 23.Tease C & Hultén MA Inter-sex variation in synaptonemal complex lengths largely determine the different recombination rates in male and female germ cells. Cytogenet. Genome Res 107, 208–215 (2004). [DOI] [PubMed] [Google Scholar]
- 24.Gruhn JR, Rubio C, Broman KW, Hunt PA & Hassold T Cytological studies of human meiosis: sex-specific differences in recombination originate at, or prior to, establishment of double-strand breaks. PLoS One 8, e85075 (2013). [DOI] [PMC free article] [PubMed] [Google Scholar]
- 25.Liu EY et al. High-resolution sex-specific linkage maps of the mouse reveal polarized distribution of crossovers in male germline. Genetics 197, 91–106 (2014). [DOI] [PMC free article] [PubMed] [Google Scholar]
- 26.Hunt P & Hassold T Female meiosis: coming unglued with age. Curr. Biol 20, R699–702 (2010). [DOI] [PubMed] [Google Scholar]
- 27.de Boer E, Jasin M & Keeney S Local and sex-specific biases in crossover vs. noncrossover outcomes at meiotic recombination hot spots in mice. Genes Dev. 29, 1721–1733 (2015). [DOI] [PMC free article] [PubMed] [Google Scholar]
- 28.de Boer E, Stam P, Dietrich AJJ, Pastink A & Heyting C Two levels of interference in mouse meiotic recombination. Proc. Natl. Acad. Sci. U. S. A 103, 9607–9612 (2006). [DOI] [PMC free article] [PubMed] [Google Scholar]
- 29.Yamada S et al. Genomic and chromatin features shaping meiotic double-strand break formation and repair in mice. Cell Cycle 1–15 (2017). [DOI] [PMC free article] [PubMed] [Google Scholar]
- 30.Seisenberger S et al. The dynamics of genome-wide DNA methylation reprogramming in mouse primordial germ cells. Mol. Cell 48, 849–862 (2012). [DOI] [PMC free article] [PubMed] [Google Scholar]
- 31.Wang H et al. Widespread plasticity in CTCF occupancy linked to DNA methylation. Genome Res. 22, 1680–1688 (2012). [DOI] [PMC free article] [PubMed] [Google Scholar]
- 32.Bourc’his D & Bestor TH Meiotic catastrophe and retrotransposon reactivation in male germ cells lacking Dnmt3L. Nature 431, 96–99 (2004). [DOI] [PubMed] [Google Scholar]
- 33.Vlachogiannis G et al. The Dnmt3L ADD Domain Controls Cytosine Methylation Establishment during Spermatogenesis. Cell Rep. (2015). doi: 10.1016/j.celrep.2015.01.021 [DOI] [PMC free article] [PubMed] [Google Scholar]
- 34.Zamudio N et al. DNA methylation restrains transposons from adopting a chromatin signature permissive for meiotic recombination. Genes Dev. 29, 1256–1270 (2015). [DOI] [PMC free article] [PubMed] [Google Scholar]
- 35.Lister R et al. Human DNA methylomes at base resolution show widespread epigenomic differences. Nature 462, 315–322 (2009). [DOI] [PMC free article] [PubMed] [Google Scholar]
- 36.Collings CK, Waddell PJ & Anderson JN Effects of DNA methylation on nucleosome stability. Nucleic Acids Res. 41, 2918–2931 (2013). [DOI] [PMC free article] [PubMed] [Google Scholar]
- 37.Persikov AV, Osada R & Singh M Predicting DNA recognition by Cys2His2 zinc finger proteins. Bioinformatics 25, 22–29 (2008). [DOI] [PMC free article] [PubMed] [Google Scholar]
- 38.Hammoud SS et al. Chromatin and transcription transitions of mammalian adult germline stem cells and spermatogenesis. Cell Stem Cell 15, 239–253 (2014). [DOI] [PubMed] [Google Scholar]
- 39.Kafer GR et al. 5-Hydroxymethylcytosine Marks Sites of DNA Damage and Promotes Genome Stability. Cell Rep. 14, 1283–1292 (2016). [DOI] [PubMed] [Google Scholar]
- 40.Jain D et al. rahu is a mutant allele of Dnmt3c, encoding a DNA methyltransferase homolog required for meiosis and transposon repression in the mouse male germline. PLoS Genet. 13, e1006964 (2017). [DOI] [PMC free article] [PubMed] [Google Scholar]
- 41.Lin I-H, Chen Y-F & Hsu M-T Correlated 5-Hydroxymethylcytosine (5hmC) and Gene Expression Profiles Underpin Gene and Organ-Specific Epigenetic Regulation in Adult Mouse Brain and Liver. PLoS One 12, e0170779 (2017). [DOI] [PMC free article] [PubMed] [Google Scholar]
- 42.Bonn S et al. Tissue-specific analysis of chromatin state identifies temporal signatures of enhancer activity during embryonic development. Nat. Genet 44, 148–156 (2012). [DOI] [PubMed] [Google Scholar]
- 43.Li H & Durbin R Fast and accurate short read alignment with Burrows-Wheeler transform. Bioinformatics 25, 1754–1760 (2009). [DOI] [PMC free article] [PubMed] [Google Scholar]
- 44.Petukhova GV, Romanienko PJ & Camerini-Otero RD The Hop2 protein has a direct role in promoting interhomolog interactions during mouse meiosis. Dev. Cell 5, 927–936 (2003). [DOI] [PubMed] [Google Scholar]
- 45.Liang K & Keleş S Normalization of ChIP-seq data with control. BMC Bioinformatics 13, 199 (2012). [DOI] [PMC free article] [PubMed] [Google Scholar]
- 46.Zhang Y et al. Model-based analysis of ChIP-Seq (MACS). Genome Biol. 9, R137 (2008). [DOI] [PMC free article] [PubMed] [Google Scholar]
- 47.Teng M & Irizarry RA Accounting for GC-content bias reduces systematic errors and batch effects in ChIP-seq data. Genome Res. (2017). doi: 10.1101/gr.220673.117 [DOI] [PMC free article] [PubMed] [Google Scholar]
- 48.Derrien T et al. Fast computation and applications of genome mappability. PLoS One 7, e30377 (2012). [DOI] [PMC free article] [PubMed] [Google Scholar]
- 49.Krueger F & Andrews SR Bismark: a flexible aligner and methylation caller for Bisulfite-Seq applications. Bioinformatics 27, 1571–1572 (2011). [DOI] [PMC free article] [PubMed] [Google Scholar]
- 50.Kent WJ et al. The human genome browser at UCSC. Genome Res. 12, 996–1006 (2002). [DOI] [PMC free article] [PubMed] [Google Scholar]
- 51.Grant CE, Bailey TL & Noble WS FIMO: scanning for occurrences of a given motif. Bioinformatics 27, 1017–1018 (2011). [DOI] [PMC free article] [PubMed] [Google Scholar]
- 52.Smit AFA, Hubley R & Green P RepeatMasker Home Page. Available at: http://www.repeatmasker.org/. (Accessed: 11th December 2017)
- 53.Oey H, Isbel L, Hickey P, Ebaid B & Whitelaw E Genetic and epigenetic variation among inbred mouse littermates: identification of inter-individual differentially methylated regions. Epigenetics Chromatin 8, 54 (2015). [DOI] [PMC free article] [PubMed] [Google Scholar]
- 54.Dos Santos CO, Dolzhenko E, Hodges E, Smith AD & Hannon GJ An epigenetic memory of pregnancy in the mouse mammary gland. Cell Rep. 11, 1102–1109 (2015). [DOI] [PMC free article] [PubMed] [Google Scholar]
Associated Data
This section collects any data citations, data availability statements, or supplementary materials included in this article.


