Summary
Although the hippocampus is known to be important for declarative memory, how hippocampal output regulates motivated behaviors, such as social aggression, is less well understood. Here we report that hippocampal CA2 pyramidal neurons, which are important for social memory, promote social aggression. This action depends on CA2 output to the lateral septum that is selectively enhanced immediately prior to attack. Activation of lateral septum by CA2 recruits a circuit that disinhibits a subnucleus of the ventro-medial hypothalamus known to trigger attack. The social hormone arginine-vasopressin enhances social aggression by acting on arginine-vasopressin 1b receptors on CA2 presynaptic terminals in lateral septum to facilitate excitatory synaptic transmission. In this manner, release of vasopressin in lateral septum, driven by an animal’s internal state, may serve as a modulatory control that determines whether CA2 activity leads to declarative memory of a social encounter or proceeds to promote motivated social aggression.
Keywords: CA2, lateral septum, social aggression, AVPR1b
Introduction
Considerable progress has been made in characterizing neural circuits underlying social aggression, a classic motivated behavior1,2. However, less is known about how higher brain regions engaged in cognitive processing influence the decision to engage in aggression. Two subcortical regions important for aggression include the ventrolateral subnucleus of the ventromedial hypothalamus (VMHvl)3,4 and the lateral septum (LS)5,6, which contains exclusively GABAergic inhibitory neurons7. Whereas excitation of VMHvl triggers aggression3, inhibitory input to VMHvl from LS suppresses aggression6. As LS receives its most prominent input from the hippocampus8, a region known to play a critical role in declarative learning and memory, we examined if and how hippocampal output to lateral septum may regulate aggressive behavior. Since many animals, including rodents and humans, form complex social hierarchies that influence aggressive behavior9,10, mnemonic information from hippocampus about social identity could impact the decision to engage in aggression. Here we focused on the role of the relatively unexplored CA2 region of the hippocampus11,12 in the control of social aggression. CA2 is of particular interest as it is both important for social memory13,14 and highly enriched in the AVPR1b receptor15, whose activation by the social neuropeptide arginine vasopressin (AVP) promotes aggression16. We here report that CA2 strongly promotes social aggression by acting through a LS—VMHvl disinhibitory circuit that is modulated by AVP, providing an anatomical, functional and behavioral link between canonical circuits for memory and motivated behavior.
Results
CA2 projects to the dorsal LS
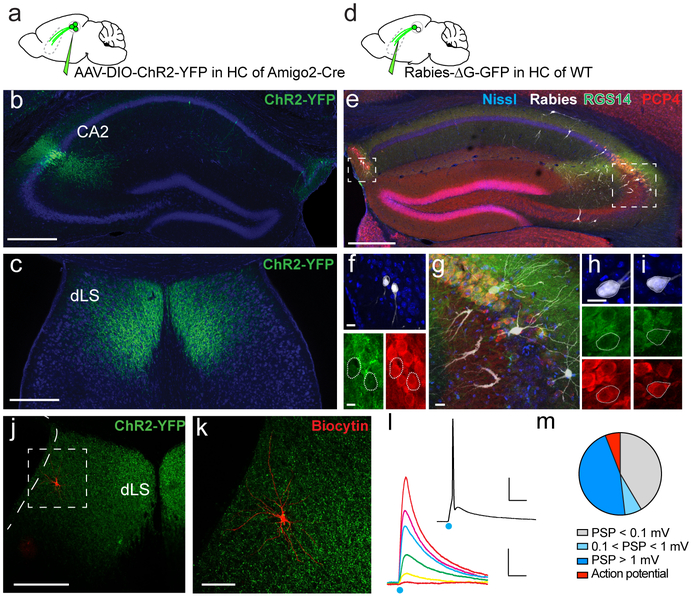
To gain insight into how CA2 may regulate behavior we first examined its extra-hippocampal projections, focusing on dorsal CA2 (dCA2), the area implicated in social memory13,14. We expressed channelrhodopsin2-eYFP (Chr2-eYFP) as an anterograde marker in dCA2 PNs by injecting a Cre-dependent AAV in dCA2 of Amigo2-Cre mice, where Cre expression is largely limited to CA2 PNs13 (Fig. 1a-b). We observed a dense network of CA2 fibers in the dorsal lateral septum (dLS) (Fig. 1c, Extended Data Fig. 1 and Video 1), confirming conventional tracing17. Although CA3 PNs also project to LS8, fibers from mid-CA3 (CA3b) projected to the border of the ventricles and toward ventral lateral septum (vLS), distinct from the site of CA2 projections, which target dLS closer to the midline (although some overlap in projections is apparent; Extended Data Fig 2).
Figure 1: CA2 projections to the lateral septum.
a. Anterograde tracing from dCA2 PNs. b. Coronal hippocampal section from an Amigo2-Cre mouse injected in dCA2 with rAAV5-EF1a-DIO-hChR2(E123T/T159C)-eYFP. c. Coronal section showing dCA2 projections in dLS. d. Monosynaptic retrograde tracing from dLS. e. Coronal hippocampal section of a WT mouse injected in dLS with a G-deleted rabies virus expressing GFP (white), with immunostaining for CA2 markers RGS14 (green) and PCP4 (red). f-i. High-magnifications views of genetically-defined CA2 PNs in Fasciola Cinerea (f) and CA2 proper (h-i) labelled by rabies virus (white) and co-labelled for RGS14 and PCP4. j-k. Coronal LS section of an Amigo2-Cre mouse injected in CA2 with rAAV5-EF1a-DIO-hChR2(E123T/T159C)-eYFP. A dLS cell filled with biocytin (red) during whole-cell recordings is shown at low (j) and high (k) magnification. l. dLS cell current-clamp responses to photoactivation of ChR2-expressing dCA2 inputs with increasing light intensity. Inset shows spiking response of same dLS cell to light. m. Pie-chart of the maximal dLS light-induced PSP amplitude frequency distribution, including fraction of cells where an action potential was elicited (135 dLS neurons). 3 mice injected per experiments in a and d. All mice presented similar staining patterns. Scale bars: b, c, e, j: 400 μm; f, g, h and i: 20 μm; k: 100 μm; l: bottom, 5 mV/20 ms, top, 20 mV/20 ms.
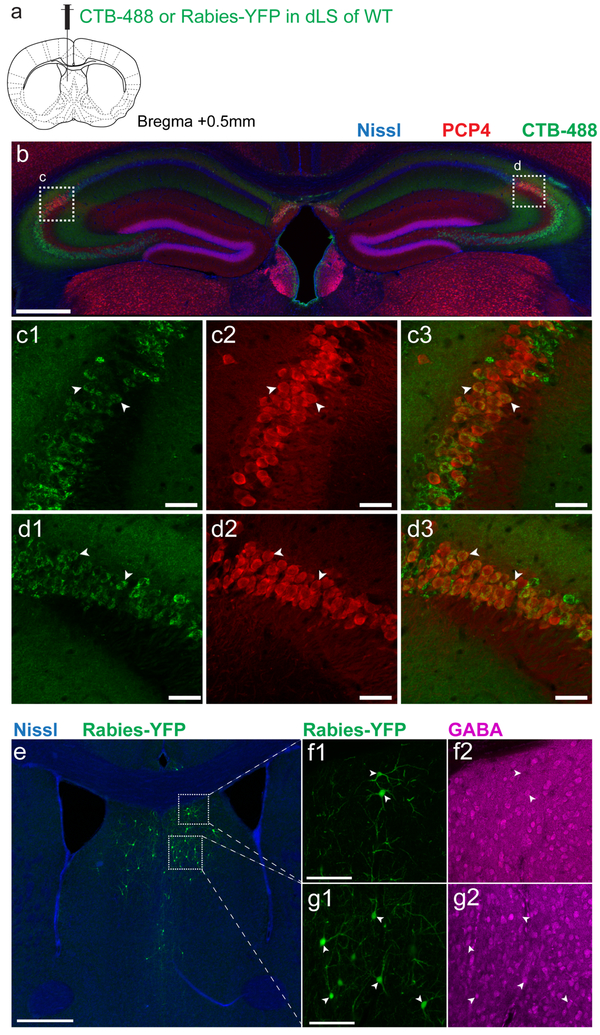
To explore whether dCA2 forms synapses in dLS, we injected a retrograde tracer, cholera toxin beta subunit conjugated to Alexa 488 (CTB-488), into dLS (Extended Data Fig. 3a). Two weeks after injection we observed strong labeling of dCA2 neurons co-labeled with the CA2 PN marker PCP4 (Extended Data Fig. 3b-d). Since CTB can travel retrogradely more than one synapse, we verified the monosynaptic nature of the projection by injecting G-deleted rabies virus expressing GFP in dLS (Fig. 1d). This labeled local dLS neurons near the injection site, consistent with local recurrent inhibition (Extended Data Fig. 4e-g)18,19. In hippocampus, retrogradely labelled cells were found in CA3, CA2, CA1 and in the Fasciola Cinerea (FC), a region in dorsal hippocampus containing molecularly defined CA2 PNs20 (Fig. 1e-i). Both CA2 and FC neurons were co-labeled with antibodies against PCP4 and RGS14 (Fig. 1e-i).
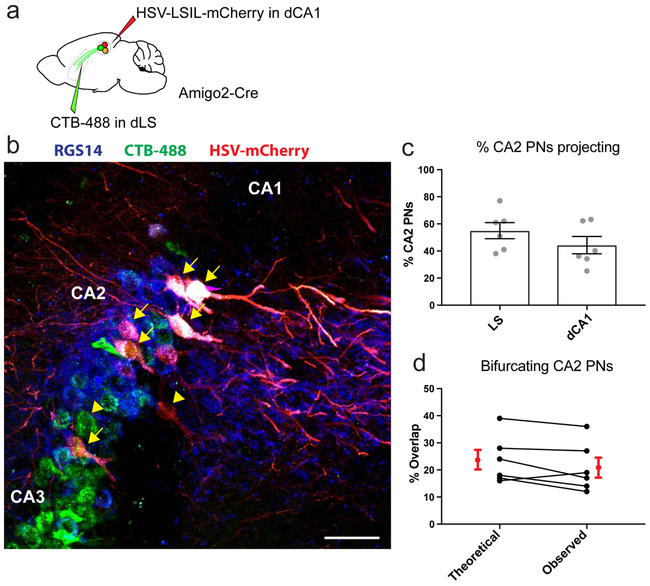
As CA2 also sends a strong projection to dorsal CA1 (dCA1)13,21, we sought to determine the proportion of CA2 PNs that project to both dCA1 and dLS22. We injected CTB-488 in dLS and a monosynaptic retrograde Cre-dependent herpes simplex virus expressing mCherry in dCA1 of Amigo2-Cre mice (Extended Data Fig. 4a). We found that 55±6% of dCA2 PNs were labeled with CTB-488, 44±6% with mCherry, and 21±4% colabeled with both markers (Extended Data Fig. 4b-c). This fraction of doubly-labeled cells was identical to that expected if a single population of randomly labeled CA2 PNs projected both to CA1 and LS (Extended Data Fig. 4d), suggesting that most CA2 PNs project to both areas.
Dorsal CA2 provides strong excitatory drive to dLS targets
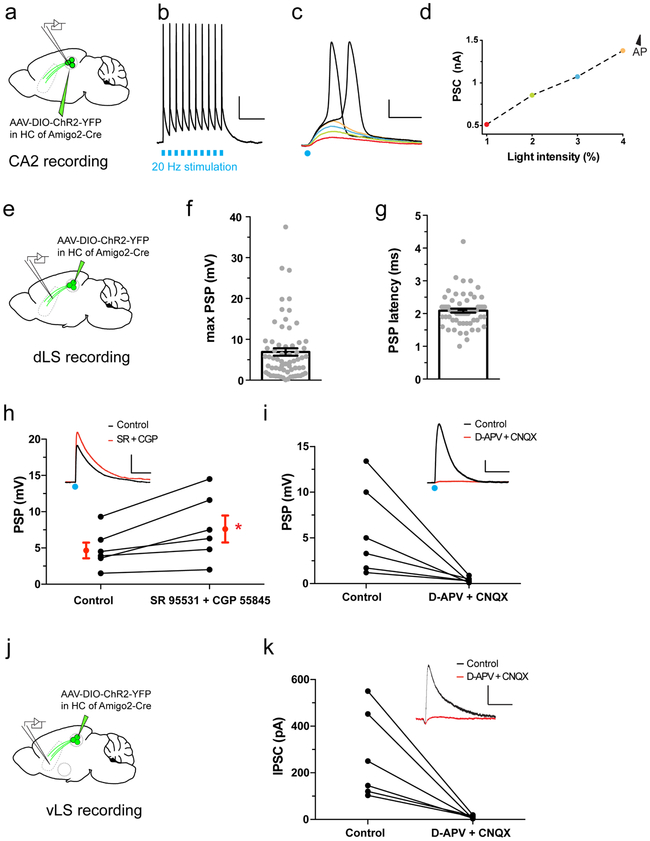
To determine the synaptic influence of dCA2 PNs on dLS, we expressed ChR2-eYFP in dCA2 PNs and measured the electrophysiological responses of dCA2 PNs and dLS neurons to photostimulation using whole cell recordings in acute hippocampal and septal slices, respectively. Most CA2 PNs reliably fired action potentials in response to a single or multiple 1-ms light pulses (Extended Data Fig. 5a-d). Around 50% of dLS cells exhibited a large depolarizing postsynaptic potential (PSP) to a single light pulse (PSP peak=6.9±0.9 mV; Fig. 1j-m and Extended Data Fig. 5e,f) with a short latency (2.1±0.1 ms; Extended Data Fig. 5g). As the PSP is the sum of CA2-evoked synaptic excitation and synaptic inhibition, we isolated the excitatory postsynaptic potential (EPSP) in dLS by applying GABAA and GABAB receptor antagonists. Blockade of inhibition increased the peak amplitude of the PSP by 58±14%, indicating an underlying inhibitory postsynaptic potential (IPSP; Extended Data Fig. 5h). However, even with inhibition intact, a single intense light pulse elicited an action potential in about 12% of dLS cells (Fig. 1m). Subtraction of the EPSP from the net PSP at maximal intensity stimulation yielded an inferred IPSP of −3.0±0.8 mV. Both the EPSP and IPSP were blocked by the AMPA and NMDA receptor antagonists D-APV and CNQX (PSP decreased to 11±4% of baseline; Extended Data Fig 5i), indicating that the IPSP resulted from disynaptic inhibition.
Silencing CA2 and the CA2-LS synapse decreases social aggression
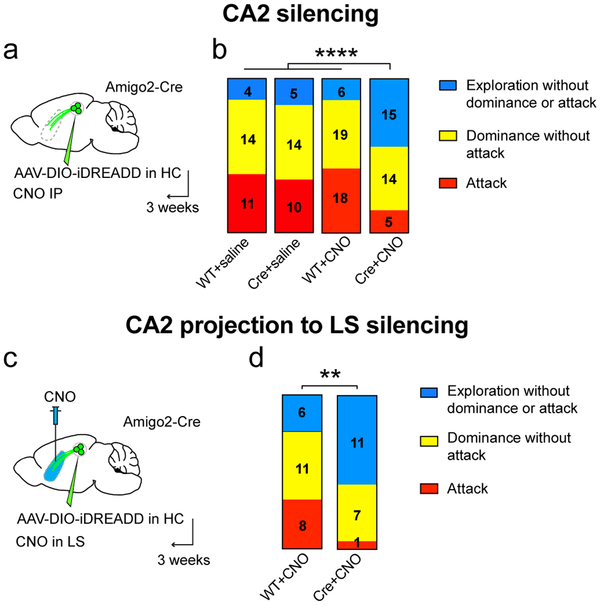
To examine the role of dCA2 and its LS output in aggression, we injected Cre-dependent AAV in dCA2 of Amigo2-Cre mice (and wild-type littermate controls) to express the inhibitory G-protein coupled receptor hM4Di (iDREADD; Fig. 2a)23. After 3 weeks, we performed a resident-intruder test of aggression3,24 by exposing a singly-housed male subject mouse to a BALB/cJ male intruder. Both wild-type and iDREADD-expressing mice were injected with either saline or the iDREADD agonist clozapine-N-oxide (CNO, 10 mg/kg) intraperitoneally 30 min prior to testing.
Figure 2: Silencing of CA2 or the CA2-LS projection inhibits social aggression.
a. Amigo2-Cre (Cre) and WT littermates (WT) were injected in dCA2 with rAAV2-hsyn-DIO-HA-hM4D(Gi)-IRES-mCitrine (AAV-DIO-iDREADD). After 3 weeks, mice were injected intraperitoneally with CNO or saline and, 30 min later, run in the resident-intruder test. b. Bar charts show the number and proportion of mice exhibiting only social exploration (blue), exploration followed by social dominance (yellow) or exploration followed by dominance followed by at least 1 biting attack (aggression, red). X2 tests, **** P<0.0001. c. Silencing dCA2 projections to LS. AAV-DIO-iDREADD was injected in WT and Amigo2-cre mice and CNO infused into dLS 20 min prior to testing. d. Stacked bar charts color-coded as in panel b. X2 test, *P=0.028.
Aggression in the resident-intruder test is characterized by a series of escalating behaviors over time, progressing from non-aggressive social exploration of the intruder (ano-genital and facial sniffing), to social dominance (excessive grooming, chasing and/or mounting of the intruder), to one or more biting attacks, often preceded by tail rattling (Video 2)24–26. The behavior of each resident was categorized by the maximal level of aggressive behavior (social exploration, social dominance or attack) during the 10 min-test period.
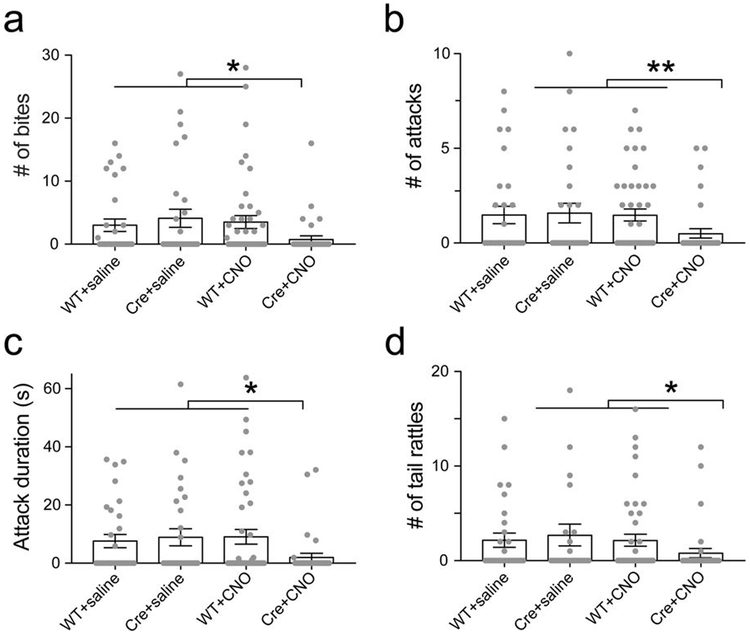
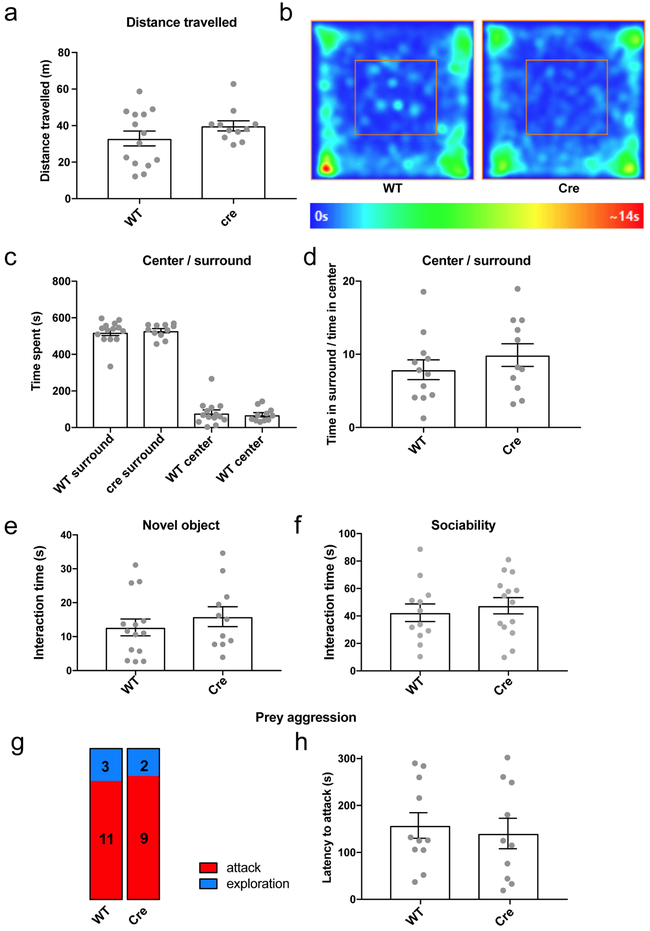
All residents showed an initial period of social exploration, with the majority of residents progressing to social dominance. In three control groups—wild-type mice injected with iDREADD AAV and given CNO (WT+CNO) or saline (WT+saline); Amigo2-Cre mice injected with iDREADD AAV and given saline (Cre+saline)—roughly half the residents escalated their behavior further by engaging in one or more biting attacks. WT+saline and Cre+saline controls showed the same level of aggression (31% compared to 35% of mice engaged in attack, respectively; X2 test, P=0.7), demonstrating that Cre or iDREADD expression did not alter aggression in the absence of CNO. Furthermore, the WT+saline and WT+CNO groups also showed similar levels of aggression, showing that CNO alone had no effect (31% vs. 41%; X2 test, P=0.6). However, silencing of CA2 (Cre+CNO group) caused a marked decrease in aggression compared to controls, with a smaller percentage of animals engaging in attack (15% compared to 36%) and a larger percentage showing only social exploration (44% compared to 15%; Fig. 2b). CA2 silencing also decreased the number of bites, attacks, tail rattles and total attack duration (Extended Data Fig. 6). The decrease in aggression did not result from general behavioral inhibition as CA2 silencing had no effect on locomotion, anxiety, object exploration or sociability (Extended Data Fig. 7a-f, see also ref. 13). Finally, CA2 silencing had no effect on predator-prey aggression, indicating CA2 was selectively required for social aggression (Extended Data Fig. 7g-h).
To determine whether dCA2 promotes aggression through its projections to LS, we expressed iDREADD in dCA2 and used a cannula to deliver CNO to LS (Fig. 2c). We first found that application of CNO (5 μM) to septal slices from mice expressing iDREADD in dCA2 PNs decreased the light-evoked PSP in dLS neurons to 37±7% of baseline (Extended Data Fig. 8a), confirming the efficacy of terminal silencing. Next, we examined the behavioral effect of infusing 1 μl of 1 mM CNO into dLS 20 min prior to the resident-intruder test. As shown in Fig. 2d, this significantly decreased the fraction of mice that engaged in attack (5% of Cre+CNO mice versus 32% of WT+CNO mice) and increased the fraction that showed only social exploration (58% Cre+CNO versus 24% WT+CNO). The proper delivery of CNO in dLS was verified by infusion of miniRuby through the cannula (Extended Data Fig. 8b). Our laboratory recently reported that CNO infusion in ventral hippocampus (vHPC) caused no significant decrease in aggression23. Thus, CNO infusion in LS is unlikely to act by diffusing to the dCA2 region of hippocampus, especially as vHPC is closer to dCA2 than is dLS. Thus, we conclude that dCA2 promotes aggression, at least in part, through its projections to dLS.
dCA2 produces disynaptic inhibition of ventral LS neurons that project to VMHvl
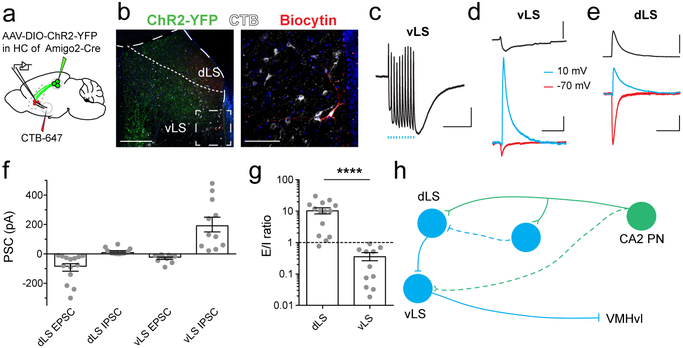
How can the effect of dCA2 to excite LS be reconciled with our results that dCA2 promotes aggression given the known role of LS to inhibit aggression5,6? One clue comes from our finding that dCA2 projects largely to dLS, whereas the projections to VMHvl that inhibit aggression come primarily from vLS6,27. As anatomical results suggest that dLS neurons send inhibitory projections to vLS18,28, we surmised that excitation of dLS neurons by dCA2 may inhibit vLS neurons, including those that tonically inhibit VMHvl, thereby forming a trisynaptic disinhibitory circuit to promote aggression.
To determine whether dCA2 evokes disynaptic inhibition in vLS, we expressed ChR2-YFP in dCA2 PNs and obtained whole-cell recordings from vLS cells in LS slices (Fig. 3a-b). In contrast to the large depolarizing response recorded in dLS (Fig. 1l), photostimulation of dCA2 inputs produced a large hyperpolarization in most vLS neurons (Fig. 3c). Voltage-clamp recordings showed that photostimulation evoked only a weak excitatory postsynaptic current or EPSC (measured with the membrane held at −70 mV) in vLS, which was much smaller than the EPSC evoked in dLS (Fig. 3d-f). In contrast, photostimulation evoked a much larger inhibitory postsynaptic current or IPSC (measured at +10 mV) in vLS compared to dLS (Fig. 3d-f). As a consequence, the EPSC to IPSC ratio in dLS was over 30-fold larger than that in vLS (dLS=10.9±2.4 versus vLS=0.33±0.1; Fig. 3g). The dLS and vLS IPSCs resulted from feed-forward inhibition in response to CA2 activation as the latency of the EPSC was shorter than that of the IPSC (Fig. 3d-e) and the IPSC was almost completely suppressed by CNQX and APV (vLS IPSC decreased to 5.4±1.9%; Extended Data Fig. 5k).
Figure 3: dLS neurons are excited by dCA2 projections and inhibit vLS cells.
a. Amigo2-Cre mice were injected in dCA2 with rAAV5-EF1a-DIO-hChR2(E123T/T159C)-eYFP (AAV-DIO-ChR2-eYFP); a subset was also injected in VMHvl with CTB-647. b. Left, Coronal LS slice from mouse expressing ChR2-eYFP (green) in dCA2 projections. A vLS cell was filled with biocytin (red) during patch-clamp recording. Right, vLS neurons labeled with retrograde tracer CTB-647 (white) injected in VMHvl. c. Current-clamp voltage response of a vLS neuron to photostimulation of ChR2-expressing dCA2 inputs using a 10-pulse train of 1-ms light pulses at 20 Hz. d-e. Synaptic voltage response (top) and EPSC (red) and IPSC (blue) responses (bottom) of a vLS (d) or dLS (e) cell to a single 1-ms light pulse. f. Photoactivated EPSC and IPSC peak amplitudes from dLS and vLS cells. Grey dots: individual cells (14, 14, 11, 11 cells from left to right). Bars: mean ± SEM. g. EPSC/IPSC ratio for dLS and vLS cells (14 and 11 cells from 10 mice). Bars: mean ± SEM. Two-sided Mann-Whitney test, ****P<0.0001. h. Schematic of proposed CA2→dLS⇥vLS⇥VMHvl circuit. Blue, inhibitory LS neurons and synapses. Scale bars: b. left panels: 400 μm, right panels: 100 μm; c. 2 mV/500 ms; d. and e. top, 5 mV; bottom, 40 pA /100 ms.
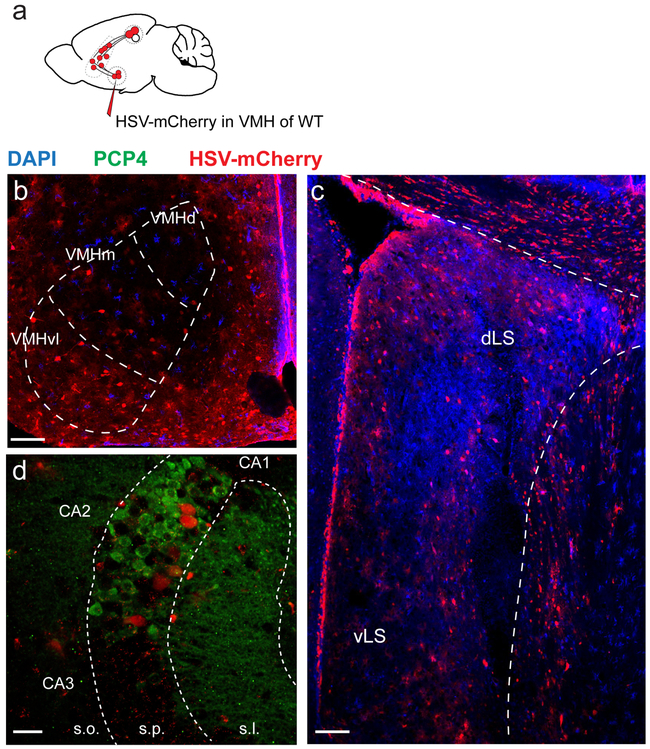
According to the disinhibition hypothesis, dCA2 activation should produce disynaptic inhibition in the subset of vLS neurons that send output to VMHvl (Fig. 3h). To test this idea, we identified vLS projection neurons by injecting the retrograde tracer CTB in VMHvl, which confirmed that vLS forms synapses with this target6,27 (Fig. 3a-b). Whole-cell recordings from visually identified CTB+ vLS cells revealed that their synaptic response to photostimulation of dCA2 inputs was indeed dominated by inhibition (Fig. 3c). We verified a polysynaptic connection from CA2 to VMHvl by injecting into VMHvl a trans-synaptic replication-competent HSV tagged with mCherry that propagates retrogradely through several synaptic contacts29, labeling VMHvl, vLS, dLS and dCA2 (Extended Data Fig. 9a-c).
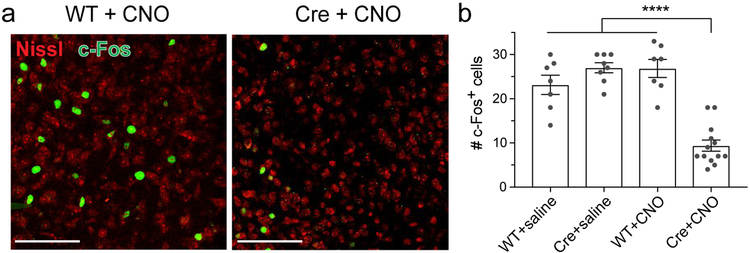
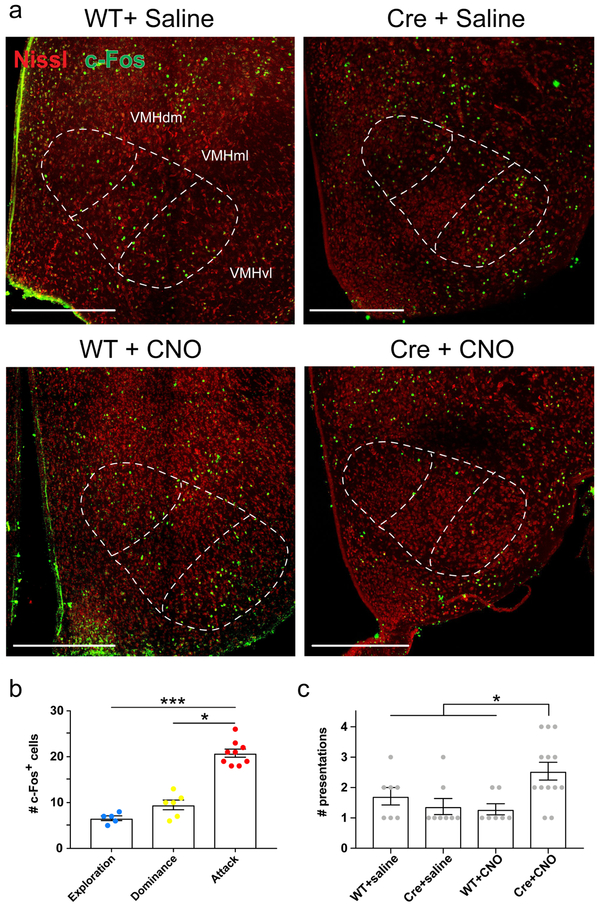
Finally, we explored whether dCA2 output enhances VMHvl activity during aggressive social behavior by measuring the effect of silencing dCA2 on the number of c-Fos labelled cells in VMHvl, a marker of neuronal activity known to be increased by aggression30. After confirming that aggression increased c-Fos labeling in our behavioral paradigm (Extended Data Fig. 10b), we asked whether silencing CA2 affects c-Fos levels. Indeed, injection of CNO caused a significant 2-fold decrease in the number of c-Fos+ cells in the VMHvl of Cre+ mice expressing iDREADD compared to WT mice injected with CNO or two other control groups (Fig. 4 and Extended data Fig. 10a). The decrease in c-Fos labeling upon CA2 silencing was not a secondary effect of the decreased fraction of mice showing aggression as we restricted the c-Fos analysis to the subset of mice that exhibited one or more biting attacks in control and experimental groups (Extended Data Fig. 10c, see Material and Methods). Thus, we conclude that CA2 output normally enhances VMHvl activity during aggression, presumably by activating the LS to VMHvl disinhibitory circuit.
Figure 4: Silencing CA2 with iDREADD expression and CNO injection decreased c-Fos expression in VMHvl.
a. Representative images of c-Fos immunofluorescence in VMHvl following bouts of aggression 30 min after intraperitoneal injection of CNO or saline in WT or Amigo2-Cre mice (all groups previously injected in CA2 with rAAV2-hsyn-DIO-HA-hM4D(Gi)-IRES-mCitrine.) Scale bars, 100 μm. b. Number of c-Fos+ cells in the three control groups (WT+saline, Cre+saline, WT+CNO) and experimental group (Cre+CNO). Grey dots: individual mice (7, 8, 7 and 13 mice from left to right). Bars: mean ± SEM. Two-way ANOVA genotype × drug interaction: F=42.9, ****P<0.0001.
CA2 PN activity and its output to LS increase during social aggression
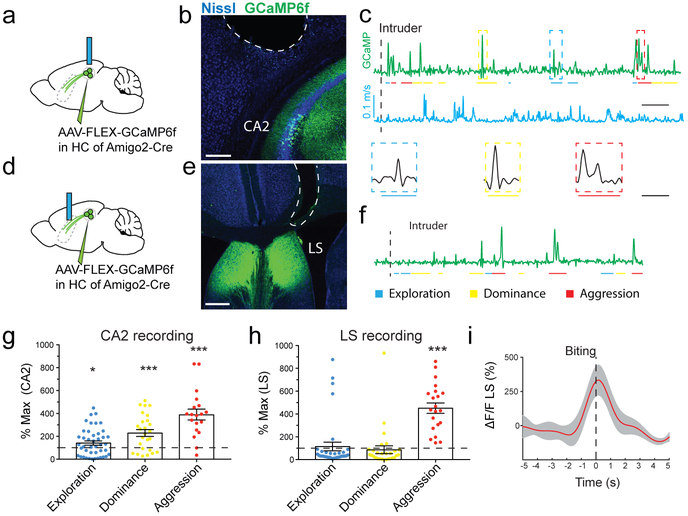
To assess whether CA2 is activated during social exploration and aggression, we injected a Cre-dependent AAV into dCA2 of Amigo2-Cre mice to express the genetically-encoded fluorescent Ca2+ sensor GCaMP6f. We then used fiber-photometry31 to measure intracellular Ca2+ levels based on GCaMP6f fluorescence with a fiber over dCA2 (Fig. 5a-c). We saw little change in GCaMP6f signal in CA2 during non-social exploration or as a function of mouse velocity (Fig. 5c, Extended Data Fig. 11a). However, episodes of social exploration elicited a small but significant increase in GCaMP6f peak fluorescence to 147±19% of baseline (Fig. 5c,g). Episodes of social dominance were associated with an even greater increase in Ca2+ to 234±31% of baseline (Fig. 5c,g), significantly greater than during social exploration (two-sided t-test, P=0.01). Ca2+ levels increased even further during aggression (biting attack) to 394±47% of baseline (Fig. 5c,g), significantly greater than during social dominance (two-sided t-test, P=0.005). Analysis of the mean GCaMP6f signal (rather than the peak) during the behavioral episodes yielded similar results (Extended Data Fig. 11b).
Figure 5: CA2 PNs respond to diverse social encounters whereas CA2 terminals in LS convey selectively aggression-related information.
a. Schematic of fiber-photometry recordings of GCaMP6f fluorescence signals from CA2 PNs in the hippocampus (4 mice). b. Coronal section of the hippocampus showing the expression of GCaMP6f and optical fiber location. c. Example recording of GCaMP6f signal (green) with fiber over CA2 during resident-intruder test. Mouse velocity shown in blue. Colored bars define episodes of social exploration (blue), social dominance (yellow) and biting attack (red). d. Schematic of GCaMP6f recordings with fiber over dLS (5 mice). e. Coronal section of LS showing expression of GCaMP6f and fiber location. f. Example recording of GCaMP6f signals from CA2 PN projections in dLS during resident-intruder test. g. Plot of CA2 peak GCaMP6f signals during behaviors. Each point is from a single behavioral episode (43, 26 and 19 episodes left to right, 5 mice). Bars: mean ± SEM. One-sample two-sided t-tests against baseline (from left to right): *P=0.02, ***P=0.0002, ****P<0.0001. h. Same as g. but recorded from dLS (34, 28 and 21 episodes from left to right, 6 mice), ****P<0.0001. i. Mean GCaMP6f signal (red line: mean, grey area: ± SEM) in dLS aligned to onset of biting and normalized to baseline (21 attack episodes). Scale bars: b 200 μm; e 400 μm; c,f 50s; enlarged episodes in c 10s.
Next, we examined whether CA2 input to LS was also regulated during social interactions by expressing GCaMP6f in CA2 PNs with the fiber positioned over dLS (Fig. 5d-f). We observed a large increase in the peak GCaMP6f signal during aggression (456±46%; Fig. 5f,h), similar to dCA2. However, unlike in dCA2, the increase in Ca2+ in dCA2 projections to dLS was highly selective for social aggression, with no significant change during social exploration (one-sample t-test, P=0.6) or social dominance (one-sample t-test, P=0.8). Analysis of mean GCaMP6f signals yielded similar results (Extended Data Fig. 11c). The increase in Ca2+ preceded bite onset by 1-2s (Fig. 5i), suggesting that dCA2 output to dLS contributes to attack.
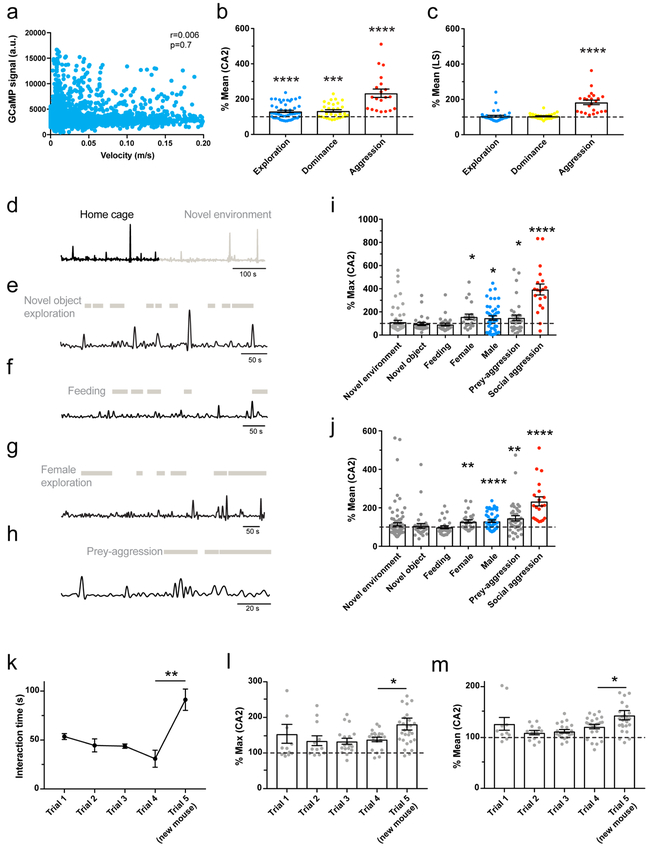
In contrast to the large increase in dCA2 activity during social aggression, there was no significant change in Ca2+ levels during exploration of a novel object, novel environment or during feeding. (Extended Data Fig. 11d-j). There was a small but significant increase in dCA2 GCaMP6f signal during exploration of a novel female (147±24%) and during predator-prey aggression (150±24%) similar to the responses during exploration of a male. However, both female exploration and the prey-aggression responses were significantly less than those during social aggression (two-sided t-tests, P<0.0001; Extended Data Fig. 11i,j). The Ca2+ responses to a novel female had a tendency to decline with repeated exposure and increased when a new animal was introduced (Extended Data Fig. 11k-m), suggesting that CA2 may encode social novelty, a factor known to promote aggression32,33.
CA2 presynaptic AVPR1b potentiates synaptic transmission to LS and enhances aggression
As CA2 activity is required for both social memory acquired during non-aggressive social exploration and for social aggression, downstream circuits must differentiate when CA2 output should trigger aggression. Because aggression is regulated by an animal’s internal state1, we hypothesized that the social neuropeptide AVP may provide a state-dependent modulatory signal to enhance the ability of CA2 activity to trigger attack.
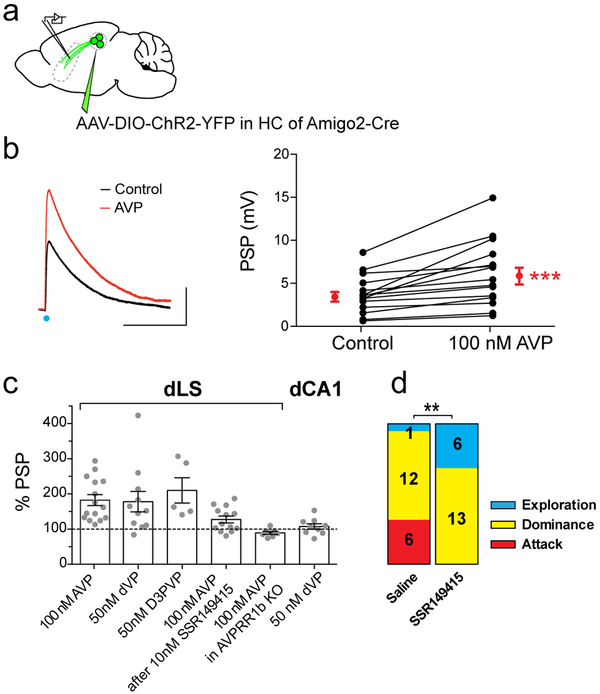
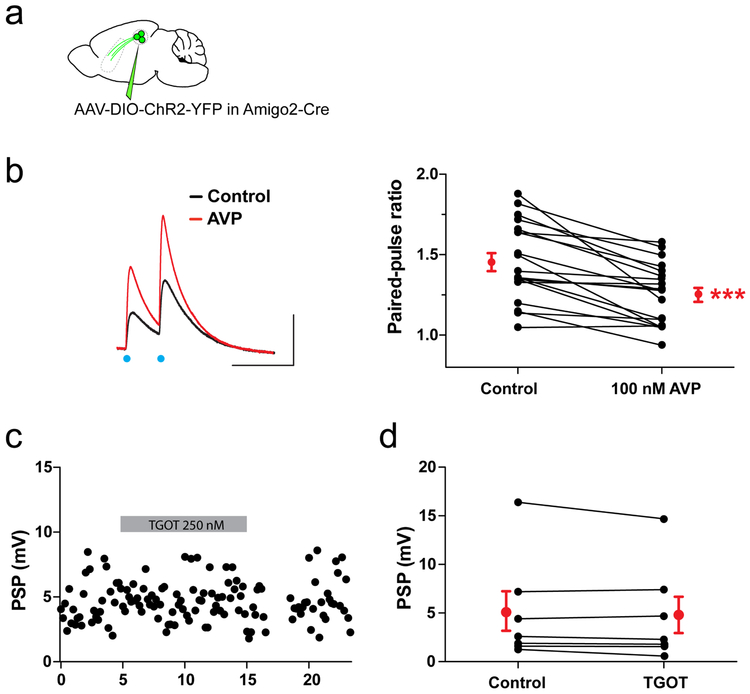
To test this idea, we first explored whether AVP alters synaptic transmission between dCA2 and dLS by expressing ChR2 in dCA2 PNs and recording light-evoked PSPs in dLS neurons (Fig. 6a). Bath application of 100 nM AVP produced an 82±15% increase in the peak PSP (Fig. 6b), accompanied by a decrease in the PSP paired-pulse ratio to 87±2% of its initial value (Extended Data Fig. 12a-c). This indicates that AVP acts presynaptically to enhance transmitter release from dCA2 inputs.
Figure 6: AVPR1b activation on CA2 presynaptic terminals in LS potentiates synaptic excitation and increases social aggression.
a. AAV injection for ChR2 expression in dCA2. b. PSPs recorded from dLS neuron in response to photostimulation of ChR2-expressing dCA2 inputs before and 15 min after bath application of 100 nM AVP (15 cells). Black dots: individual cells. Red dots: mean ± SEM. Two-sided Wilcoxon test, ****P<0.0001. c. PSP amplitudes in LS neurons as percent of initial PSP after application of: 100 nM AVP, 50 nM [dLeu4,Lys8]-AVP (dVP), 50 nM D3PVP, 100 nM AVP in presence of 10 nM SSR149415, 100 nM AVP in an AVPR1b-KO mouse (15, 11, 5, 13, 7, 6 cells). Bar on right, effect of 50 nM dVP on CA1 PN PSP evoked by photostimulation of CA2 inputs (9 cells). Bar graphs show mean ± SEM. d. Stacked bar charts representing fraction of mice exhibiting: only social exploration (blue), exploration followed by dominance (yellow) or exploration, dominance and biting attack (red). Mice were infused with saline or SSR149415 into dLS prior to resident-intruder test. 19 mice per groups. X2 test, **P=0.008.
As CA2 PNs express AVPR1b15 but not AVPR1a34, which is expressed in LS neurons19, we tested the effects of two AVPR1b-selective agonists (50 nM dVP or 50 nM D3PVP). Both compounds potentiated the PSP to the same extent as AVP (178±29% for dVP and 210±36% for D3PVP; Fig. 6c). Furthermore, the effect of AVP was reduced by AVPR1b-specific antagonist SSR14941535 (PSP=121±10% of baseline; two-sided Mann-Whitney test compared to AVP alone, P=0.01; Fig 6c) and eliminated by genetic deletion of AVPR1b (PSP=89±4% of baseline; two-sided Mann-Whitney test compared to AVP application in WT, P<0.0001; Fig. 6c). Although AVP can activate oxytocin receptors, the oxytocin agonist TGOT (250 nM) did not alter the PSP (PSP=97±3% of baseline; Extended Data Fig. 12c-d). Surprisingly, AVP did not alter the PSP recorded in dCA1 PNs in response to photoactivation of dCA2 inputs (PSP=107±8% of baseline; two-sided Mann-Whitney test compared to AVP response in dLS, P=0.0002; Fig. 6c), suggesting that any AVPR1b expressed in dCA2 terminals in dCA1 cannot regulate transmitter release.
Finally, we tested the behavioral importance of AVPR1b on dCA2 terminals in dLS by infusing either saline or SSR149415 through a dLS cannula (Fig. 6d). The AVPR1b antagonist decreased the fraction of mice displaying aggression (from 32% to 0%) and increased the fraction displaying only social exploration (from 5% to 32%), suggesting that AVPR1b in dCA2 terminals in dLS may act as a state-dependent regulator of social aggression36.
Discussion
In concert with previous results, our data indicate that dCA2 PNs are required both for social memory13,14,34 and to promote social aggression16. Our laboratory recently found that the mnemonic function of dCA2 is mediated by its projections to ventral CA123 (Extended Data Fig. 1c), another hippocampal region implicated in social memory37. Here we demonstrate that dCA2 promotes aggression through its output to dLS, which activates a circuit that disinhibits the VMHvl hypothalamic subnucleus implicated in aggression. Thus, our findings provide a link, at both the behavioral and circuit levels, that connects the hippocampus, a brain region noted for its role in declarative memory, with the control of a motivated behavior and its hypothalamic trigger.
How might mnemonic information provided by CA2 participate in regulating aggressive behavior? It is likely that a decision to engage in social attack requires evaluation of past social encounters that may predict the potential outcome of aggression. This information may also consist of a determination of social novelty as aggression is triggered more readily by a novel compared to a familiar intruder32,33.
Why do dCA2 social signals, which are generated during both non-aggressive and aggressive social encounters, only trigger aggression under certain circumstances? For example, aggression is observed routinely when a socially isolated male encounters a novel adult male but rarely during encounters with a novel juvenile male or a novel female, both of which activate CA2 (Fig. 5 and Extended Data Fig. 11). As most CA2 neurons project to both CA1 and dLS, it is unlikely that there are separate CA2 subpopulations activated for memory versus aggression. Rather, the social signal conveyed by dCA2 to dLS may be modulated by the internal state of an animal through release of the social neuropeptide AVP to facilitate information transfer from dCA2 to dLS. As other hippocampal regions, notably dCA3, also project extensively to dLS8, future studies will be needed to explore the relative roles of the different hippocampal regions in social behavior.
Methods
Further information and requests for reagents may be directed to and will be fulfilled by the corresponding authors, Dr. Steven A. Siegelbaum (sas8@columbia.edu) or Dr. Félix Leroy (felxfel@aol.com).
Experimental models
All mouse procedures were performed in accordance with the regulations of the Columbia University IACUC. We used the following mouse lines: Amigo2-Cre mice and their WT− littermates13, Grik4-Cre38 and AVPR1b-K0 mice39 crossed with Amigo2-cre mice (heterozygous for cre and homozygous for AVPR1b-K0), all on the C57Bl/6J background. For the social aggression tests, we used BALB/cJ intruders3,16,39. Tracing and in vitro recordings were performed on male and female mice. We observed no difference related to the sex and the results were pooled together. Behavior was performed on sexually naïve male mice only. All mice were maintained on a 12-hour light/dark cycle with ad libitum access to food and water. We used mice between 2-6 months old. No statistical methods were used to predetermine sample size, but sample sizes are consistent with those generally employed in the field. Animals were randomly assigned numbers and tested blind for the experimental conditions. All behavioral experiments were scored by an individual blind to the genotype and experimental design.
Surgeries
Viral injections
For all injections, mice were anesthetized using isoflurane and given analgesics. A craniotomy was performed above the target region and a glass pipette was stereotaxically lowered to the desired depth. All coordinates are in mm with the Bregma as reference. Injections were performed using a nano-inject II (Drummond Scientific). 23 nl were delivered 15 s apart until total amount was reached. The pipette was retracted after 5 min.
Hippocampal injections
We injected bilaterally 200 nl of the following viruses: rAAV5-EF1a-DIO-hChR2(E123T/T159C)-eYFP40 (UNC, lot AV4828b), rAAVDJ-hSyn-FLEX-mGFP-2A-Synatophysin-mRuby (Sanford viral core, #GVVC-AAV-100, lot 1930), rAAV5-hsyn-DIO-eGFP (UNC, #4497), rAAV2-hsyn-DIO-HA-hM4D(Gi)-IRES-mCitrine41 (Addgene, #50455 prepared by the Duke University vector core) and rAAV1-syn-FLEX-GCaMP6f-WPRE-SV4042 (Addgene, #100833-AAV1) into the hippocampus of Amigo2-Cre or Grik4-Cre mice. Injection coordinates were the following): AP 2, ML ±1.8, DV −1.7. Incubation time was 3 weeks for immunohistochemistry or electrophysiological recording and 4 weeks for behavior. Injection of rAAV5-EF1a-DIO-hChR2(E123T/T159C)-eYFP led to selective expression of ChR2-eYFP in 80 ± 3% (18 mice) of all CA2 PNs in the dorsal half of hippocampus.
Retrograde tracings from the LS
We injected bilaterally 200 nl of G-deleted rabies43 SAD-B19-∆G.mCherry (Salk Institute) or CTB conjugated to Alexa-488 (ThermoFisher Scientific, #C22841) into the dLS at the following coordinates: AP +0.3, ML ±0.1, DV −2.5.
Dual retrograde virus injection into LS and CA1
We injected 100 nl of the Cre-dependent retrograde monosynaptic herpes simplex viruses EF1a-LSIL-mCherry (MIT McGovern Institute vector core, cat# RN413) and 400 nl of Ctb conjugated to Alexa-488 (ThermoFisher Scientific, #C22841) into dCA1 and dLS respectively. dCA1 injection coordinate were the following: AP −2, ML ±1.4, DV −1.7. dLS coordinates were the same as above. 1 week later, mice were perfused and processed for mCherry and RGS14 labelling.
Retrograde tracing from the VMHvl
400 nl of the trans-synaptic herpes simplex virus CMV-mCherry (CNNV, #HSC373) or CTB-647 (ThermoFisher Scientific, #C34778) was injected into the dLS at the following coordinates: AP −1.7, ML ±0.68, DV 5.8.
Cannula guide implantation
Mice were implanted with a cannula guide extending for 2.4 mm below the pedestal (Plastics One, #C315G 2-G11-SPC). The scalp was removed and scored before holes were drilled (AP +0.3, ML ±0). Cannula guides were kept in place using super-glue. The skull was then covered with dental cement (GC FujiCEM 2) and dummy cannulas (Plastics One, #C315DC-SPC,) were inserted into the guides. Mice were returned to their home cage and left to recover for at least 1 week.
Optical ferrule implantation
We expressed the Ca2+ sensor selectively in dCA2 PNs using Cre-dependent rAAV injections in Amigo2-Cre mice42 before implanting a 400-μm optic fiber, either above the dCA2 injection site in the hippocampus (4 mice, Fig. 5a-b) or over the site of dCA2 projections in dLS (5 mice, Fig. 5d-e). Mice were implanted with an optical ferrule extending for 2 mm below the pedestal for LS and 1.5 mm below the pedestal for HC (Doric Lenses). The scalp was removed and scored before a hole was drilled (AP +0.3, ML ±0 for LS and AP −2, ML +2). Ferrules were kept in place using super-glue. The skull was then covered with dental cement (GC FujiCEM 2). Mice were returned to their home cage and left to recover for at least 1 week.
Immunohistochemistry
Mice were transcardially perfused using saline then 4% PFA in PBS. The brains were quickly extracted and incubated in 4% PFA overnight. After 1 h washing in 0.3% glycine in PBS, 60 μm sections were prepared using a Leica VT1000S vibratome. After fixation, sections were permeabilized and blocked for 2 h with 5% goat-serum and 0.5% Triton-X in PBS at room temperature (RT). Unless indicated otherwise, sections were incubated overnight with primary antibodies at 4 °C diluted in 5% goat-serum and 0.1% Triton-X in PBS. The sections were washed 3 times 15 min in PBS and secondary antibodies were applied at RT for 3 h in in 5% goat-serum and 0.1% Triton-X in PBS. All secondary antibodies were produced in the goat, purchased from ThermoFisher Scientific and diluted at 1:500. DAPI (ThermoFisher Scientific, #D1306) staining was applied at 1:1000 for 10 min in PBS at RT prior to mounting the section using fluoromount (Sigma-Aldricht). Images were acquired using an inverted confocal microscope (Leica, LSM 700).
For GFP and rabies-mCherry labelling, the first incubation was performed with chicken anti-GFP (1:1000, AVES Labs, #GFP-1020, RRID:AB_10000240) and rabbit anti-RFP (1:500, Rockland, #600-401-379). Secondary incubation was performed with anti-chicken conjugated to Alexa 488 (#A11039, RRID:AB_142924) and anti-rabbit conjugated to Alexa 568 (#A11011, RRID:AB_143157).
For PCP4, mCherry and RGS14 labelling, the first incubation was performed with mouse IgG2a anti-RGS14 (1:50, UC Davis/NIH NeuroMab Facility, #73-170, RRID:AB_10698026) and rabbit anti-PCP4 (1:200, Sigma-Aldrich, #HPA005792, RRID:AB_1855086). Secondary incubation was performed with anti-mouse IgG2a conjugated to Alexa 488 (#A21131, RRID:AB_2535771) and anti-rabbit conjugated to Alexa 633 (#A21070, RRID:AB_2535731). We did not stain for the endogenous mCherry signal. For Nissl, CTB-488 and PCP4 labelling, the first incubation was performed with rabbit anti-PCP4 (1:200, Sigma-Aldrich, Cat# HPA005792 RRID:AB_1855086). Secondary incubation was performed with Neurotrace 435/455 (Nissl, 1:200, #N21479, RRID:AB_2572212) and anti-rabbit conjugated to Alexa 568 (#A11011).
For Nissl, GABA and rabies-mCherry labelling, the first incubation was performed with guinea-pig anti-GABA (1:50, Abcam #ab17413). Secondary incubation was performed with Neurotrace 435/455 (Nissl, 1:200, #N21479) and anti-guinea-pig conjugated to Alexa 568 (#A11075, RRID:AB_141954).
For Nissl and c-Fos labelling, the first incubation was performed with rabbit anti-c-Fos (1:2000, Santa Cruz, #sc52, RRID:AB_2106783) during 4 days at 4°C. Secondary incubation was performed with Neurotrace 640/660 (Nissl, 1:200, #N21483, RRID:AB_2572212) and anti-rabbit conjugated to Alexa 488 (#A11008, RRID:AB_143165).
For mCitrine and miniRuby labelling, first incubation was performed with chicken anti-GFP (1:1000, AVES Labs, #GFP-1020). Secondary incubation was performed with anti-chicken conjugated to Alexa 488 (1:500, Thermo Fisher Scientific, Cat# A11039 RRID:AB_142924).
For post-hoc immunocytochemistry after patch-clamp recordings, slices were fixed for 1 h in 4% PFA in PBS. The procedure was the same as described above. Streptavidin conjugated to Alexa 647 (1:500, ThermoFisher Scientific, #S21374, RRID:AB_2336066) and the primary antibody anti-GFP conjugated to Alexa-488 (1:500, ThermoFisher Scientific, #A21311, RRID:AB_221477) were applied overnight at 4 °C following blocking and permeabilization.
iDISCO brain
Brains were processed as described by Renier et al.44. We used the primary antibody chicken anti-GFP (1:2000, AVES Labs, #GFP-1020) for 7 days then the secondary antibody donkey anti-chicken conjugated to Alexa-647 (1:2000, ThermoFisher Scientific, #A21447, RRID: AB_2535864) for 7 days as well. Imaging was performed using the UltraMicroscope II light-sheet microscope (LaVision). 3-D reconstruction was done using the Imaris software (Bitplane).
Electrophysiology
Slice preparation
For LS recordings, mice were killed under isoflurane anesthesia by perfusion into the right ventricle of an ice-cold solution containing the following (in mM): 10 NaCl, 195 sucrose, 2.5 KCl, 10 glucose, 25 NaHCO3, 1.25 NaH2PO4, 7 Na Pyruvate, 1.25 CaCl2, and 0.5 MgCl2. The skull was placed in the same ice-cold medium, the brain was removed carefully from the skull and the cerebellum cut. The brain was then glued upright with the dorsal side facing the blade and a small block of 4% agar was placed against the ventral side for mechanical stabilization. 400-μm coronal slices were prepared with a vibratome (VT1200S, Leica) in the same ice-cold dissection solution. Brain slices were then transferred to a chamber containing 50% dissecting solution and 50% ACSF (in mM: 125 NaCl, 2.5 KCl, 22.5 glucose, 25 NaHCO3, 1.25 NaH2PO4, 3 Na Pyruvate, 1 Ascorbic acid, 2 CaCl2 and 1 MgCl2). The chamber was kept at 34°C for 30 min and then at room temperature for at least 1 h before recording. All experiments were performed at 33 °C. Dissecting and recording solutions were both saturated with 95% O2 and 5% CO2, pH 7.4. For CA2 and CA1 PNs recordings, transverse hippocampal slices were prepared as described in Leroy et al.45.
Electrophysiological recordings
Slices were mounted in the recording chamber under a microscope. Recordings were acquired using a Multiclamp 700A amplifier (Molecular Device), data acquisition interface ITC-18 (Instrutech) and the Axograph X software. Whole-cell current-clamp recordings were obtained from LS cells with a patch pipette (4–5 MΩ) containing the following (in mM): 135 K methylsulfate, 5 KCl, 0.2 EGTA-Na, 10 HEPES, 2 NaCl, 5 ATP, 0.4 GTP, 10 phosphocreatine, and 5 μM biocytin, pH 7.2 (280–290 mOsm). The liquid junction potential was 1.2 mV and was not corrected. Voltage-clamp recordings were performed with an intracellular solution containing 135 Cs methylsulfate instead of K methylsulfate. Series resistance (15–25 MΩ) was monitored throughout each experiment; cells with a >20% change in series resistance were discarded. For light stimulation, pulses of blue light (pE-100, Cool LED) were delivered through a 40x immersion objective and illuminated an area of 0.2 mm2. The illumination field was centered over the recorded cell. In a subset of experiments, the following drugs were used at the following concentrations via bath application (all drugs from Tocris unless indicated otherwise): SR 95531 (1 μM, #1262), CGP 55845 (2 μM, #1248), D-APV (50 μM, #0106), CNQX (20 μM, #1045), AVP ([Arg8]-Vasopressin, 100 nM, #2935), dVP ([dLeu4,Lys8]-Avp, 50 nM, #3127), D3PVP ([deamino-Cys1, D-3-(pyridyl)-Ala2, Arg8-Avp], 50 nM, Sigma-Aldrich #V2257), SSR149415 (10 nM, Axon Medchem #1114), T-GOT ([Thr4,Gly7]-Oxt, 250 nM, Sigma-Aldrich #O6380) and CNO (5 μM, #4936). Drugs were bath applied following dilution into the external solution from stock solutions.
Data analysis for electrophysiology
A baseline recording was acquired for 10 min and then drug was applied for 15 min before measuring the effect of the drug for another 10 min. We used Axograph X software for data acquisition, and Excel (Microsoft) and PRISM (Graphpad) for data and statistical analysis. Wilcoxon or Mann-Whitney tests were performed with PRISM for statistical non-parametric comparisons of paired or non-paired data respectively. Results presented in the text and figures are reported as the mean ± S.E.M.
Behavior
Social Aggression
Amigo2-Cre and their WT litter mate mice were injected with rAAV expressing iDREADD and then for some implanted with cannula guides 3 weeks later (see surgeries section above). After one week of recovery the mice were singly-housed for one week before being run in the social aggression test.
The resident-intruder paradigm was used to assess social aggression as previously described3,24,39. Subject male mice (residents) were individually housed for a minimum of 1 week, with a cage change no less than 1 week prior to the encounter with a novel intruder. Stimulus mice (male BALB/cJ intruders) were grouped housed and used for only a single encounter per day. No intruder was used for more than three aggressive episodes. Experiments began at the start of the dark cycle. Feeding and water apparatuses were removed before habituation to allow unimpeded interaction and better recording. Ten min presentations of age- and weight-matched intruders occurred in the home cages of the resident mice after one-hour habituation to the behavioral room. In accordance with Columbia IACUC rules, attack was allowed to continue 2 min after its onset, which was defined by a bite. On the rare occasion that a stimulus mouse attacked the resident, the trial was halted and this intruder excluded from the study. To increase the occurrences of aggression to enable us to quantify relevant parameters for each group, subjects were presented with up to 3 intruders, one each on 3 consecutive days. Once a subject displayed attack it was infused with miniRuby to control for the location of the drug delivery and processed for immunohistochemistry.
For intraperitoneal injection, mice were injected with CNO (10 mg/kg in saline) or vehicle (saline) 30 min before testing. For LS infusion, mice were placed under light isoflurane anesthesia (2%) and the dummy cannula was removed. A cannula (Plastics One, #C315I-SPC) projecting 1.2 mm from the tip of the cannula guide was mounted. One μl of a 1 mM CNO solution (Fig. 2d), 1 μL of a 2 μM SSR149415 solution or 1 μL of saline (Fig. 6d) was infused over 5 min using a syringe pusher (Fusion 200, Chemix Inc.) mounted with a 2 μl syringe (Hamilton, #88511). The cannula was removed 2 min after the end of the micro-infusion to avoid pulling out the drug when removing the cannulas. Mice typically recovered fully from the light anesthesia within 5 min. Mice were returned to their home cage 20 min before the test began and fully recovered within 5 min. All encounters were recorded under red-light and sound-attenuated conditions with a SONY camera for later ethological analysis using the ANY-maze software (Stoelting Company).
Ethological analysis of aggression was performed by a blind observer in the 2 minutes following the first biting attack. We measured: (1) the duration of attack within two minutes of the initial aggression, (2) the number of bites, (3) the number of tail rattles, (4) and the number of aggressive bouts. Operational definitions for these behaviors are defined as follows: the initiation of attack is defined by the first clear bite initiated by the resident mouse, not including mounting, excessive grooming, and pursuing behavior. The duration of attack includes biting, pursuing, mounting, and excessive grooming behavior. Attack bouts are cycles of initiated attack with continuous orientation and physical interaction by the resident towards the intruder. They are defined as completed when the resident has physically reoriented away from the intruder. The initiation of social dominance excludes biting and is defined as mounting behavior or persistent face allo-grooming. Chi-square (X2) tests were performed to evaluate the statistical significance of differences in occurrences of the different behaviors. To analyze the data presented in Figure 2b, we first performed X2 tests between the 3 control groups before pooling the control data and performing a X2 test between it and the test group (Cre+CNO). In a similar fashion, we used Mann-Whitney tests to analyze the data presented in Extended data Fig. 6 by comparing first the control groups and then pooling control groups to compare them against the test group.
c-Fos experiment: behavioral paradigm
We injected saline or CNO in both Amigo2-Cre mice expressing iDREADD in dCA2 and WT littermates 30 min prior to performing the resident-intruder test. Any mouse that showed a biting attack was sacrificed 1 hour after the end of the 10-min test. We restricted our analysis to mice that showed aggression to rule out the possibility that any decrease in c-Fos expression upon silencing dCA2 could be a simple consequence of the behavioral effect of decreased aggression, rather than a result of a direct influence that silencing the dCA2 to LS pathway may have to decrease VMHvl activity. Because only a fraction of resident mice displayed aggression, we used the following protocol to obtain sufficient mice for analysis. Any resident that did not attack its intruder was returned it to its home cage, and then tested in the resident-intruder paradigm again 5 days later, until the resident performed an attack, at which point it was sacrificed for inclusion. Because CA2 silencing in Cre+CNO mice led to a decrease in the fraction of mice that displayed aggression in any one test (Fig. 2), these mice had to be run in more resident-intruder tests than mice in the three control groups before an attack was observed (Extended Data Fig. 10c). However, we found that repeated tests separated by a 5-day interval did not alter levels of aggression in control mice (33% in first test versus 35% in second test), suggesting that there were no cumulative behavioral effects of the repeated testing (as long as a 5-day inter-test interval was used).
Data analysis for c-Fos+ cell counting in the VMHvl
For each mouse, we selected randomly 2 non-consecutive 60-μm thick coronal sections between 1.4 and 1.9 mm from Bregma along the rostral-caudal axis and stained them for c-Fos and Nissl. High-resolution 16 μm-stacks of the hypothalamus were acquired and projected along the z-axis using a LSM 700 confocal microscope (Zeiss). We identified the VMH based on Nissl staining and hypothalamic hallmarks (fornix, third ventricle). Additionally, we performed VGlut2 immunostaining on a limited number of slices from WT mice to confirm the location of the VMH3. We identified the VMHvl subnucleus as consisting of the ventral third of the VMH, and manually counted c-Fos+ cells in this region, making sure they co-localized with Nissl staining. We verified that the total surface analyzed was similar between mice. Results were averaged across bilateral regions and sections for each mouse.
Novel environment and novel object exploration
Isolated Amigo2-Cre and their WT littermate mice previously injected with rAAV expressing iDREADD were given 10 mg/kg CNO i.p. 30 min before being introduced into a new arena (60 cm × 60 cm). They were allowed to roam freely for 10 min. Subsequently a novel object (pen) was introduced in the middle and they were allowed to explore the object for another 10 min. The session was recorded using a video camera (Imaging Source) and tracked online using the AnyMaze 7 software (Stoelting). Offline analysis measured the total distance traveled during the first 10 min as well as center/surround preference. We also used AnyMaze 7 to measure the time spent investigating a novel object. Mann-Whitney tests were performed to compare between the two groups.
Novel mouse exploration (sociability)
Isolated Amigo2-Cre and their WT littermate mice previously injected with rAAV expressing iDREADD were given 10 mg/kg CNO i.p. 30 min before being presented to an intruder (see above). All resident mice used in the analysis displayed an initial period of social exploration of the intruder during the resident-intruder test, and were scored offline for the time spent interacting with the intruder mouse.
Prey-aggression
Isolated Amigo2-Cre and their WT littermate mice previously injected with rAAV expressing iDREADD were given 10 mg/kg CNO i.p. 30 min before a live cricket was introduced into their home cage. We measured the latency to attack and whether they did or did not attack the prey. Mice were food-deprived 12h prior to the experiment.
Feeding
Isolated mice implanted for fiber-photometry were food-deprived for 12 h. A food pellet was introduced into their home cage and we recorded CA2 activity during 10 min of feeding.
Female interaction
Isolated mice implanted for fiber-photometry were presented with a female in estrus in their home cage for 15 min. Estrus was induced in ovariectomized females (C56Bl6/J) as described46. Briefly, gonadectomized, steroid-primed C57Bl6/J females (implanted with a capsule containing 50 μg estradiol benzoate in 25 μl sesame oil, followed by a subcutaneous injection of 0.5 mg progesterone in 25 μl sesame oil 4–6 h before use) were used as stimulus mice. An implant of progesterone was inserted in their neck and an i.p. injection of estradiol was given 4h prior to the test.
Multiple ovariectomized female interaction.
Isolated mice implanted for fiber-photometry were presented with a gonadectomized C57Bl6/J female for 5 min in the test mouse home cage. The presentation was repeated 4 times with 10 min interval. Upon the fifth presentation, a novel ovariectomized female was presented for 5 min13.
Fiber-photometry recordings
Fiber-photometry was conducted similar to previous studies31,47,48. Two LEDs (405 nm and 473 nm) were coupled to a fluorescence mini-cube (FMC) and 1×1 fiber optic rotary joint to deliver light into optical fibers permanently implanted above the lateral septum or CA2 during behavior. Emitted light between 420-450 nm (with 405 nm excitation) and 500-540 nm (with 473 nm excitation) were collected through the FMC on separate fiber-coupled Newport 2151 photo-receiver modules. The collected fluorescent signals were collected in AC-high mode and converted to voltage via the formula V = P*R*G, where V = collected voltage, P = the optical input power in watts, R = photodetector responsivity in amps/watts (0.2 – 0.4), and G = the trans-impedance gain of the amplifier. Raw signals for 473 nm excitation (GCaMP6f) and 405 nm excitation (background auto-fluorescence) were recorded and processed via Doric Neuroscience Studio software. Subtraction of the background fluorescence was calculated via a time-fitted running average of the 473 nm channel relative to the 405 nm control channel and normalized by the 405 nm signal using the formula (473 nm – 405 nm / 405 nm). Finally, a peak enveloping Fourier transform was applied to the ∆F/F signal across the entire trace to identify peaks in activity. Light was delivered at a final intensity of 2.24 mW (473 nm) and 2.76 mW (405 nm) at the tip of the patch-cord prior to coupling with the implanted ferrule. Mice were habituated to the fiber for three days by placing the fiber on the mouse head and letting it roam free for 1h. Mice were also housed with a female for one night in order to increase their aggression. On the fourth day, we conducted the resident-intruder test as described above and recorded the interaction for 10-15 min. Other behavioral tests were conducted on the following days. We measured peak and mean fluorescence during each behavioral episode and normalized them by the average of the peak or mean fluorescence in between each interaction episode while the mouse was freely moving in its cage (non-social exploration of the cage). Mouse tracking using AnyMaze was used to calculate the mouse velocity. Pearson correlation coefficient was used to calculate the correlation between fluorescent signal and velocity.
Data availability statement
All analyzed data supporting this study are presented in the form of graphs. All raw records used in the analysis are available from the corresponding author in response to reasonable requests.
Extended Data
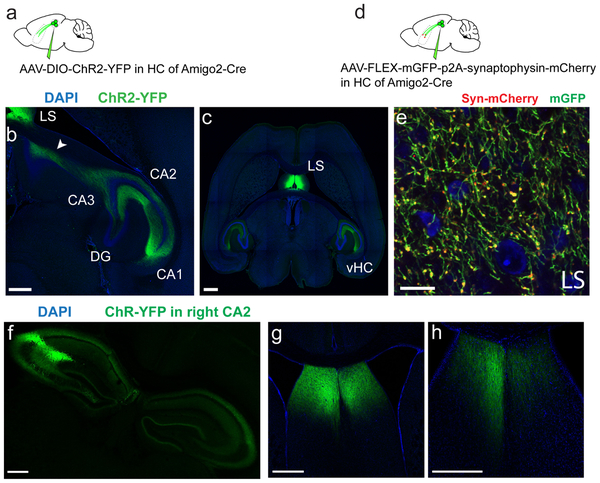
Extended Data Figure 1: CA2 projections to LS in horizontal sections.
a-c. Horizontal sections from an Amigo2-Cre mouse brain injected with rAAV5-EF1a-DIO-hChR2(E123T/T159C)-eYFP into CA2. The arrow on b shows the CA2 axons extending up to the dLS. Drawing was inspired from ref.49 c. is more ventral and shows the CA2 projection to the lateral septum as well as to the ventral hippocampus. d-e. Enlarged view of a coronal dLS section of an Amigo2-Cre mouse injected in CA2 with rAAV5-mGFP-p2A-Synatophysin-mCherry labelling CA2 projections (green) and presynaptic terminals (red). f-h. Coronal sections of an Amigo2-Cre mouse brain injected unilaterally with rAAV5-EF1a-DIO-hChR2(E123T/T159C)-eYFP into the right CA2 area. f. Hippocampal section. g-h. LS sections. 3 mice injected per experiment. All mice presented similar staining pattern. All scale bars 500 μm except e (20 μm).
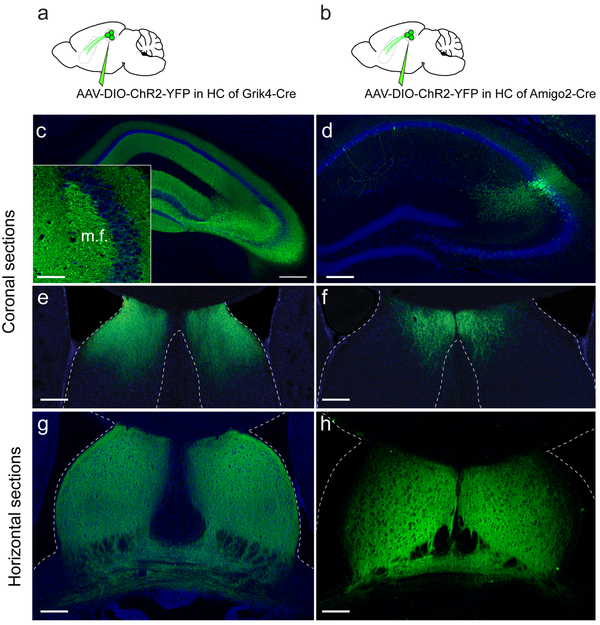
Extended Data Figure 2: CA3 and CA2 project to different but overlapping regions of LS.
rAAV5-EF1a-DIO-hChR2(E123T/T159C)-eYFP was injected into the hippocampal CA3 region of a Grik4-Cre mouse (a) and the CA2 region of an Amigo2-Cre mouse (b). c-f. Hippocampal (c-d) and lateral septum coronal (e-f) sections. g-h. Horizontal LS sections. 3 mice injected per experiment. All mice presented similar staining pattern. All scale bars 200 μm except in the inset (50 μm).
Extended Data Figure 3: CTB and rabies virus injection in dLS confirms the CA2-LS projection.
a. Atlas drawing (reproduced with permission from ref.50) of the CTB-488 injection site. b-d. Hippocampal coronal section following injection of CTB (green) in the lateral septum and labelled for PCP4 (red). b. Whole hippocampi. High magnification views of CA2 region in left (c) and right (d) hippocampus. 3 mice injected. b. Coronal section of LS injected with G-deleted rabies virus (green). c-d. Locally infected cells (arrows, green) are enlarged and labelled for GABA immunofluorescence (arrows, purple). 3 mice injected per experiment. All mice presented similar staining patterns. Scale bars: b,e 500 μm, c-d 50 μm, f-g 100 μm.
Extended Data Figure 4: CA2 PNs project to both dCA1 and LS.
a. Dual retrograde staining of CA2. Injection of HSV-LSL1-mCherry into dorsal CA1 and CTB-488 into LS of an Amigo2-Cre. b. Hippocampal coronal section following injection in a and labelled for RGS14. Arrowhead denotes single labelled cells and arrows dual-labelled ones. Scale bar 50 μm. c. Quantification of the percentage of CA2 PNs projecting to either dLS or dCA1. Because retrograde labeling efficiency is not complete, the fraction of labeled cells provides a lower limit on the fraction of dCA2 PNs projecting to these regions (12 sections from 6 mice in each group). Bars show mean ± SEM. d. Comparison of the expected percentage of dual labelled CA2 PNs versus the observed percentage. The fraction of dual-labeled cells (21±4%) was almost identical to the fraction predicted under the assumption of random retrograde labeling of a single population of CA2 PNs, each of which sends a projection to CA1 and LS ([fraction of labeled CA1-projecting cells] × [fraction of labeled LS-projecting cells] = 0.55 × 0.44 = 24%). This is similar to results suggesting that a uniform population of CA3 PNs projects to both LS and CA151. Thus, it is likely that a single population of CA2 pyramidal cells projects to both LS and CA1. Two-sided Wilcoxon test, P=0.2. Black dots: individual mice (n=6). Red dots with error bars: mean ± SEM.
Extended Data Figure 5: Analysis of light-evoked synaptic responses with ChR2-eYFP expressed in dCA2 PNs.
a. Hippocampal or septal slice recordings from Amigo2-Cre mouse injected in dCA2 with rAAV5-EF1a-DIO-hChR2(E123T/T159C)-eYFP (5 cells from 3 mice). b. CA2 PN voltage response under current-clamp to a 20 Hz train of 1-ms light pulses. Scale bars: 20 mV and 200 ms. c. dCA2 PN current responses under voltage-clamp with increasing light stimulation intensity. Negative (excitatory) currents plotted upwards. Note action currents reflecting escaped action potentials with two largest light intensities. Scale bars: 1 nA and 5 ms. d. Input-output curve for light-induced current in ChR2-expressing dCA2 PNs. e. dLS synaptic voltage responses in septal slice from Amigo2-Cre mice injected with same virus as in a. f-g. Bar graphs of maximal dLS PSP amplitude (f) and latency (g) following light stimulation (65 cells from 32 mice). Bar graphs show mean ± SEM. h. Quantification of GABAA and GABAB receptor antagonist application (1 μM SR 95531 and 2 μM CGP 55845, respectively) on dLS light-induced PSP amplitude showing individual cells (black, 6 cells from 4 mice) and mean ± SEM (red). Two-sided Wilcoxon test, *P=0.03. Scale bars 2 mV and 100 ms i. dLS light-induced PSP amplitude before and after application of AMPA and NMDA receptors antagonists 25 μM D-APV and 20 μM CNQX, respectively (6 cells from 3 mice). Two-sided Wilcoxon test compared to baseline, P=0.03. Scale bars 5 mV and 100 ms j. vLS recording under same conditions as in a and e. k. vLS light-induced IPSC amplitude before and after application of 25 μM APV and 20 μM CNQX (6 cells from 3 mice). Two-sided Wilcoxon test, P=0.03. Scale bars: 200 pA and 100 ms.
Extended Data Figure 6: Effect of CA2 silencing on aggression attack parameters.
Amigo2-Cre (Cre) and WT littermates (WT) were injected in dCA2 with rAAV2-hsyn-DIO-HA-hM4D(Gi)-IRES-mCitrine (AAV-DIO-iDREADD). After 3 weeks, mice were injected intraperitoneally with CNO or saline and, 30 min later, run in the resident-intruder test. a-d. Bars, mean number of bites (a), attack bouts (b), attack duration (c) and tail rattles (d). Grey dots: individual mice (29, 29, 43 and 34 mice from left to right for all bar graphs). Error bars: SEM. Two-sided Mann-Whitney tests: *P=0.011; **P=0.096; *P=0.012 and *P=0.041 for a-d respectively.
Extended Data Figure 7: Behavioral controls for CA2 silencing.
Amigo2-Cre (Cre) and WT littermates (WT) were injected in dCA2 with rAAV2-hsyn-DIO-HA-hM4D(Gi)-IRES-mCitrine. After 3-4 weeks for viral expression, mice were given CNO (10 mg/kg) intraperitoneally 30 min prior to behavioral testing. a-d. Open field testing. a. Distance travelled. b. Heat map of time spent at each position (all 25 mice presented similar heat maps). c. Time spent in center and surround. d. Ratio of the time spent in surround / center. e. Time spent interacting with a novel object. f. Time spent interacting with a novel mouse. g. Stacked bar charts of the distribution of mice that attacked or only explored the cricket. h. Latency to attack cricket. Grey dots: individual mice (14 WT and 11 Amigo2-cre mice). Bars show mean ± SEM.
Extended Data Figure 8: Silencing dCA2 inputs to dLS by CNO application reduces PSP in dLS neurons evoked by photostimulation.
a1. Co-expression of iDREADD and ChR2 in CA2 PNs. a2. Left, Light-evoked PSP in dLS neuron before and after bath application of 5 μM CNO. Scale bars 1 mV and 100 ms. Right, Quantification of effect of CNO on peak PSP amplitude showing individual cells (black, 7 cells from 3 mice) and mean ± SEM (red). Two-sided Wilcoxon test, *P=0.02. b. Schematic (b1) and LS coronal section (b2) from an Amigo2-Cre mouse expressing iDREADD and mCitrine in CA2 PNs and implanted with a cannula in LS. Mouse was infused with 1 μl miniRuby through the cannula 15 min before sacrifice. Labelling shows mCitrine expression (green) and miniRuby (red). Scale bar 400 μm.
Extended Data Figure 9: Hippocampal retrograde labelling following HSV injection into VMHvl.
a. Schematic of the experiment. b-d. Coronal sections after injection of the retrograde trans-synaptic tracer HSV CMV-mCherry into the VMHvl. Note the labelling in dorsal and ventral LS (c) and dCA2 (d). 3 mice injected. All mice presented a similar staining pattern. Scale bars: b-c 100 μm, d 40 μm.
Extended Data Figure 10: VMHvl c-Fos quantification controls.
a. Representative images of c-Fos immunofluorescence in VMH following bouts of aggression 30 min after intraperitoneal injection of CNO or saline in WT or Amigo2-Cre mice (all groups previously injected in CA2 with rAAV2-hsyn-DIO-HA-hM4D(Gi)-IRES-mCitrine.) Scale bars, 400 μm. b. Plot of the number of c-Fos expressing cells in VMHvl of WT mice sacrificed 1 hour following indicated behaviors. Grey dots: individual mice (5, 6 and 9 mice). Bars show mean ± SEM. Kruskal-Wallis test Γ2=15.16, P<0.0001 followed by Dunn’s multiple comparison tests, ***P=0.0006 and *P=0.01. c. Each mouse was challenged with a resident-intruder test once every 5 days until showed aggression, after which it was sacrificed. Grey dots: individual mice (7, 8, 7 and 13). Bars show mean ± SEM. Two-way ANOVA: F=7.4, *P=0.01.
Extended Data Figure 11: Fiber-photometry measures of CA2 PN GCaMP6f signals during social interactions.
a. Plot of the GCaMP6f fluorescent signal as a function of mouse velocity. Pearson test of correlation (r) performed on n=5332 1-s time bins. Note the lack of correlation (P=0.7). Lack of correlation was observed in all mice. b. Bar graph of the GCaMP6f responses with fiber over CA2 PN soma during indicated social behavior (calculated from the mean signal during each episode). Each point represents an episode (49, 31 and 20 episodes from left to right collected from 5 mice). Two-sided one-sample t-tests. ****P<0.001, ***P=0.0001. c. Same as b for CA2 PN terminals in LS (34, 27 and 23 episodes collected from 6 mice). Bars show mean ± SEM. Two-sided one-sample t-test. ****P<0.001. d-j. GCaMP6f responses from CA2 somas during various social and non-social behaviors. GCaMP6f recording from CA2 PNs in hippocampus during: (d) exploration of a novel environment, (e) exploration of a novel object, (f) feeding, (g) exploration of a female, and (h) predator-prey aggression. Bar graphs of the GCaMP6f responses during each type of social interaction (calculated from the max (i) or the mean (j) signal during each episode). Each point represents an episode except for the novel environment, where episodes were defined as 10-s bins (60, 27, 17, 27, 34, 21, 43, 19 episodes from left to right collected from 6 mice). Bars show mean ± SEM. Two-sided one-sample t-tests for i. *P=0.03, *P=0.02, *P=0.047 and ****P<0.0001 from left to right. Two-sided one-sample t-tests for j. *P=0.003, ****P<0.0001, **P=0.002 and ****P<0.0001 from left to right. k-m. Behavior and GCaMP6f responses from dCA2 PN soma during multiple presentations of an ovariectomized female. k. Time spent in social exploration of the same novel female presented in trials 1-4 and a second novel female in trial 5 (4 mice). Resident males normally engaged in non-aggressive social exploration of the female during each exposure, with exploration time decreasing in successive trials as a result of increased familiarity. Introduction of a novel female in trial 5 resulted in enhanced social exploration, indicating that the decrease in exploration of the same female represents social memory formation, and not fatigue or disinterest. We previously found that this behavior required dCA213. Black dots: mean ± SEM. Two-sided t-test, **P=0.005. Peak (l) and mean (m) GCaMP6f responses recorded from CA2 PNs in hippocampus during each period of social exploration in each trial (10, 12, 20, 23 and 26 episodes collected from 4 mice). Bars: mean ± SEM. Fiber-photometry recordings show that dCA2 responds during social exploration of the female in the familiarization trials, with a trend for activity to decrease with increased familiarization. Introduction of the novel female produced a statistically significant increase in the dCA2 GCaMP6f signal (trial 5). Two-sided t-tests: *P=0.048 (l) and *P=0.039 (m).
Extended Data Figure 12: Neuromodulation of the CA2-LS synapse by AVP.
a. ChR2 expression in dCA2 PNs. b. Paired-pulse ratio of PSP amplitudes evoked by two light pulses separated by 50 ms, before and after 100 nM AVP (19 cells from 10 mice). Black dots: individual cells. Red dots: mean ± SEM. Two-sided Wilcoxon test, ****P<0.0001. Scale bars: 2 mV, 100 ms. c. Example time course of PSP in dLS evoked by photostimulation of ChR2-expressing dCA2 projections. Grey bar shows period of bath application of 250 nM TGOT. d. PSP amplitudes before and 30 min after 250 nM TGOT application (7 cells from 3 mice). Black dots: individual cells. Red dots: mean ± SEM. Two-sided Wilcoxon test, P=0.3.
Supplementary Material
Video 1: 3D visualization of the CA2-LS projection.
3D brain reconstruction from Amigo2-Cre mouse injected in dCA2 with rAAV5-EF1a-DIO-hChR2(E123T/T159C)-eYFP (3 mice) showing the dCA2 to LS projection. Brains were cleared using iDISCO. All experiments yielded similar results.
Video 2: Example of behaviors during the resident-intruder test.
WT littermate mouse following infusion of CNO in dLS. Only behaviors observed for the resident (black mouse) are described (in italics) with our classification above. Note the progression from exploration to dominance and then attack. All resident-intruder tests were normally performed in low-light conditions with cage lid on, in an isolation chamber.
Acknowledgements:
The authors thank: Nicolas Renier, the Rockefeller imaging center and the laboratories of Franck Polleux and Thomas Jessell for their help creating Video 1 as well as the members of the Siegelbaum laboratory, Randy Bruno and Laetitia Herbaut for helpful discussions. This work was supported by the R01 MH104602 and R01 MH106629 from NIH (S.A.S.), by PD/BD/113700/2015 from the Portuguese Foundation for Science and Technology (T.M.) and HHMI (E.R.K).
Footnotes
Competing financial interests:
The authors declare no competing financial interest.
Bibliography:
- 1.Anderson DJ Circuit modules linking internal states and social behaviour in flies and mice. Nat. Rev. Neurosci. 17, 692–704 (2016). [DOI] [PubMed] [Google Scholar]
- 2.Hashikawa K, Hashikawa Y, Falkner A & Lin D The neural circuits of mating and fighting in male mice. Curr. Opin. Neurobiol. 38, 27–37 (2016). [DOI] [PMC free article] [PubMed] [Google Scholar]
- 3.Lin D et al. Functional identification of an aggression locus in the mouse hypothalamus. Nature 470, 221–226 (2011). [DOI] [PMC free article] [PubMed] [Google Scholar]
- 4.Falkner AL, Grosenick L, Davidson TJ, Deisseroth K & Lin D Hypothalamic control of male aggression-seeking behavior. Nat. Neurosci. 19, 596–604 (2016). [DOI] [PMC free article] [PubMed] [Google Scholar]
- 5.Brady JV & Nauta WJH Subcortical mechanisms in emotional behavior: affective changes following septal forebrain lesions in the albino rat. J. Comp. Physiol. Psychol. 46, 339–346 (1953). [DOI] [PubMed] [Google Scholar]
- 6.Wong LC et al. Effective Modulation of Male Aggression through Lateral Septum to Medial Hypothalamus Projection. Curr. Biol. 26, 593–604 (2016). [DOI] [PMC free article] [PubMed] [Google Scholar]
- 7.Risold P . & Swanson L . Chemoarchitecture of the rat lateral septal nucleus. Brain Res. Rev. 24, 91–113 (1997). [DOI] [PubMed] [Google Scholar]
- 8.Risold P . & Swanson L . Connections of the rat lateral septal complex. Brain Res. Rev. 24, 115–195 (1997). [DOI] [PubMed] [Google Scholar]
- 9.Zhou T et al. History of winning remodels thalamo-PFC circuit to reinforce social dominance. Science (80-. ). 357, 162–168 (2017). [DOI] [PubMed] [Google Scholar]
- 10.Williamson CM, Lee W & Curley JP Temporal dynamics of social hierarchy formation and maintenance in male mice. Anim. Behav. 115, 259–272 (2016). [Google Scholar]
- 11.Lorente De Nó R Studies on the structure of the cerebral cortex. II. Continuation of the study of the ammonic system. J. für Psychol. und Neurol. 46, 113–177 (1934). [Google Scholar]
- 12.Dudek SM, Alexander GM & Farris S Rediscovering area CA2: Unique properties and functions. Nat. Rev. Neurosci. (2016). doi: 10.1038/nrn.2015.22 [DOI] [PMC free article] [PubMed] [Google Scholar]
- 13.Hitti FL & Siegelbaum SA The hippocampal CA2 region is essential for social memory. Nature 508, 88–92 (2014). [DOI] [PMC free article] [PubMed] [Google Scholar]
- 14.Stevenson EL & Caldwell HK Lesions to the CA2 region of the hippocampus impair social memory in mice. Eur. J. Neurosci. 40, 3294–301 (2014). [DOI] [PMC free article] [PubMed] [Google Scholar]
- 15.Young WS, Li J, Wersinger SR & Palkovits M The vasopressin 1b receptor is prominent in the hippocampal area CA2 where it is unaffected by restraint stress or adrenalectomy. Neuroscience 143, 1031–9 (2006). [DOI] [PMC free article] [PubMed] [Google Scholar]
- 16.Pagani JH et al. Role of the vasopressin 1b receptor in rodent aggressive behavior and synaptic plasticity in hippocampal area CA2. Mol. Psychiatry 20, 490–499 (2015). [DOI] [PMC free article] [PubMed] [Google Scholar]
- 17.Cui Z, Gerfen CR & Young WS Hypothalamic and other connections with dorsal CA2 area of the mouse hippocampus. J. Comp. Neurol. 521, 1844–1866 (2013). [DOI] [PMC free article] [PubMed] [Google Scholar]
- 18.Alonso JR & Frotscher M Organization of the septal region in the rat brain: A Golgi/EM study of lateral septal neurons. J. Comp. Neurol. 286, 472–487 (1989). [DOI] [PubMed] [Google Scholar]
- 19.Allaman-Exertier G, Reymond-Marron I, Tribollet E & Raggenbass M Vasopressin modulates lateral septal network activity via two distinct electrophysiological mechanisms. Eur. J. Neurosci. 26, 2633–2642 (2007). [DOI] [PubMed] [Google Scholar]
- 20.Evans PR, Lee SE, Smith Y & Hepler JR Postnatal developmental expression of regulator of G protein signaling 14 (RGS14) in the mouse brain. J. Comp. Neurol. 522, 186–203 (2014). [DOI] [PMC free article] [PubMed] [Google Scholar]
- 21.Kohara K et al. Cell type–specific genetic and optogenetic tools reveal hippocampal CA2 circuits. Nat. Neurosci. 17, 269–279 (2014). [DOI] [PMC free article] [PubMed] [Google Scholar]
- 22.Tamamaki N, Abe K & Nojyo Y Three-dimensional analysis of the whole axonal arbors originating from single CA2 pyramidal neurons in the rat hippocampus with the aid of a computer graphic technique. Brain Res. 452, 255–272 (1988). [DOI] [PubMed] [Google Scholar]
- 23.Meira T et al. A hippocampal circuit linking dorsal CA2 to ventral CA1 critical for social memory dynamics. Nat. Commun (2018). [DOI] [PMC free article] [PubMed] [Google Scholar]
- 24.Koolhaas JM et al. The Resident-intruder Paradigm: A Standardized Test for Aggression, Violence and Social Stress. J. Vis. Exp e4367 (2013). doi: 10.3791/4367 [DOI] [PMC free article] [PubMed] [Google Scholar]
- 25.Blanchard RJ & Caroline Blanchard D Aggressive behavior in the rat. Behav. Biol. 21, 197–224 (1977). [DOI] [PubMed] [Google Scholar]
- 26.Takahashi A, Quadros IM, de Almeida RMM & Miczek KA in Current Topics in Behavioral Neurosciences 73–138 (2011). doi: 10.1007/7854_2011_191 [DOI] [PMC free article] [PubMed] [Google Scholar]
- 27.Toth M, Fuzesi T, Halasz J, Tulogdi A & Haller J Neural inputs of the hypothalamic “aggression area” in the rat. Behav. Brain Res. 215, 7–20 (2010). [DOI] [PubMed] [Google Scholar]
- 28.Swanson LW & Cowan WM The connections of the septal region in the rat. J. Comp. Neurol. 186, 621–655 (1979). [DOI] [PubMed] [Google Scholar]
- 29.Ugolini G Advances in viral transneuronal tracing. J. Neurosci. Methods 194, 2–20 (2010). [DOI] [PubMed] [Google Scholar]
- 30.Lee H et al. Scalable control of mounting and attack by Esr1+ neurons in the ventromedial hypothalamus. Nature 509, 627–632 (2014). [DOI] [PMC free article] [PubMed] [Google Scholar]
- 31.Hashikawa K et al. Esr1+ cells in the ventromedial hypothalamus control female aggression. Nat. Neurosci. 20, 1580–1590 (2017). [DOI] [PMC free article] [PubMed] [Google Scholar]
- 32.Connor JL & Lynds PG Mouse aggression and the intruder-familiarity effect: evidence for multiple-factor determination c57bl. J. Comp. Physiol. Psychol. 91, 270–80 (1977). [DOI] [PubMed] [Google Scholar]
- 33.Szenczi P, Bánszegi O, Groó Z & Altbäcker V Development of the Social Behavior of Two Mice Species With Contrasting Social Systems. Aggress. Behav 38, 288–297 (2012). [DOI] [PubMed] [Google Scholar]
- 34.Smith AS, Williams Avram SK, Cymerblit-Sabba A, Song J & Young WS Targeted activation of the hippocampal CA2 area strongly enhances social memory. Mol. Psychiatry 21, 1137–1144 (2016). [DOI] [PMC free article] [PubMed] [Google Scholar]
- 35.Gal CS-L et al. An Overview of SSR149415, a Selective Nonpeptide Vasopressin V1b Receptor Antagonist for the Treatment of Stress-Related Disorders. CNS Drug Rev. 11, 53–68 (2006). [DOI] [PMC free article] [PubMed] [Google Scholar]
- 36.Blanchard R et al. AVP V selective antagonist SSR149415 blocks aggressive behaviors in hamsters. Pharmacol. Biochem. Behav. 80, 189–194 (2005). [DOI] [PubMed] [Google Scholar]
- 37.Okuyama T, Kitamura T, Roy DS, Itohara S & Tonegawa S Ventral CA1 neurons store social memory. Science 353, 1536–1541 (2016). [DOI] [PMC free article] [PubMed] [Google Scholar]
- 38.Nakazawa K et al. Requirement for hippocampal CA3 NMDA receptors in associative memory recall. Science 297, 211–8 (2002). [DOI] [PMC free article] [PubMed] [Google Scholar]
- 39.Wersinger SR, Ginns EI, O’Carroll A-M, Lolait SJ & Young III WS Vasopressin V1b receptor knockout reduces aggressive behavior in male mice. Mol. Psychiatry 7, 975–984 (2002). [DOI] [PubMed] [Google Scholar]
- 40.Berndt A et al. High-efficiency channelrhodopsins for fast neuronal stimulation at low light levels. Proc. Natl. Acad. Sci. 108, 7595–7600 (2011). [DOI] [PMC free article] [PubMed] [Google Scholar]
- 41.Urban DJ & Roth BL DREADDs (Designer Receptors Exclusively Activated by Designer Drugs): Chemogenetic Tools with Therapeutic Utility. Annu. Rev. Pharmacol. Toxicol 55, 399–417 (2015). [DOI] [PubMed] [Google Scholar]
- 42.Chen T-W et al. Ultrasensitive fluorescent proteins for imaging neuronal activity. Nature 499, 295–300 (2013). [DOI] [PMC free article] [PubMed] [Google Scholar]
- 43.Callaway EM & Luo L Monosynaptic Circuit Tracing with Glycoprotein-Deleted Rabies Viruses. J. Neurosci. 35, 8979–8985 (2015). [DOI] [PMC free article] [PubMed] [Google Scholar]
- 44.Renier N et al. Mapping of Brain Activity by Automated Volume Analysis of Immediate Early Genes. Cell 165, 1789–1802 (2016). [DOI] [PMC free article] [PubMed] [Google Scholar]
- 45.Leroy F, Brann DH, Meira T & Siegelbaum SA Input-Timing-Dependent Plasticity in the Hippocampal CA2 Region and Its Potential Role in Social Memory. Neuron 95, 1089–1102.e5 (2017). [DOI] [PMC free article] [PubMed] [Google Scholar]
- 46.Kikusui T in Methods in molecular biology 307–318 (2013). doi: 10.1007/978-1-62703-619-1_23 [DOI] [PubMed] [Google Scholar]
- 47.Lerner TN et al. Intact-Brain Analyses Reveal Distinct Information Carried by SNc Dopamine Subcircuits. Cell 162, 635–47 (2015). [DOI] [PMC free article] [PubMed] [Google Scholar]
- 48.Gunaydin LA et al. Natural Neural Projection Dynamics Underlying Social Behavior. Cell 157, 1535–1551 (2014). [DOI] [PMC free article] [PubMed] [Google Scholar]
- 49.Kohl J et al. Functional circuit architecture underlying parental behaviour. Nature (2018). doi: 10.1038/s41586-018-0027-0 [DOI] [PMC free article] [PubMed] [Google Scholar]
- 50.Watson C & Paxinos G Paxinos and Franklin’s the Mouse Brain in Stereotaxic Coordinates, Fourth Edition. The Spinal Cord: A Christopher and Dana Reeve Foundation Text and Atlas; (2012). [Google Scholar]
- 51.Swanson LW, Sawchenko PE & Cowan WM Evidence that the commissural, associational and septal projections of the regio inferior of the hippocampus arise from the same neurons. Brain Res. 197, 207–212 (1980). [DOI] [PubMed] [Google Scholar]
Associated Data
This section collects any data citations, data availability statements, or supplementary materials included in this article.
Supplementary Materials
Video 1: 3D visualization of the CA2-LS projection.
3D brain reconstruction from Amigo2-Cre mouse injected in dCA2 with rAAV5-EF1a-DIO-hChR2(E123T/T159C)-eYFP (3 mice) showing the dCA2 to LS projection. Brains were cleared using iDISCO. All experiments yielded similar results.
Video 2: Example of behaviors during the resident-intruder test.
WT littermate mouse following infusion of CNO in dLS. Only behaviors observed for the resident (black mouse) are described (in italics) with our classification above. Note the progression from exploration to dominance and then attack. All resident-intruder tests were normally performed in low-light conditions with cage lid on, in an isolation chamber.
Data Availability Statement
All analyzed data supporting this study are presented in the form of graphs. All raw records used in the analysis are available from the corresponding author in response to reasonable requests.


