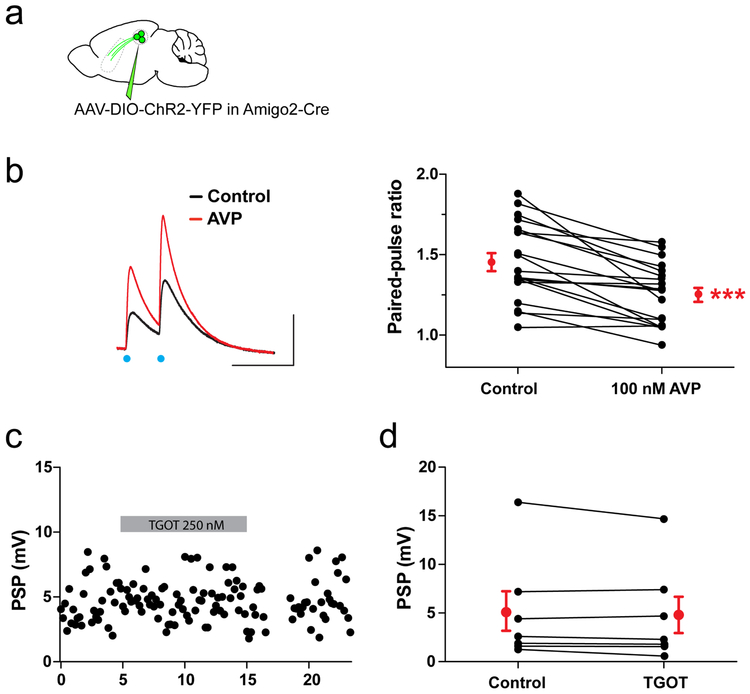
Extended Data Figure 12: Neuromodulation of the CA2-LS synapse by AVP.
a. ChR2 expression in dCA2 PNs. b. Paired-pulse ratio of PSP amplitudes evoked by two light pulses separated by 50 ms, before and after 100 nM AVP (19 cells from 10 mice). Black dots: individual cells. Red dots: mean ± SEM. Two-sided Wilcoxon test, ****P<0.0001. Scale bars: 2 mV, 100 ms. c. Example time course of PSP in dLS evoked by photostimulation of ChR2-expressing dCA2 projections. Grey bar shows period of bath application of 250 nM TGOT. d. PSP amplitudes before and 30 min after 250 nM TGOT application (7 cells from 3 mice). Black dots: individual cells. Red dots: mean ± SEM. Two-sided Wilcoxon test, P=0.3.

