Abstract
The airborne transmission of infection relies on the ability of pathogens to survive aerosol transport as they transit between hosts. Understanding the parameters that determine the survival of airborne microorganisms is critical to mitigating the impact of disease outbreaks. Conventional techniques for investigating bioaerosol longevity in vitro have systemic limitations that prevent the accurate representation of conditions that these particles would experience in the natural environment. Here, we report a new approach that enables the robust study of bioaerosol survival as a function of relevant environmental conditions. The methodology uses droplet-on-demand technology for the generation of bioaerosol droplets (1 to greater than 100 per trial) with tailored chemical and biological composition. These arrays of droplets are captured in an electrodynamic trap and levitated within a controlled environmental chamber. Droplets are then deposited on a substrate after a desired levitation period (less than 5 s to greater than 24 h). The response of bacteria to aerosolization can subsequently be determined by counting colony forming units, 24 h after deposition. In a first study, droplets formed from a suspension of Escherichia coli MRE162 cells (108 ml−1) with initial radii of 27.8 ± 0.08 µm were created and levitated for extended periods of time at 30% relative humidity. The time-dependence of the survival rate was measured over a time period extending to 1 h. We demonstrate that this approach can enable direct studies at the interface between aerobiology, atmospheric chemistry and aerosol physics to identify the factors that may affect the survival of airborne pathogens with the aim of developing infection control strategies for public health and biodefence applications.
Keywords: airborne transmission, survival, bioaerosol, infection, aerosol transport
1. Introduction
Bioaerosols are a suspension of atmospheric particles of biological origin containing living and/or dead organisms (e.g. bacteria, viruses, pollen, etc.) and their derivatives (e.g. allergens, endotoxins, etc.). Their study requires an interdisciplinary approach encompassing atmospheric chemistry, microbiology, aerosol microphysics, climate and medical sciences, and an understanding of diverse physical processes including human inhalation, ice nucleation, cloud formation and aerial dispersal. Bioaerosol sources can be natural (e.g. human sneeze, pollen) or anthropogenic (e.g. through agricultural practices, waste management sites) with the source influencing the bioaerosol particle size, composition and concentration in the atmosphere [1].
Bioaerosols have been studied since the late nineteenth century to determine the sources of epidemic diseases. Interest in bioaerosol has increased in recent decades due in part to a high number of airborne disease outbreaks and concern about the potential roles that airborne microorganisms play in atmospheric processes [2,3]. The multitude of adverse health effects derived from human exposure to bioaerosols particles is not yet fully understood despite their impact on public health and national defence [4,5]. This is mainly due to the present limitations in the current techniques used for bioaerosol studies for exploring aspects of atmospheric transport [6].
The dynamics involved in the transmission of airborne pathogens of concern to human, animal or plant health depend on the ability of the microorganisms to cause infection and, subsequently, disease when interacting with a host. This ability is a function of a wide range of factors (e.g. environmental, microbiological, etc.) that affect the integrity of the airborne microbes and can lead to a reduction of their biological activity which decreases their infectious potential [7]. The length of time airborne pathogens remains viable/infectious while suspended in the atmosphere impacts on dissemination of the disease outbreak.
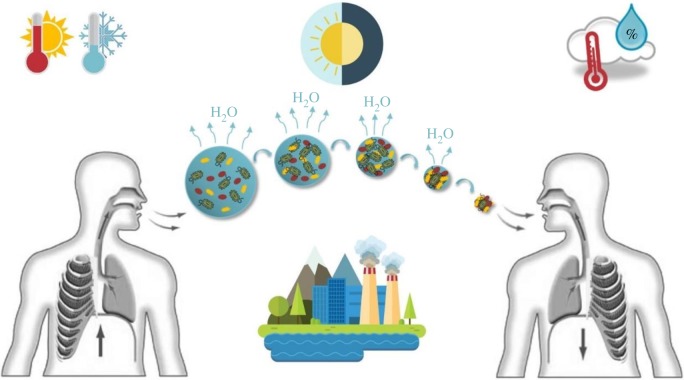
Viability has already been shown to be influenced by aerosol particle size, the presence of air pollutants, solar radiation, ambient temperature and environmental relative humidity, summarized in figure 1 [8,9]. During atmospheric transport, bioaerosol droplets undergo a series of evaporative and rehydration processes which result in changes in their metabolism and physiology. The conditions of atmospheric transport cannot be simulated under bulk conditions in bacterial cultures as aerosol droplets may exist in a state of metastable solute supersaturation not accessible in the bulk phase [10,11]. Further, chemical reaction rates in the aerosol phase can be several orders of magnitude higher than in the bulk state [12–14]. It is, therefore, more than conceivable that the microbial physiology is quite different in the aerosol phase. Thus, a ‘bottom-up’ approach to measuring the role of atmospheric process on bioaerosol survival is key to improving the representation of these processes in the true aerosol state extending from the individual cell to the population scale. Understanding the interplay of all the processes that determine microbial responses is key to develop more accurate predictive models of infection transmission and control strategies.
Figure 1.
Representation of the interplay between biological aerosols and atmospheric factors during aerosol transport. Examples of factors include environmental conditions such as the temperature and relative humidity, day and night-time atmospheric chemistry, and mixing with anthropogenic and other natural aerosols found in the atmosphere. (Online version in colour.)
Historically, the study of bioaerosol survival in vitro has been limited to two main different methodologies: the rotating drum and the use of microthreads. The rotating drum, referred to as an environmental chamber, is the most established approach, based on the aerosol chamber developed by Goldberg et al. in 1958 [15]. These systems have been used to generate longevity decay rates for bacteria and viruses by suspending the bioaerosol using centrifugal forces to counteract gravity [16–20]. Several improvements have allowed the levitation of particles larger than 1–2 µm in diameter for longer suspension periods under a wider range of environmental parameters [7,19]. However, limitations in the suspension times and particle sizes persist due to the gravitational deposition of particles on the walls of the vessel. For instance, the suspension of particles more representative of initial droplet sizes (approx. 360 µm diameter) produced during coughing and sneezing is difficult in these systems [21]. In the case of microthread techniques, the presence of turbulence can result in a loss of particles on the surfaces of the instrument and antimicrobial compounds on the spider silk can result in a reduction in viability [22,23]. Further disadvantages of these techniques are the stresses to which the bacteria are subjected during aerosol generation and sampling. Nebulization is typically the preferred method for aerosol generation, but this technique has been proven to cause loss of culturability in some bacterial species [24–26] and structural damage [22,27–29]. These techniques also lead to polydisperse aerosol droplets, subjecting the contained microorganisms to different surface-to-volume ratios at equilibrium size, and potentially producing different biological responses. Hence, the reported results reflect the average behaviour encompassing a range of initial droplet sizes. Finally, the sampling methods used with these techniques involve the use of prolonged sampling periods (i.e. combination of loading, mixing and extraction times) and high collection velocities, a proven cause of reduced viability [30–33].
The aim of this study is to adapt an electrodynamic trap (EDT) [34] into a next-generation tool for investigating the decay dynamics of bioaerosols. Using this approach minimizes generation and sampling stresses and reduces the influence of droplet polydispersity. Environmental conditions are readily controlled and timescales of bacteria in the aerosol phase are accurately known and can be varied from seconds to days. We first introduce the new approach, referred to as controlled electrodynamic levitation and extraction of bioaerosol onto a substrate (CELEBS), before presenting contrasting measurements of the viability of Escherichia coli MRE162 cells and Bacillus atrophaeus spores.
2. Material and methods
The CELEBS technique is described first, followed by the methods for determining particle concentration and bacterial viability in bioaerosol droplets together with a corresponding statistical analysis. Details of culture preparation, staining and microscopic analysis are described in the electronic supplementary material.
2.1. Controlled electrodynamic levitation and extraction of bioaerosol onto a substrate instrument
2.1.1. Overview of CELEBS instrument
The CELEBS instrument is shown in figure 2a. CELEBS allows routine capture and levitation of single or multiple bioaerosol droplets of monodisperse size in the aerosol phase under controlled environmental conditions for an indefinite time and subsequent deposition onto a substrate for offline analysis. A ground glass–metal chamber confines all the components of the EDT to avoid disturbance of the suspended droplets within a controlled atmosphere. Bioaerosol droplets containing bacterial species are generated on demand using a commercial droplet-on-demand (DoD) dispenser (Microfab MJ-ABP-01 with 30 µm orifice) fixed outside one of the sidewalls of the chamber and facing a small aperture which leads to the EDT. A DC electrode is located 2–3 mm away from the nozzle of the DoD dispenser to induce a charge on bioaerosol particles during formation. The EDT located in the interior of the chamber is composed of two horizontal ring electrodes (30 mm diameter) set in parallel with an intermediate distance of 20 mm where the droplets are suspended. A safety plate separates the EDT volume from the substrate holder to prevent premature exposure of the substrate to the bioaerosol particles. The positional arrangement between a CCD camera, an LED light and the top opening of the chamber facilitates imaging of the EDT from above. The image recorded by the CCD is analysed to count the number of levitated particles in the EDT using a LabView program developed in-house. The LED light (White LED, 580 nm, RS Components, UK) was tested in the bulk phase to ensure no impact on the viability of bacteria as assessed by colony forming unit (CFU) determination (table 1). Exposure to the LED light did not show any bactericidal effect.
Figure 2.
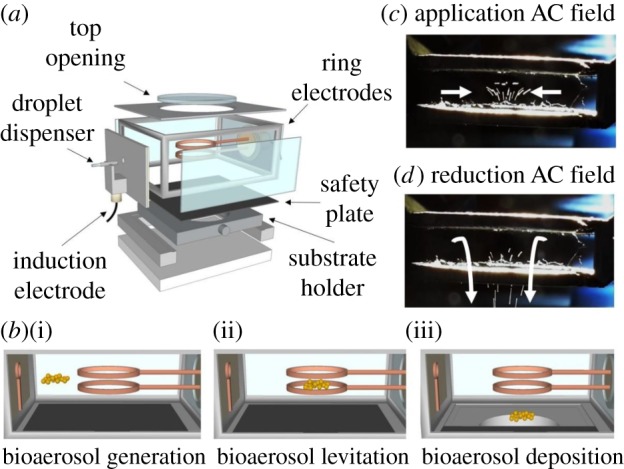
(a) Expanded view of the main components of the CELEBS apparatus. (b) Schematic diagram of CELEBS operation. (c,d) Consecutive close-up images for levitation and initial deposition of the same bioaerosol population. The levitated droplets appear as lines due to the slower shutter speed of the camera compared with the oscillatory motion of the droplets driven by the AC waveform applied to the ring electrodes. (Online version in colour.)
Table 1.
Comparison of recovered CFU between a bacterial culture exposed to the 580 nm LED and a non-exposed culture located in a dark area under the same atmospheric conditions. No significant difference in culturability was observed.
| time (hours) | exposed culture | non-exposed culture |
|---|---|---|
| mean value (CFU ml−1) | ||
| 0 | 2.18 ± 0.17 × 10⁹ | 2.26 ± 0.16 × 10⁹ |
| 1 | 2.29 ± 0.57 × 10⁹ | 1.92 ± 0.26 × 10⁹ |
| 2 | 2.68 ± 0.29 × 10⁹ | 2.35 ± 0.22 × 10⁹ |
| 3 | 2.47 ± 0.13 × 10⁹ | 2.25 ± 0.10 × 10⁹ |
| 4 | 2.93 ± 0.20 × 10⁹ | 2.75 ± 0.24 × 10⁹ |
| 5 | 2.59 ± 0.22 × 10⁹ | 2.33 ± 0.92 × 10⁹ |
| 6 | 2.53 ± 0.17 × 10⁹ | 2.15 ± 0.91 × 10⁹ |
| 24 | 2.52 ± 0.26 × 10⁹ | 2.14 ± 0.21 × 10⁹ |
The whole CELEBS instrument resides on a small 20 cm × 20 cm metal plate, allowing its safe operation in a microbiological safety cabinet (MSC) (LabGard model NU-425 Class II Type A2 Biosafety Cabinet, NuAir, UK).
2.1.2. Bioaerosol generation
An aliquot of a bacterial culture (10 μl) is pipetted into the reservoir of the DoD dispenser. A square waveform is applied to the piezoelectric crystal of the micro-dispenser tip, propelling a small volume of fluid out through the dispenser orifice as a jet that divides into an individual micro-droplet with a highly reproducible size (27.8 ± 0.08 µm radii), figure 2b(i). The waveform parameters together with the composition of the loaded suspension determine the characteristics of the drop generation process such as size and speed [35].
To enable the suspension of droplets in the EDT, a net charge is induced to every droplet by the DC potential applied to the induction electrode (−100 to −500 V). During formation of micro-droplets, the induction electrode produces an ion imbalance in the liquid jet formed at the tip of the DoD dispenser, resulting in a net charge on the droplet of opposed polarity to the induction electrode. The magnitude of the net charge induced to the droplets has been reported previously (less than 5 fC) [36] producing a chemically insignificant shift in the original ion concentration of the droplets (approx. 7 × 10⁻⁶% more sodium than chloride ions), but sufficient for the droplets to be confined by the electrodynamic potential in the centre of the EDT.
2.1.3. Bioaerosol levitation
The fundamentals of micro-particle levitation in the EDT have been previously described [37–40]. The electrodynamic fields used for particle levitation in the EDT are similar to those of the electrodynamic balance [41] or quadrupole ion trap [27]. However, no DC potential is applied directly to the ring electrodes or any of the EDT components in this study.
Dispensed droplets travel horizontally about 30 mm towards the interior of the chamber, before getting trapped (figure 2b(ii)). Oscillating forces from the electrodynamic field, created by applying an AC potential (1000–2700 V) to the ring electrodes, enable the stable confinement of charged particles in the centre of the EDT. Additionally, the electrostatic repulsions among the population of positively charged droplets (up to 200 droplets) prevent their coalescence (figure 2c). The population of trapped droplets resides in or near the null point of the trap [42].
The glass–metal chamber isolates the trapping region from surrounding air currents and ambient laboratory conditions. The droplets are suspended while a gas inlet enables control of atmospheric conditions in the EDT. The accessible RH range in the system is greater than 10 to less than 90% RH and can be readily controlled by adjustment of the ratio of humidified and dry air flows delivered by an air purifier (Precision Air Compressor, Peak Scientific, UK) using two flow valves. The airflow mixture enters the EDT from above the EDT where the droplets are levitated. Accurate RH and temperature values are registered by a probe (Humidity and Temperature Meter HMT331, Vaisala, UK) immediately before entering the EDT chamber.
2.1.4. Bioaerosol sampling
After the desired suspension period, the safety plate between the EDT and the substrate holder is removed connecting the trapping and sampling areas. By lowering the amplitude of the waveform applied to the ring electrodes, the levitated droplets are extracted (figure 2b(iii)) from the EDT onto the substrate (i.e. LB broth) in a short period of time (1–3 s, figure 2d). Collection velocities onto the substrate can be controlled and are typically 0.01–0.05 m s−1, avoiding damage to sensitive microorganisms. Calculated velocities (determined by measuring the distance between the EDT and the substrate holder, and the time taken for the droplet to fall at different deposition rates) are equivalent to the velocities of an electrostatic sampler. These sampling methods based on electrostatic precipitation have shown particle velocities between two and four orders of magnitude lower than velocities in inertial samplers reducing the impact on cell viability while providing high collection efficiency [43–45].
In rotating drums studies, liquid impingers with collection velocities reaching 265 m s−1 are used [45]. CELEBS methodology presents 3 × 10⁴ times slower sampling velocities and, consequently, a gentler collection process. A smooth deposition is critical as different sampling techniques have been reported to reduce microbial viability due to high impaction velocities and reduce the sensitivity of measurements to the parameters under study [22,32,46,47].
Moreover, the CELEBS collection process provides 100% sampling efficiency (see §3.4): every droplet trapped in the electric field is sampled on the collection medium (which can be any substrate, including liquid, gel, glass and cell culture). This 100% sampling efficiency is unique to CELEBS. Finally, the substrate can be removed from the apparatus and the viability and infectivity of bacteria assessed.
2.2. Offline viability assessment
For the determination of viability, the population of bioaerosol droplets is collected onto a plastic 35 mm Petri dish containing 1 ml of liquid LB broth. Bacterial aggregation is reduced by vigorous pipetting before solidifying the suspension by adding 4 ml of LB agar at a temperature below 45°C to avoid bacterial inactivation. The mixture of bioaerosol particles, LB broth and LB agar is stirred to ensure blending and solidification. This method enables the enumeration of single colonies in the same Petri dish where the bioaerosol sample is collected, without transferring to a separate plating media. Plates are air dried before incubation for 24 h at 37°C. The number of colonies which develop is taken as a measure of the number of viable cells (CFU) after specific aerosol suspension times, enabling calculation of the biological decay (BD) rate.
2.3. Quantitative characterization of bioaerosol decay
BD in the aerosol phase as a function of time is usually represented by the reduction of CFU [48]. Figure 3 shows a schematic diagram for the method used in this work to assess BD, presenting the relationship between the concentrations of viable bacteria within the droplets over time spent in the aerosol phase. Decline in culturability due to aerosolization can be determined by comparing recoverable CFU in bioaerosol harvested immediately after production (control) and after specific times in aerosol suspension (test). Thus, loss of culturability serves to quantify the BD over different time intervals during aerosol suspensions:
| 2.1 |
Figure 3.
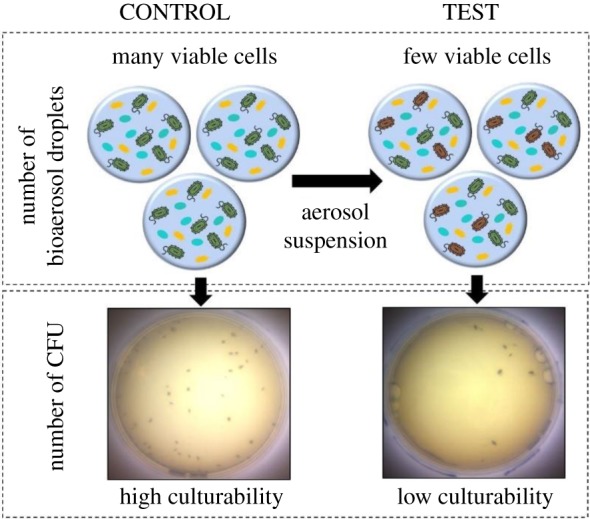
Schematic diagram for determination of BD. In the bioaerosol droplets, green bacteria represent viable cells and red bacteria represent dead cells. Yellow and blue components in the droplets represent media constituents and other organic and inorganic compounds. (Online version in colour.)
Cculturable (TEST) and Cculturable (CONTROL) are the culture concentrations of microorganisms expressed as CFU for the harvested bioaerosol droplets. We assume that the length of time that the bacteria spend in the aerosol during the control measurement is too short (30 s) to impact the CFU recovery of microbes contained in the deposited particles and is treated as a non-exposure measurement.
2.4. Statistical analysis of microbial concentration and bacterial viability in bioaerosol droplets
For the statistical analysis of the viability of bacterial cells (assessed as those with detected Syto9 fluorescence) enclosed in aerosol droplets, at least 200 cells from five different fields of view were analysed following deposition onto slides. The percentage of viable cells with an intact cell membrane was calculated by dividing the green-stained cells by the total number of cells for each field of view. The average and standard deviations were calculated for each parameter under evaluation.
For determination of number of cells enclosed in the bioaerosol droplets, the cell concentration of at least 20 different droplets was determined. For each concentration of cell suspension pipetted in the DoD, the average and standard deviation values of cells in the droplet were calculated. The probability distribution function (PDF) curves for cell concentration in bioaerosol droplets were produced by using the Poisson distribution equation (equation (2.2)) where λ represents the Poisson coefficient (average of cells per droplet for the culture concentration loaded in the micro-dispenser) and k the number of cells contained in a droplet.
| 2.2 |
3. Results and discussion
3.1. Establishing the number of bacteria cells contained within bioaerosol droplets
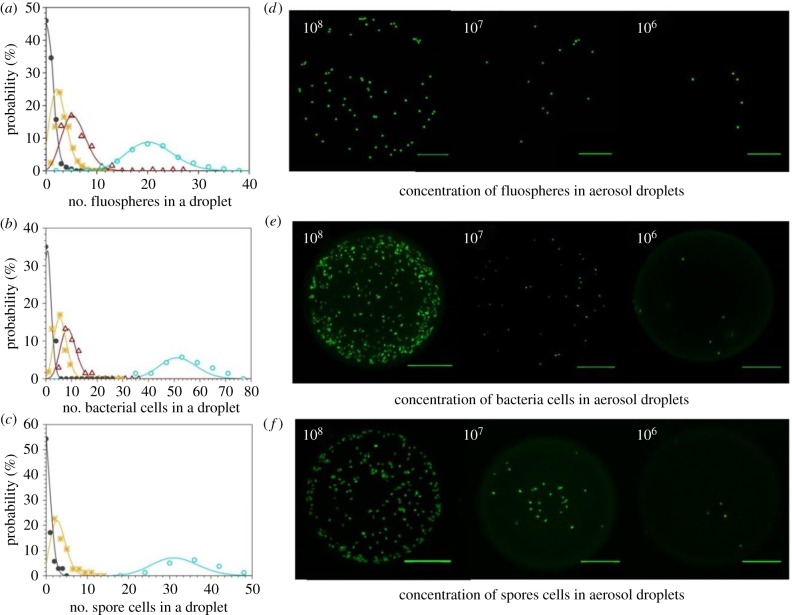
Aerosol generation using the DoD dispenser enables the microbial concentration in aerosol droplets to be varied across several orders of magnitude by modifying the concentration of particulates (i.e. bacteria) in the spray suspension (figure 4). Droplets containing three different types of particles (yellow-green fluorescent beads, 1 µm diameter; E. coli MRE612; B. atrophaeus spores) were generated from bulk suspensions at specific concentration ranges by using a DoD disperser. All solutions (whose concentrations/dilutions are described in the electronic supplementary material, §3) were aerosolized using a DoD dispenser with aerosol droplets collected on gelatin-coated microscope slides and visualized by confocal microscopy (see electronic supplementary material, §4).
Figure 4.
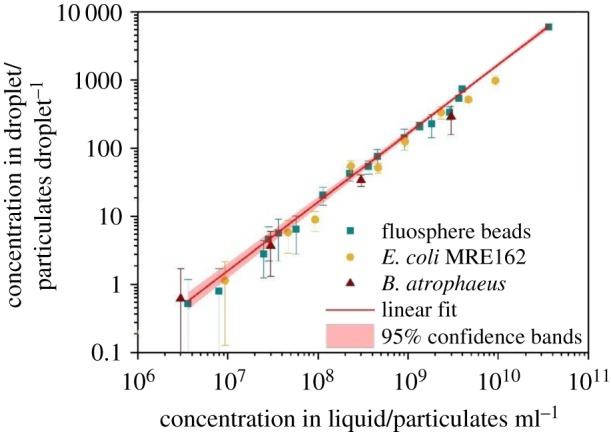
Correlation between the number of cells per droplet (i.e. fluospheres, bacteria and spores) and the cell concentration of the suspension loaded in the DoD dispenser. (Online version in colour.)
Independent of particulate type (fluorescent bead, bacteria or spore), the correlational data in figure 4 between the number of particulates in the bulk solution and the number delivered in each aerosol droplet indicate that the droplet composition can be varied reliably over a wide range in concentration. Such a capability makes it possible to explore the role microbial concentration in bioaerosol droplets plays in the airborne transmission of infection. The effect of droplet size and microbial concentration in bioaerosol droplets has been previously investigated showing a significant impact on airborne survival [49]. Additionally, the monodispersity (i.e. reproducibility) of the aerosol generated by the DoD dispenser allows investigation of solute stresses on microorganisms incorporated in the droplets. Contrary to polydisperse bioaerosols, monodisperse droplets achieve the same microbial concentration and are therefore expected to create a homogeneous biological response whose average represents the behaviour of all aerosolized microorganisms across the population.
3.1.1. Probability distribution function for low microbial cell concentration in bioaerosol droplets
The number of particulates (i.e. 1 µm yellow-green fluospheres, E. coli MRE-162 cells and B. atrophaeus spores) within bioaerosol droplets must be described by the Poisson distribution (equation (2.2)) for loaded suspensions with particle concentrations less than 108 CFU ml−1. In this case, the volume fraction of the particulates within a droplet generated by the DoD is very small and, indeed, the presence of cells can even be a rare event at sufficiently low concentrations. As particle concentration increases, the probability that aerosol droplets contain a larger number of particulates increases proportionally, and the PDF curves move towards a Gaussian distribution. We illustrate this transition for the three types of particles (i.e. fluospheres, E. coli MRE-162 cells and B. atrophaeus spores) in figure 5, with the curves indicating the fitted Poisson distributions.
Figure 5.
PDF curves, experimental results and confocal microscopy images for particle concentration in aerosol droplets. Scale bar, 30 µm. Diameters of the deposited droplets are larger than the initial droplet sizes due to impaction on the gelatin used to coat the microscope slides. (a) Modelled curves and experimental results for the number of fluospheres per aerosol droplet. The PDFs for the averages of fluospheres per droplet, λ = 0.795, λ = 2.62, λ = 5.70 and λ = 20.6, are shown by the black, yellow, maroon and turquoise curves, respectively. Observed percentages for the number of beads per droplet are (•), (*), (Δ) and (○) at solution concentrations of 8.0 × 10⁶, 2.5 × 10⁷, 3.64 × 10⁷ and 1.14 × 10⁸ cells ml−1, respectively. (b) Modelled curves and experimental results for the number of E. coli MRE-162 cells per aerosol droplet. The PDFs for λ = 1.14, λ = 5.83, λ = 8.96 and λ = 51.3 are shown by the black, yellow, maroon and turquoise curves, respectively. Observed percentages for the number of bacteria cells per droplet are (•), (*), (Δ) and (○) at solution concentrations of 9.32 × 10⁶, 4.66 × 10⁷, 9.32 × 10⁷ and 4.66 × 10⁸ CFU ml−1, respectively. (c) Modelled curves and experimental results for the number of B. atrophaeus spores per aerosol droplet. The PDFs for λ = 0.54, λ = 3.09 and λ = 31.49 are shown by the black, yellow and turquoise curves, respectively. Observed percentages for the number of spores per droplet (•), (*) and (○) at solution concentrations of 3.0 × 10⁶, 3.0 × 10⁷ and 3.0 × 10⁸ cells ml−1, respectively. (d–f) Confocal microscopy images for different particle concentrations in aerosol droplets containing fluospheres beads, E. coli MRE-162 cells and B. atrophaeus spores, respectively. (Online version in colour.)
3.2. Determining the effect of aerosolization on bacteria viability
Aerosolization may cause damage to bacterial cell structure [29]. The percentages of E. coli MRE162 cells possessing intact membranes were obtained for cultures subjected to two methods of aerosolization (the DoD and the 1-jet refluxing nebulizer), as well as for the non-aerosolized control sample. A stationary phase culture of E. coli MRE162 (1.7 ± 0.7 × 10⁹ CFU ml−1), was split into two samples for aerosolization using the two different aerosol generators to demonstrate any effect of aerosolization on bacterial membrane integrity. Controls included untreated stationary phase and ethanol-killed non-aerosolized E. coli. The aerosolized bacteria and control were stained immediately after collection following the procedure described in the electronic supplementary material, §2. The control showed a high percentage of green-fluorescing viable cells (99 ± 1%).
Firstly, measurements examined the dependence of bacterial viability on the waveform parameters applied to the DoD required to generate droplets (i.e. pulse voltage, frequency and width) and the DC voltage applied to the induction electrode (figure 6). A comparative study was performed by examining the influence of standard (low) and magnified (high) values of all parameters involved in droplet generation. Droplets were collected into an Eppendorf tube containing 10 µl of LB broth and the dye mixture described below for viability analysis. Secondly, bioaerosol droplets were generated from 150 ml of the bacterial culture using a 1-jet refluxing nebulizer for 20 min at 30 psi pressure to assess the effect of nebulization on bacterial viability. Samples were collected from the refluxed bacterial culture remaining in the liquid reservoir of the nebulizer at 5 and 20 min.
Figure 6.
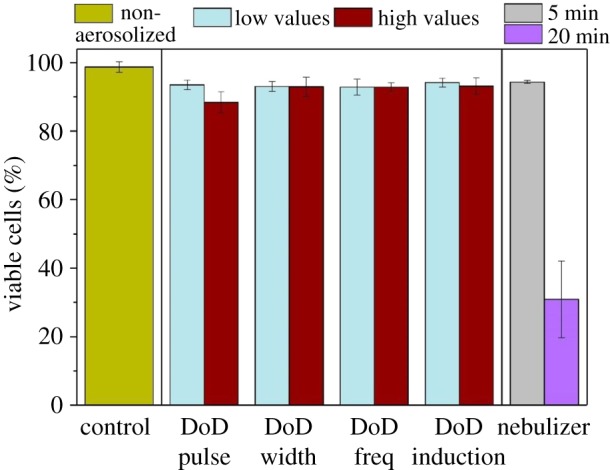
Percentage of cells with intact cell membranes obtained by using different aerosolization devices. In consecutive order, bars represent for each set of values: the non-aerosolized control (green) bacterial culture, the bacterial culture aerosolized by using the DoD with a pulse voltage of 3.5 and 8 V (blue), a frequency of 10 and 1000 Hz (pink), a width of 25 and 45 µs (yellow) and an induction voltage of 250 and 1050 V (grey), respectively. Finally, the refluxed bacterial culture after 5- and 20-min nebulization by using the 1-jet refluxing nebulizer, respectively, are shown (maroon). The average and standard deviation for each parameter were calculated by counting at least 200 cells from five different fields of view. (Online version in colour.)
No significant difference between control cells and those aerosolized using the low and high values of the waveform and induction electrode parameters was observed. By contrast, bacteria experiencing conditions within the 1-jet refluxing nebulizer demonstrated significant effects on membrane integrity. Membrane integrity decreased markedly as a function of time, from 100% ± 1% to 33% ± 12% at 20 min nebulization time, respectively. Assuming the aerosol generated with the 1-jet refluxing nebulizer is a direct sample of the culture contained in the reservoir, then the aerosolized bacteria would show the same proportion of adversely affected cells. This difference is a result of fundamental differences between the aerosolization mechanisms. Piezoelectric aerosolization using the DoD dispenser does not involve high pressures or recirculation of the sample contained in the reservoir, reducing stresses associated with shear forces and wall impaction, characteristic of reflux nebulization systems. In addition, the larger volume of the droplets generated by the DoD in comparison with the size of the enclosed bacterial cells may mitigate shear forces providing a greater proportion of bacterial cells assessed as having intact membranes [50].
3.3. Determining the effect of electrodynamic levitation on bacterial viability
The effect of the AC field on the viability of bacteria contained in droplets and suspended in the EDT chamber was investigated. Droplets were initially generated with a size of 27.8 ± 0.08 µm in radius, determined from measurements with the Comparative Kinetics Electrodynamic Balance (CK-EDB) system [51]. An example of the size measurement made using the CK-EDB is provided in the electronic supplementary material, §5 and figure S1. The CFUs per droplet generated from an E. coli culture (1.7 ± 0.9 × 10⁸ CFU ml−1) aerosolized and levitated for 5 s in the AC field were compared with the estimated value of the number of bacteria cells per droplet for that culture concentration (following the linear correlation reported in figure 4). Assuming that aerosol generation, 5-s suspension and sampling would not impact the microbial viability when using the CELEBS system, the experimental and estimated values of bacterial cells/CFUs in the droplets should be equivalent. Ten replicates of brief levitation (less than 5 s) were performed consecutively under the same conditions (50 ± 2% RH and 24 ± 1°C temperature). The number of CFUs per droplet obtained after levitation and incubation (39.2 ± 24.4) compares well with the calculated number of bacterial cells per droplet (43.5 ± 20.8). The concurrence between both bacterial concentrations shows that the culturability of E. coli cells in solid media was not significantly affected by short suspension periods in the AC field (2 kV) (figure 7). The impact of electric fields on microbial viability has been previously shown to not reduce the culturability of at least three different bacterial species exposed to an electric field of 4.2 kV as long as 2 h [45].
Figure 7.
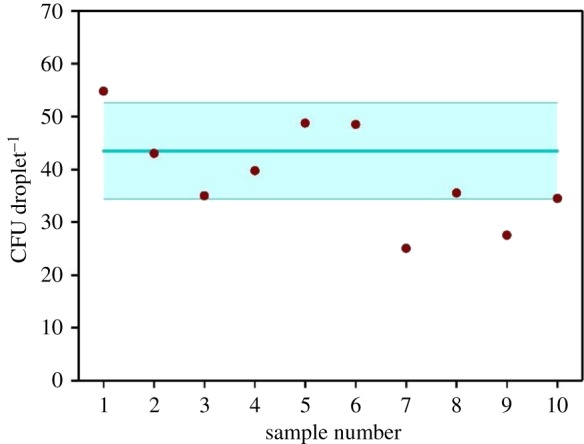
Effect of suspension in the AC field (2 kV) on the viability of E. coli incorporated in droplets of 27.8 ± 0.08 µm radii. The graph shows the relationship between the predicted number of CFU per droplet (≡) (mean ± s.d.) and the number of CFU per droplet formed after the incubation of bioaerosol populations levitated in the EDT for 5 s (•). (Online version in colour.)
3.4. Evaluation of sampling efficiency
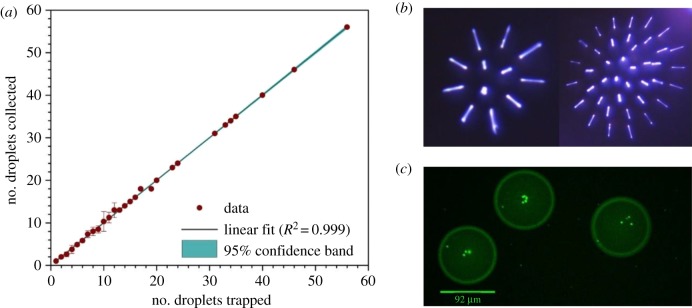
The correlation between the number of droplets trapped in the EDT and the number of droplets ejected from the AC field and collected in an empty plastic Petri dish was measured (figure 8). The populations of particles collected in each Petri dish were counted with a conventional microscope and compared to the number of droplets levitated. This relationship was determined for four different types of biological and non-biological particles: droplets made of a suspension of 3.6 × 10⁹ fluospheres ml−1 in LB broth; a FITC-labelled E. coli MRE-162 culture in stationary phase; a 20% NaCl solution in DI water and a 20% sucrose solution in DI water.
Figure 8.
(a) Sampling efficiency of the CELEBS apparatus. Each data point represents a single experiment showing the correlation between the number of droplets levitated and the number of droplets collected. (b) Images of different sizes of bioaerosol populations levitated inside the EDT (left image 12 and right image 40 bioaerosol droplets). (c) Representative image of droplets containing fluospheres collected on the substrate immediately after aerosolization. The actual size of the particles at generation was measured with the CK-EDB system (27.8 ± 0.08 µm radii) [51]. The enlarged diameter of the impacted droplets provided by the image software is due to droplet spread at impaction on the coated gelatin slide. (Online version in colour.)
The efficient particle collection of the CELEBS technology, together with the generation of droplets with high reproducibility in size and biological composition (i.e. number of microorganisms enclosed within the droplets), allows quantification of the absolute number of microorganisms probed in each experiment.
3.5. Bioaerosol decay of bacteria exposed to 30% relative humidity
To measure the aerobiological decay rate, it is important to first confirm that negligible physical loss of particles occurs inside the EDT chamber during particle levitation. Bacillus spores are commonly used as physical tracers to distinguish between the BD and physical loss in aerosol systems because they remain viable under a wide range of environmental conditions [52–54]. Therefore, to evaluate the physical loss of particles during suspension, B. atrophaeus spores (triple washed in distilled water) were diluted 10-fold in PBS (6.5 ± 2.5 × 10⁸ spores ml−1), aerosolized and captured in the CELEBS for 1 h (33 ± 2% RH, 23 ± 2°C). The initial droplet size and spore concentration were 25 ± 0.25 µm radius and 65 ± 12 spore cells per droplet, respectively.
In addition, E. coli MRE162 was cultured to stationary phase in LB broth (24 h, 180 rpm, 37°C) and diluted 10-fold (2.1 ± 0.2 × 10⁸ CFU ml−1). Bioaerosols produced with the DoD and suspended for different time periods (i.e. 2, 5, 10, 15, 20, 30 and 60 min) under similar atmospheric conditions (33 ± 0.91% RH, 24 ± 1°C) to measure airborne bacterial survival as the ability to form a CFU on collection. The initial particle size was 27.8 ± 0.08 µm radius and microbial concentration of 23 ± 11 bacterial cells per droplet.
The BD rates of B. atrophaeus and E. coli MRE162 are referenced to initial control measurements at 2 min and 30 s, respectively, as shown in figure 9. The physical loss of particles as a function of time is absent in the CELEBS system over the timescale of an hour because the number of spores does not decay; therefore, only the BD needs to be considered when performing ageing experiments. Consequently, it is possible to directly evaluate the microbial response to specific atmospheric conditions without comparing decay rates between the microorganism of interest and physical tracers.
Figure 9.
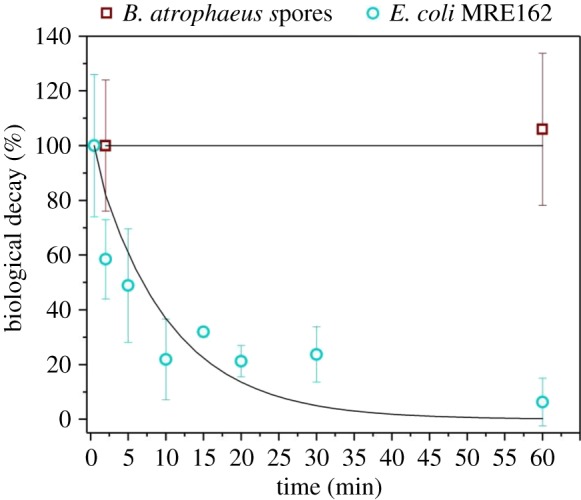
Bioaerosol decay for E. coli MRE162 and B. atrophaeus spores at 33% RH and 24°C temperature. All the longevity data are expressed as the average and standard deviation values for at least three biological replicates (samples from independent E. coli cultures) per experiment. (Online version in colour.)
The interpretation and comparison of data from aerosol longevity studies in the literature are not easy due to the diversity of the employed methodologies (generation and sampling), biological species, bioaerosol composition and atmospheric conditions used. Our data show a 41.5% decrease in recovered E. coli MRE162 cells within the first 2 min of aerosol suspension, followed by a less-pronounced decay. The rapid 2-min decline may be due to evaporative cooling and mass transfer processes experienced within the droplets during the early stages of the aerosol state until equilibrium is reached. Bi-phasic decay has been previously reported in the literature, demonstrating that the majority of decay occurs within the first 1–2 min of aerosol suspension [54,55]. Interestingly, previous studies spraying E. coli K12 from distilled water have compared survival between nitrogen and air atmospheres. Results reported 10% survival at 35% RH and 26°C after 30 min of suspension and collection in PBS [56]. Our methodology reported 24% survival at the same aerosol age. Differences may be due to the presence of dissolved solids in the LB broth together with the reduced impact of stresses during generation and sampling. Comparison between these results highlights the value in understanding methodology and validation in bioaerosol research which is critical to facilitate the interpretation of data and standardization between laboratories.
4. Conclusion
We have presented a new methodology for measuring BD rates in bioaerosol particles as a function of different atmospheric conditions and particle compositions (both biological and chemical). The technology couples a piezoelectric droplet dispenser with an EDT to create highly monodisperse bioaerosol droplets with defined composition followed by their suspension in an electric field under controllable atmospheric conditions. CELEBS presents an alternative approach for understanding variables that impact natural transmission mechanisms by more accurately representing initial droplet sizes generated by sneezes/coughs [21] and minimizing stresses involved in the analysis. Ultimately, this will lead to more accurate epidemiological and risk analysis modelling.
The approach we report here presents significant advantages over more conventional approaches used in bioaerosol analysis:
-
—
A quantifiable number of bioaerosol droplets containing bacteria can be generated on demand with a reproducibility in the initial droplet size of ± 0.25 µm (1 s.d.) [51] by means of a DoD micro-dispenser. Moreover, the complete chemical and biological composition of the bioaerosol droplets can be varied across several orders of magnitude (i.e. number of particulates per droplet). The DoD does not impact cell membrane integrity as measured by Syto9/PI staining and CFU determination, in contrast with the standard methodology of bioaerosol generation [26,29,57]. The technology could be applied to other microorganisms such as fungi or viruses.
-
—
CELEBS represents a valuable alternative to the rotating drum and microthread techniques. Owing to using an electric field to levitate droplets, CELEBS does not suffer from the same restrictions on droplet size and hence, airborne suspension times required to avoid physical loss of particles in rotating drums. Furthermore, the CELEBS holds the bioaerosol in the true airborne state in contrast to the microthread technique [7,16,58,59]. Short exposures (less than 5 s) to the EDT did not impact the ability of levitated microorganisms to form colonies after sampling. Hence, CELEBS incorporates a less physically damaging approach. In addition, the glass design of the EDT chamber enables the visualization and enumeration of the bioaerosol droplets during suspension. Future studies using CELEBS will explore its accessibility to a wider range of atmospheric parameters (i.e. relative humidity, temperature, gaseous species, UV light, etc.).
-
—
High sampling flow rates and long sampling times can reduce the viability of collected microorganisms [46,60,61]. The sampling mechanism in CELEBS based on electrostatic forces uses particle velocities perpendicular to the collection substrate similar to the ones involved in electrostatic precipitation, which are two to four orders of magnitude lower than collection velocities used in more standard aerosol samplers (i.e. impactors, filters and impingements) [44]. This presents a new ‘gentle’ alternative for microbial collection potentially more representative of the natural mechanisms in the environment. Moreover, the population of bioaerosol droplets can be sampled onto a platform containing any type of substrate (e.g. culture media, lung tissue cells, bacteria cells, etc.) enabling numerous options for viability and infectivity analysis.
-
—
The small and open design of the EDT trap offers other advantages in terms of flexibility and easy manipulation of the instrument, particularly for research in microbiological containment. The capability to study multiple types of bioaerosol concurrently by ‘daisy-chaining’ multiple levitation chambers together is both advantageous and unique to this methodology.
-
—
The small volume of sample required (approx. 10 µl) and the small number of the bioaerosol droplets generated, enable the safe study of airborne microorganisms in a highly controlled fashion. The likelihood of being exposed to infectious doses of microorganisms is dramatically reduced.
-
—
We have demonstrated the utility of CELEBS to probe the longevity of bioaerosols using E. coli MRE162. Moving forward, the physico-chemical properties and dynamic behaviour of the particles produced with a DoD dispenser can be probed via alternative methods, such as a comparative kinetic electrodynamic balance [51,62]. Understanding the processes that drive changes in the physico-chemical properties of bioaerosols (i.e. hygroscopicity, surface tension, viscosity, etc.) will enable exploration of the impact of these properties on bioaerosol longevity. This will be a fundamentally new and comprehensive approach to studying the transmission of infectious microorganisms in the aerosol phase [62,63]. Indeed, we also anticipate that this device will be ideally suited to studying the influence of atmospheric oxidants on the viability of bacteria in the aerosol phase.
In conclusion, CELEBS represents a new tool for bioaerosol longevity studies with the potential to elucidate the fundamentals of airborne disease dynamics by implementing several benefits to existing technologies.
Supplementary Material
Acknowledgements
We thank the Wolfson Bioimaging Facility for its contribution in acquiring the confocal microscopy data used in this work.
Data accessibility
Data are available at the University of Bristol data repository, data.bris, at https://doi.org/10.5523/bris.1hdewkfoo17yh291d2y5c2sye6.
Authors' contributions
M.O., R.J.T. and A.E.H. carried out the laboratory work, participated in data analysis, contributed to the design of the study and drafted the manuscript; N.J.G. and A.H. contributed to the design of the study and drafted the manuscript; A.E.H. and J.P.R. are joint corresponding authors, they conceived the study, designed and coordinated the study and finalized the manuscript for publication.
Competing interests
We declare we have no competing interests.
Funding
The authors recognize the Natural Environment Research Council (NERC) and the Defence Science and Technology Laboratory (DSTL) for financial support through studentship funding.
References
- 1.Fröhlich-Nowoisky J, et al. 2016. Bioaerosols in the Earth system: climate, health, and ecosystem interactions. Atmos. Res. 182, 346–376. ( 10.1016/j.atmosres.2016.07.018) [DOI] [Google Scholar]
- 2.Estillore AD, et al. 2016. Atmospheric chemistry of bioaerosols: heterogeneous and multiphase reactions with atmospheric oxidants and other trace gases. Chem. Sci. 7, 6604–6616. ( 10.1039/C6SC02353C) [DOI] [PMC free article] [PubMed] [Google Scholar]
- 3.Morris CE, et al. 2011. Microbiology and atmospheric processes: research challenges concerning the impact of airborne micro-organisms on the atmosphere and climate. Biogeosciences 8, 17–25. ( 10.5194/bg-8-17-2011) [DOI] [Google Scholar]
- 4.Douwes J, Thorne PS, Heederik D. 2003. Monitoring and evaluation of bioaerosol exposure. Tijdschrift voor toegepaste Arbowetenschap 1, 39–42. [Google Scholar]
- 5.Walser SM, et al. 2015. Evaluation of exposure–response relationships for health effects of microbial bioaerosols—a systematic review. Int. J. Hyg. Environ. Health 218, 577–589. ( 10.1016/j.ijheh.2015.07.004) [DOI] [PubMed] [Google Scholar]
- 6.Douwes J, Thorne P, Pearce N, Heederik D. 2003. Bioaerosol health effects and exposure assessment: progress and prospects. Ann. Occup. Hyg. 47, 187–200. [DOI] [PubMed] [Google Scholar]
- 7.Verreault D, Duchaine C, Marcoux-Voiselle M, Turgeon N, Roy CJ. 2014. Design of an environmentally controlled rotating chamber for bioaerosol aging studies. Inhal. Toxicol. 26, 554–558. ( 10.3109/08958378.2014.928763) [DOI] [PMC free article] [PubMed] [Google Scholar]
- 8.Lighthart B, Shaffer BT. 2017. Increased airborne bacterial survival as a function of particle content and size. 6826.
- 9.Tang JW. 2009. The effect of environmental parameters on the survival of airborne infectious agents. J. R. Soc. Interface 6, S737–S746. ( 10.1098/rsif.2009.0227.focus) [DOI] [PMC free article] [PubMed] [Google Scholar]
- 10.Power RM, Simpson SH, Reid JP, Hudson AJ. 2013. The transition from liquid to solid-like behaviour in ultrahigh viscosity aerosol particles. Chem. Sci. 4, 2597 ( 10.1039/c3sc50682g) [DOI] [Google Scholar]
- 11.Haddrell AE, Hargreaves G, Davies JF, Reid JP. 2013. Control over hygroscopic growth of saline aqueous aerosol using Pluronic polymer additives. Int. J. Pharm. 443, 183–192. ( 10.1016/j.ijpharm.2012.12.039) [DOI] [PubMed] [Google Scholar]
- 12.Bain RM, Pulliam CJ, Cooks RG. 2015. Accelerated Hantzsch electrospray synthesis with temporal control of reaction intermediates. Chem. Sci. 6, 397–401. ( 10.1039/C4SC02436B) [DOI] [PMC free article] [PubMed] [Google Scholar]
- 13.Lee JK, Kim S, Nam HG, Zare RN. 2015. Microdroplet fusion mass spectrometry for fast reaction kinetics. Proc. Natl Acad. Sci. USA 112, 3898–3903. ( 10.1073/pnas.1503689112) [DOI] [PMC free article] [PubMed] [Google Scholar]
- 14.Girod M, Moyano E, Campbell DI, Cooks RG. 2011. Accelerated bimolecular reactions in microdroplets studied by desorption electrospray ionization mass spectrometry. Chem. Sci. 2, 501–510. ( 10.1039/C0SC00416B) [DOI] [Google Scholar]
- 15.Goldberg LJ, Watkins HM, Boerke EE, Chatigny MA. 1958. The use of a rotating drum for the study of aerosols over extended periods of time. Am. J. Hyg. 68, 85–93. [DOI] [PubMed] [Google Scholar]
- 16.Gruel RL, Reid CR, Allemann RT. 1987. The optimum rate of drum rotation for aerosol aging. J. Aerosol Sci. 18, 17–22. ( 10.1016/0021-8502(87)90004-8) [DOI] [Google Scholar]
- 17.Asgharian B, Moss OR. 1992. Particle suspension in a rotating drum chamber when the influence of gravity and rotation are both significant. Aerosol Sci. Technol. 17, 263–277. ( 10.1080/02786829208959575) [DOI] [Google Scholar]
- 18.Benbough JE. 1967. Death mechanisms in airborne Escherichia coli. J. Gen. Microbiol. 47, 325–333. ( 10.1099/00221287-47-3-325) [DOI] [PubMed] [Google Scholar]
- 19.Lever MS, Williams A, Bennett AM. 2000. Survival of mycobacterial species in aerosols generated from artificial saliva. Lett. Appl. Microbiol. 31, 238–241. ( 10.1046/j.1365-2672.2000.00807.x) [DOI] [PubMed] [Google Scholar]
- 20.Loudon RG, Bumgarner LR, Lacy J, Coffman GK. 1969. Aerial transmission of mycobacteria. Am. Rev. Respir. Dis. 100, 165–171. [DOI] [PubMed] [Google Scholar]
- 21.Han ZY, Weng WG, Huang QY. 2013. Characterizations of particle size distribution of the droplets exhaled by sneeze characterizations of particle size distribution of the droplets exhaled by sneeze. J. R. Soc. Interface 10, 20130560 ( 10.1098/rsif.2013.0560) [DOI] [PMC free article] [PubMed] [Google Scholar]
- 22.Haddrell AE, Thomas RJ. 2017. Aerobiology: experimental considerations, observations, and future tools. Appl. Environ. Microbiol. 83, 1–17. ( 10.1128/AEM.00809-17) [DOI] [PMC free article] [PubMed] [Google Scholar]
- 23.Wright S, Goodacre SL. 2012. Evidence for antimicrobial activity associated with common house spider silk. BMC Res. Notes 5, 1–6. [DOI] [PMC free article] [PubMed] [Google Scholar]
- 24.Dabisch P, et al. 2012. Comparison of the efficiency of sampling devices for aerosolized Burkholderia pseudomallei. Inhal. Toxicol. 24, 247–254. ( 10.3109/08958378.2012.666682) [DOI] [PubMed] [Google Scholar]
- 25.Zhen H, Han T, Fennell DE, Mainelis G. 2013. Release of free DNA by membrane-impaired bacterial aerosols due to aerosolization and air sampling. Appl. Environ. Microbiol. 79, 7780–7789. ( 10.1128/AEM.02859-13) [DOI] [PMC free article] [PubMed] [Google Scholar]
- 26.Reponen T, Willeke K, Ulevicius V, Grinshpun SA, Donnelly J. 1997. Techniques for dispersion of microorganisms into air. Aerosol Sci. Technol. 27, 405–421. ( 10.1080/02786829708965481) [DOI] [Google Scholar]
- 27.Thomas RJ, et al. 2011. The cell membrane as a major site of damage during aerosolization of Escherichia coli. Appl. Environ. Microbiol. 77, 920–925. ( 10.1128/AEM.01116-10) [DOI] [PMC free article] [PubMed] [Google Scholar]
- 28.Hambleton P. 1971. Repair of wall damage in Escherichia coli recovered from an aerosol. J. Gen. Microbiol. 69, 81–88. ( 10.1099/00221287-69-1-81) [DOI] [PubMed] [Google Scholar]
- 29.Zhen H, Han T, Fennell DE, Mainelis G. 2014. A systematic comparison of four bioaerosol generators: affect on culturability and cell membrane integrity when aerosolizing Escherichia coli bacteria. J. Aerosol Sci. 70, 67–79. ( 10.1016/j.jaerosci.2014.01.002) [DOI] [Google Scholar]
- 30.Li C-S. 1999. Evaluation of microbial samplers for bacterial microorganisms. Aerosol Sci. Technol. 30, 100–108. ( 10.1080/027868299304705) [DOI] [Google Scholar]
- 31.Grinshpun SA, et al. 1997. Effect of impaction, bounce and reaerosolization on the collection efficiency of impingers. Aerosol Sci. Technol. 26, 326–342. ( 10.1080/02786829708965434) [DOI] [Google Scholar]
- 32.Dabisch P, Bower K, Dorsey B, Wronka L. 2012. Recovery efficiencies for Burkholderia thailandensis from various aerosol sampling media. Front. Cell. Infect. Microbiol. 2, 78 ( 10.3389/fcimb.2012.00078) [DOI] [PMC free article] [PubMed] [Google Scholar]
- 33.Kesavan J, Schepers D, McFarland AR. 2010. Sampling and retention efficiencies of batch-type liquid-based bioaerosol samplers. Aerosol Sci. Technol. 44, 817–829. ( 10.1080/02786826.2010.497513) [DOI] [Google Scholar]
- 34.Paul W. 1990. Electromagnetic traps for charged and neutral particles (Nobel lecture). Angew. Chem. Int. Ed. English 29, 739–748. ( 10.1002/anie.199007391) [DOI] [Google Scholar]
- 35.Fan K-C, Chen J-Y, Wang C-H, Pan W-C. 2008. Development of a drop-on-demand droplet generator for one-drop-fill technology. Sensors Actuat. A Phys. 147, 649–655. ( 10.1016/j.sna.2008.03.006) [DOI] [Google Scholar]
- 36.Haddrell AE, Davies JF, Yabushita A, Reid JP. 2012. Accounting for changes in particle charge, dry mass and composition occurring during studies of single levitated particles. J. Phys. Chem. A 116, 9941–9953. ( 10.1021/jp304920x) [DOI] [PubMed] [Google Scholar]
- 37.Davis EJ, Buehler MF, Ward TL. 1990. The double-ring electrodynamic balance for microparticle characterization. Rev. Sci. Instrum. 61, 1281–1288. ( 10.1063/1.1141227) [DOI] [Google Scholar]
- 38.Bogan MJ, Agnes GR. 2002. MALDI-TOF-MS analysis of droplets prepared in an electrodynamic balance: ‘wall-less’ sample preparation. Anal. Chem. 74, 489–496. ( 10.1021/ac015638n) [DOI] [PubMed] [Google Scholar]
- 39.Haddrell AE, Ishii H, van Eeden SF, Agnes GR. 2005. Apparatus for preparing mimics of suspended particles in the troposphere and their controlled deposition onto individual lung cells in culture with measurement of downstream biological response. Anal. Chem. 77, 3623–3628. ( 10.1021/ac048112m) [DOI] [PubMed] [Google Scholar]
- 40.Bogan MJ, Agnes GR. 2004. Wall-less sample preparation of μm-sized sample spots for femtomole detection limits of proteins from liquid based UV-MALDI matrices. J. Am. Soc. Mass Spectrom. 15, 486–495. ( 10.1016/j.jasms.2003.11.012) [DOI] [PubMed] [Google Scholar]
- 41.Davis EJ. 1997. A history of single aerosol particle levitation. Aerosol Sci. Technol. 26, 212–254. ( 10.1080/02786829708965426) [DOI] [Google Scholar]
- 42.Heinisch C, Wills JB, Reid JP, Tschudi T, Tropea C. 2009. Temperature measurement of single evaporating water droplets in a nitrogen flow using spontaneous Raman scattering. Phys. Chem. Chem. Phys. 11, 9720–9728. ( 10.1039/b908555f) [DOI] [PubMed] [Google Scholar]
- 43.Mainelis G, et al. 2001. Electrical charges on airborne microorganisms. J. Aerosol Sci. 32, 1087–1110. ( 10.1016/S0021-8502(01)00039-8) [DOI] [Google Scholar]
- 44.Mainelis G, Willeke K, Adhikari A, Reponen T, Grinshpun SA. 2002. Design and collection efficiency of a new electrostatic precipitator for bioaerosol collection design and collection effciency of a new electrostatic precipitator for bioaerosol collection. Aerosol Sci. Technol. 36, 1073–1085. ( 10.1080/02786820290092212) [DOI] [Google Scholar]
- 45.Mainelis G, et al. 1999. Collection of airborne microorganisms by electrostatic precipitation. Aerosol Sci. Technol. 30, 127–144. ( 10.1080/027868299304732) [DOI] [Google Scholar]
- 46.Juozaitis A, Willeke K, Grinshpun SA, Donnelly J. 1994. Impaction onto a glass slide or agar versus impingement into a liquid for the collection and recovery of airborne microorganisms. Appl. Environ. Microbiol. 60, 861–870. [DOI] [PMC free article] [PubMed] [Google Scholar]
- 47.Hambleton P. 1970. The sensitivity of Gram-negative bacteria, recovered from aerosols, to lysozyme and other hydrolytic enzymes. J. Gen. Microbiol. 61, 197–204. ( 10.1099/00221287-61-2-197) [DOI] [PubMed] [Google Scholar]
- 48.Grinshpun SA. 2010. Method for studying survival of airborne viable microorganisms in combustion environments: development and evaluation. Aerosol Air Qual. Res. 10, 414–424. ( 10.4209/aaqr.2010.05.0041) [DOI] [Google Scholar]
- 49.Lighthart B, Shaffer BT. 1997. Increased airborne bacterial survival as a function of particle content and size. Aerosol Sci. Technol. 27, 439–446. ( 10.1080/02786829708965483) [DOI] [Google Scholar]
- 50.Moon S, Ceyhan E, Gurkan UA, Demirci U. 2011. Statistical modeling of single target cell encapsulation. PLoS One 6, e21580 ( 10.1371/journal.pone.0021580) [DOI] [PMC free article] [PubMed] [Google Scholar]
- 51.Davies JF, Haddrell AE, Reid JP. 2012. Time-resolved measurements of the evaporation of volatile components from single aerosol droplets. Aerosol Sci. Technol. 46, 666–677. ( 10.1080/02786826.2011.652750) [DOI] [Google Scholar]
- 52.Cox CS, Derr JS, Flurie EG, Roderick RC. 1970. Experimental technique for studying aerosols of lyophilized bacteria. Appl. Microbiol. 20, 927–934. [DOI] [PMC free article] [PubMed] [Google Scholar]
- 53.Marthi B, Fieland VP, Walter M, Seidler RJ. 1990. Survival of bacteria during aerosolization. Appl. Environ. Microbiol. 56, 3463–3467. [DOI] [PMC free article] [PubMed] [Google Scholar]
- 54.Cox CS. 1971. Aerosol survival of Pasteurella tularensis disseminated from the wet and dry states. Appl. Microbiol. 21, 482–486. [DOI] [PMC free article] [PubMed] [Google Scholar]
- 55.Wathes CM, Howard K, Webster AJ. 1986. The survival of Escherichia coli in an aerosol at air temperatures of 15 and 30°C and a range of humidities. J. Hyg. (Lond.) 97, 489–496. ( 10.1017/S0022172400063671) [DOI] [PMC free article] [PubMed] [Google Scholar]
- 56.Cox CS. 1968. The aerosol survival and cause of death of Escherichia coli K12. Microbiology 54, 169–175. [DOI] [PubMed] [Google Scholar]
- 57.Adams DJ, Spendlove JC, Spendlove RS, Barnett BB. 1982. Aerosol stability of infectious and potentially infectious reovirus particles. Appl. Environ. Microbiol. 44, 903–908. [DOI] [PMC free article] [PubMed] [Google Scholar]
- 58.May KR, Druett HA. 1968. A microthread technique for studying the viability of microbes in a simulated airborne state. J. Gen. Microbiol. 51, 353–366. ( 10.1099/00221287-51-3-353) [DOI] [PubMed] [Google Scholar]
- 59.Smither SJ, Piercy TJ, Eastaugh L, Steward JA, Lever MS. 2011. An alternative method of measuring aerosol survival using spiders' webs and its use for the filoviruses. J. Virol. Methods 177, 123–127. ( 10.1016/j.jviromet.2011.06.021) [DOI] [PubMed] [Google Scholar]
- 60.McFeters GA, Cameron SC, LeChevallier MW. 1982. Influence of diluents, media, and membrane filters on detection of injured waterborne coliform bacteria. Appl. Environ. Microbiol. 43, 97–103. [DOI] [PMC free article] [PubMed] [Google Scholar]
- 61.Buttner MP, Stetzenbach LD. 1991. Evaluation of four aerobiological sampling methods for the retrieval of aerosolized Pseudomonas syringae. Appl. Environ. Microbiol. 57, 1268–1270. [DOI] [PMC free article] [PubMed] [Google Scholar]
- 62.Davies JF, Haddrell AE, Rickards AMJ, Reid JP. 2013. Simultaneous analysis of the equilibrium hygroscopicity and water transport kinetics of liquid aerosol. Anal. Chem. 85, 5819–5826. ( 10.1021/ac4005502) [DOI] [PubMed] [Google Scholar]
- 63.Davies JF, Miles REH, Haddrell AE, Reid JP. 2014. Temperature dependence of the vapor pressure and evaporation coefficient of supercooled water. J. Geophys. Res. Atmos. 119, 10931–10940. ( 10.1002/2014JD022093) [DOI] [Google Scholar]
Associated Data
This section collects any data citations, data availability statements, or supplementary materials included in this article.
Supplementary Materials
Data Availability Statement
Data are available at the University of Bristol data repository, data.bris, at https://doi.org/10.5523/bris.1hdewkfoo17yh291d2y5c2sye6.


