

Abstract
Purpose:
To retrospectively determine the optimal b-value(s) of diffusion-weighted imaging (DWI) associated with intermediate–high risk cancer in the peripheral zone (PZ) of the prostate.
Materials and Methods:
Forty-two consecutive patients underwent multi b-value (16 evenly spaced b-values between 0 and 2000 s/mm2) DWI along with multi-parametric MRI (MP-MRI) of the prostate at 3 Tesla followed by trans-rectal ultrasound/MRI fusion guided targeted biopsy of suspicious lesions detected at MP-MRI. Computed DWI images up to a simulated b-value of 4000 s/mm2 were also obtained using a pair of b-values (b = 133 and 400 or 667 or 933 s/mm2) from the multi b-value DWI. The contrast ratio of average intensity of the targeted lesions and the background PZ was determined. Receiver operator characteristic curves and the area under the curve (AUCs) were obtained for separating patients eligible for active surveillance with low risk prostate cancers from intermediate–high risk prostate cancers as per the cancer of the prostate risk assessment (CAPRA) scoring system.
Results:
The AUC first increased then decreased with the increase in b-values reaching maximum at b = 1600 s/mm2 (0.74) with no statistically significant different AUC of DWI with b-values 1067–2000 s/mm2. The AUC of computed DWI increased then decreased with the increase in b-values reaching a maximum of 0.75 around b = 2000 s/mm2. There was no statistically significant difference between the AUC of optimal acquired DWI and either of optimal computed DWI.
Conclusion:
The optimal b-value for acquired DWI in differentiating intermediate–high from low risk prostate cancers in the PZ is b = 1600 s/mm2. The computed DWI has similar performance as that of acquired DWI with the optimal performance around b = 2000 s/mm2.
Multi-parametric MRI (MP-MRI) is widely used to detect, localize, and stage prostate cancer (PCa).1–5 Diffusion weighted imaging (DWI) is an integral part of the prostate MP-MRI.6–10 ADC maps derived from DWI have not only been shown to detect PCa but also ADC values correlate with the histologic grade of PCa.10–14 However, lesions on ADC maps can be subtle and it has been observed that inclusion of high b value (HBV) DWI improves the conspicuity of PCa.15–19 Thus, HBV-DWI has been added to the recommended repertoire of sequences obtained during MP-MRI of PCa.6,7
HBV-DWI detects the increased restriction of water in the PCa relative to normal tissue without any post processing.8 In normal tissue, water diffuses freely with little or almost no MR signal in HBV-DWI. Conversely, PCa tissue has increased diffusion restriction leading to a hyperintense signal pattern on HBV-DWI. Therefore, HBV-DWI, in effect, suppresses background normal tissue while highlighting PCa, making it easier to detect.20,21 The recently published Prostate Imaging and Reporting and Data System (PI-RADSv2) criteria, recommends use of acquired or computed HBV-DWI with b-values above 1400 s/mm2 to improve the conspicuity of clinically significant cancers.6,7 Multiple studies have tested the diagnostic accuracy of HBV-DWI for the detection of PCa,15,16,18–26 however, there has been little agreement on the optimal b-value for HBV-DWI.16,20–26 Typically, the highest b-value used for HBV-DWI is 2000 s/mm2 and the most recent recommendation for HBV-DWI is 1400–2000 s/mm2.6,7 Therefore, in this manuscript, we explore a range of b-values from 0 to 2000 s/mm2 for acquired and up to 4000 s/mm2 for computed HBV-DWI to determine the optimal b-value for detecting clinically significant PCa in the peripheral zone based on quantitative contrast ratios of lesion to background.
Materials and Methods
Study Population
This retrospective, single-institution study was approved by the local institutional review board and was compliant with the Health Insurance Portability and Accountability Act. Informed consent was obtained from each patient. This study included 42 consecutive patients between March and October 2014 who underwent MP-MRI of the prostate with an additional multi b-value DWI (mbDWI) and subsequently underwent trans-rectal ultrasound (TRUS)/MRI fusion guided targeted biopsy of peripheral zone (PZ) lesions identified on MP-MRI.27 Patients were excluded for prior focal therapy of the prostate (1 patient) or excessive motion on the multi b-value DWI (2 patients). The final study population consisted of 39 patients (mean age: 64.8 years; median age = 64.1 years; range = 44.3–79.5 years) with a mean serum prostate specific antigen (PSA) of 10.20 ng/mL (median = 11.56 ng/mL; range = 6.17–39.00 ng/mL) and an average of 40.4 days between scan time and biopsy date (median = 21 days; range = 1–128 days).
MR Imaging
Prostate MP-MRI was obtained on a 3 Tesla (T) clinical MR scanner (Achieva-TX, Philips Healthcare, Best, The Netherlands) using the anterior half of a 32-channel SENSE cardiac coil (Invivo; Gainesville, FL), and an endorectal coil (ERC) (BPX-30, Medrad, Pittsburgh, PA). The ERC was placed using a semi-anesthetic gel (Lidocaine, AstraZeneca, London) while the patient was in the left lateral decubitus position. The balloon surrounding the coil was distended with perfluorocarbon (3 mol/L-Fluorinert, 3M, St. Paul, MN) to a volume of 45 mL to reduce susceptibility artifacts. The MP-MRI protocol included tri-planar T2W-MRI, axial DWI with five evenly spaced b values between 0 and 750 s/mm2 referred to as standard DWI, axial HBV-DWI with b-values of 0, 1000, and 2000 s/mm2, axial DCE MRI and whole abdomen axial T1W MRI.
Additionally, axial mbDWI with 16 evenly spaced b-values between 0 and 2000 s/mm2 (b = 0, 133, 266, 400, 533, 667, 800, 933, 1067, 1200, 1333, 1467, 1600, 1733, 1867, and 2000 s/mm2) was obtained. Gradient overplus technique for diffusion encoding was used to reduce the echo time (TE) to 58 ms for b = 2000 s/mm2. mbDWI was obtained using SENSE accelerated (SENSE factor 2) partial-Fourier (halfscan factor = 0.732), single-shot SE-EPI with TR/TE = 3990 ms/58 ms, FOV = 140 × 140 mm, scan resolution = 2.19 × 2.19 mm, recon resolution = 1.09 × 1.09 mm. A limited coverage of prostate with slice thickness/gap = 2.73 mm/0.27 mm, number of slices = 16, number of averages = 2 was used to limit the scan time to 6 min 11 s. The acquisition time was 8 seconds for b = 0 s/mm2 DWI and 24 s to acquire 3 directions of the each of the non-zero DWI.
Calculated-DWI images were also obtained using two DWI images from mbDWI.15 Calculated-DWI at a given b-value (cDWIb) is computed as follows,
| (1) |
where DWIb1 and DWI b2 are acquired DWI from mbDWI at b-values of b1 and b2, respectively. Calculated DWI was obtained for 33 b-values from 0 to 4000 s/mm2 by fixing the smaller b-value at 133 s/mm2 (the lowest non-zero acquired b-value) while the higher b-value was set at 400, 667, or 933 s/mm2 to mimic different b-value combinations used in clinical practice for calculated HBV-DWI.7,15,18,28
TRUS/MRI Fusion Biopsies and ROI Drawings
Lesions were identified prospectively on MP-MRI (triplane T2W MRI, ADC maps derived from axial DWI, b = 2000 s/mm2 DWI from axial HBV-DWI and raw DCE MRI) by the same two radiologists (B.T. with 9 years and P.L.C. with 15 years of experience in reading prostate MRI) in consensus using an in-house scoring system for all patients as part of standard clinical interpretation.4 PI-RADSv2 was not available at the data acquisition phase of this study, therefore, it was not used. Fusion-guided biopsies were performed for all identified lesions along with standard 12 core systemic biopsy. Biopsies were performed on a commercial TRUS/MRI fusion guided biopsy system (UroNav, Invivo, Gainesville, FL), where these identified lesions marked on high resolution T2W axial MRI is registered in real time with TRUS imaging plane to guide and obtained the biopsies from the lesions identified on MP-MRI. All lesions that were identified histopatho-logically as PCa from targeted biopsies were contoured on a single slice of b = 0 s/mm2 DWI from mbDWI and on a single slice of the ADC map using an open source software (Medical Image Processing, Analysis, and Visualization [MIPAV]; National Institutes of Health, Bethesda MD) In addition, the entire PZ region was also contoured on the same slice where the targeted lesion(s) was/were identified (Figure 1) for background signal measurement.
FIGURE 1:
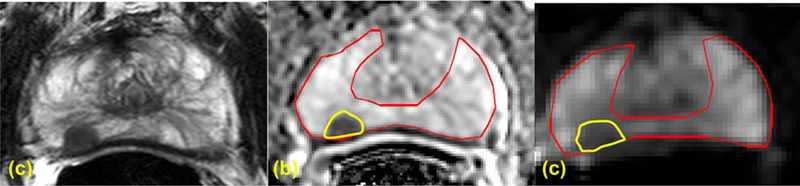
ROIs drawn for a right peripheral zone (PZ) lesion of a 61-year-old PCa patient with PSA of 5.29 ng/mL on Axial T2W MRI (A), ADC map (B), and high b value DWI acquired at b = 0 s/mm2 (C). TRUS/MRI fusion guided biopsy showed Gleason 7 (4+3) in the right PZ lesion.
PCa Classification
Biopsy specimens were evaluated by an experienced genitourinary pathologist (M.J.M., with over 20 years of experience). All PCa lesions were classified either as low or intermediate–high risk using the CAPRA scoring system.29,30 This classification was used to identify low risk patients eligible for active surveillance with PSA less than or equal to 6.0 ng/mL, less than 34% of a biopsy core involved with cancer and no primary Gleason pattern of 4 and 5.
Image Analysis
MATLAB (The MathWorks, Inc., Natick, MA) was used to perform image and some statistical analysis. The contrast between PCa and normal PZ on the same section was computed for DWI images on multi b-value DWI, 3-b-value DWI, and ADC. The contrast was defined as,
| (2) |
where Ic is the mean value over the PCa ROI and Ib is the mean value over the background PZ tissue.
Statistical Analysis
Statistical analysis was performed using R (The R Project for Statistical Computing). Performance of contrast in ADC maps obtained using standard DWI and in acquired and computed DWI images from mbDWI was evaluated using the area the under the curve (AUC) of receiver operating characteristics (ROC) analysis.31 Paired comparisons between the AUC were done using Delong method.32,33 p-values below 0.05 were considered statistically significant.
Results
The final study population of 39 patients had 53 cancers (n = 17 Gleason 6(3+3), n = 16 Gleason 7(3+4), n = 5 Gleason 7(4+3), n = 1 Gleason 8(3+5), n = 8 Gleason 8(4+4), n = 6 Gleason 9(4+5)). A total of 29 patients had one cancer lesion, 7 patients had two cancer lesions, 2 patients had 3 cancer lesions, and 1 patient had 4 cancer lesions. As per CAPRA criteria, of 53 cancer lesions, 29 cancer lesions were identified as intermediate–high risk and 24 lesions were identified as low risk cancers. Biop-sy cores rather than PSA dictated the low and intermediate–high CAPRA scoring in 10 patients with multiple cancer lesions.
The mean ROI area drawn on mbDWI was 99.4 mm2 ± 89.8 mm2 (median: 75.4 mm2; 1st and 3rd quar-tile: 41.9 mm2 and 104.7 mm2, respectively; range: 14.3– 394.8 mm2). The ADC values obtained from standard axial DWI for low and intermediate–high risk PCa were 1.1942 ± 0.2091 mm2/s and 1.0795 ± 0.2120 mm2/s, respectively. The ADC values for low risk PCa patients obtained from 133 s/mm2 and 400, 667, and 933 s/mm2 were 1.4105 ± 0.1624, 1.3269 ± 0.1433, and 1.2459 ± 0.1232 mm2/s, respectively. Similarly, the ADC values for intermediate– high risk PCa patients obtained from 133 s/mm2 and 400, 667, and 933 s/mm2 were 1.1112 ± 0.2309, 1.0282 ± 0.2144, and 0.9800 ± 0.1975 mm2/s, respectively.
Figure 2 shows the AUC of the ROC curve for differentiating intermediate–high risk PCa from low risk PCa. The AUC of contrast ratio of ADC maps obtained from standard axial DWI was 0.55. The AUC for the acquired DWI images from mbDWI increased rapidly with higher b values between b = 266 s/mm2 (AUC = 0.52) and b = 1067 s/mm2 (0.70) reaching maximum at b = 1600 s/mm2 (0.74). Beyond b = 1600 s/mm2, there is a minor decrease in AUC to 0.70 at b = 2000 s/mm2. There was no statistically significant difference between the AUC of DWI at b = 1600 s/mm2 and AUC of the acquired DWI in b-values ranging from 1067 s/mm2 to 2000 s/mm2.
FIGURE 2:
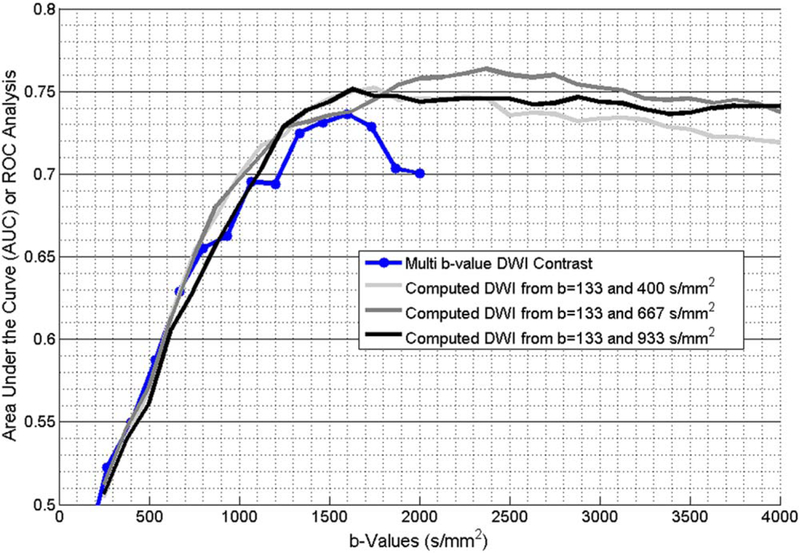
The AUC obtained from the ROC of diffusion quantitates to separate active surveillance patients with low risk PCa from active treatment patients with intermediate–high risk PCa as per CAPRA criteria. AUC was obtained for acquired mbDWI and computed DWI obtained from pair of b-values from mbDWI.
Similarly, the AUC of calculated DWI from multi b-value DWI increased rapidly with increase in b-values up to b = 1200 s/mm2 reaching maximum of 0.75 at b = 1500 s/mm2, 0.76 at b = 2125 s/mm2 and 0.75 at b = 1375 s/mm2 for b = 133 and 400 s/mm2, b = 133 and 667 s/mm2 and b = 133 and 933 s/mm2, respectively. Beyond the b-value with the highest AUC, there is a minor decrease in AUC until b = 4000 s/mm2. There is no statistically significant difference between the AUC of optimal acquired DWI at b = 1600 s/mm2 and optimal calculated DWI. Figures 3 and 4 show sample patients with low risk and intermediate–high risk PCa, respectively.
FIGURE 3:
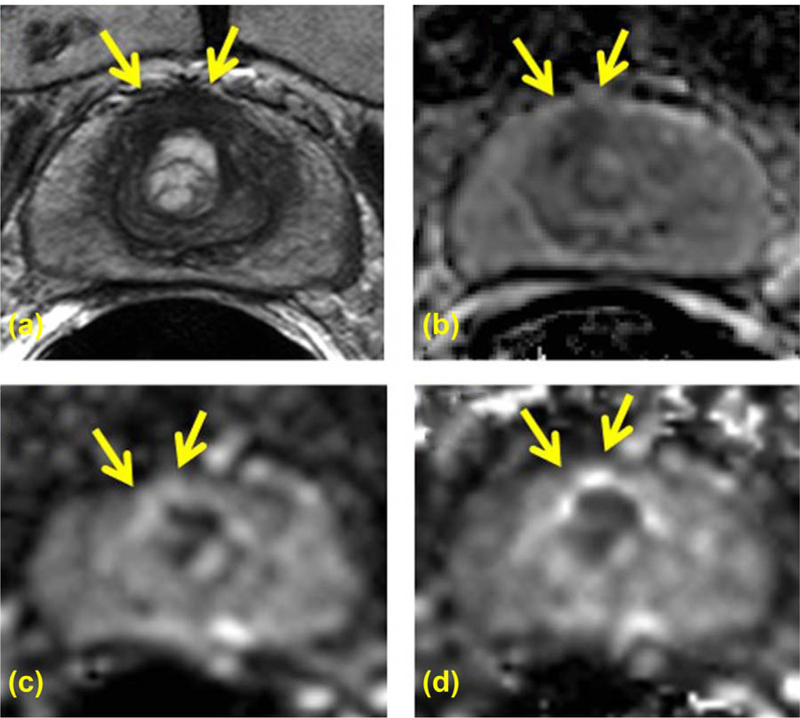
A 69-year-old PCa patient with serum PSA of 3.05 ng/mL and CAPRA scored low risk PCa in midline anterior peripheral zone is seen on axial T2W (A), ADC map (B), high b value DWI acquired at b = 1600 s/mm2 (C), and computed high b value DWI at b = 1600 s/mm2computed using acquired DWI images at b = 133 and 667 s/mm2 (D). Targeted TRUS/MRI fusion guided biopsy revealed Gleason 314 with 20% core involvement. The lesion is clearly visible on T2W MRI (A) and ADC map (B); however, it shows isointense signal pattern compared with the rest of the prostate on both acquired b = 1600 DWI (C) and computed b1600 DWI (D) (arrows).
FIGURE 4:
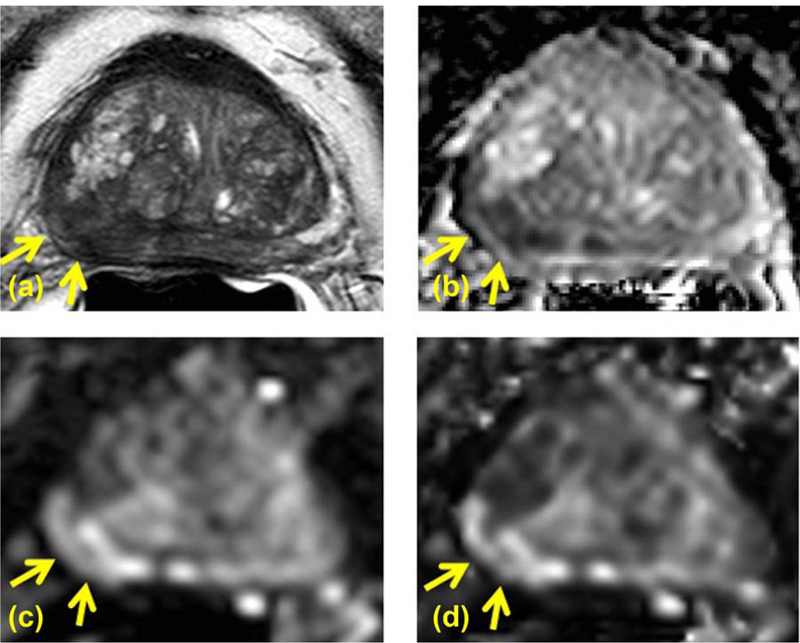
A 77-year-old PCa patient with serum PSA of 15.08 ng/mL and CAPRA scored high risk PCa in right apical-mid peripheral zone identified on axial T2W (A), ADC map (B), high b value DWI acquired at b = 1600 s/mm2 (C), and computed high b value DWI at b = 1600 s/mm2computed using acquired DWI images at b = 133 and 667 s/mm2 (D). Targeted TRUS/MRI fusion guided biopsy revealed Gleason 3+5 with 80% core involvement. The lesion is clearly visible on T2W MRI (A) and ADC map (B); moreover it shows hyperintense signal pattern compared to the rest of the prostate on both acquired b = 1600 DWI (C) and computed b1600 DWI (D) (arrows).
Discussion
DWI plays a critical role in MRI of the prostate. Hypointense signal pattern on ADC maps and hyperintense signal on HBV-DWI are used as an important imaging marker for the presence of PCa.6,7,34 Although HBV-DWI has been hypothesized to detect high risk PCa, the current literature is focused on differentiating PCa from normal prostate tissue15,16,18–26 with no clear choice of optimal b-value. In this manuscript, we evaluated the performance of acquired and calculated HBV-DWI to distinguish low risk PCa from intermediate–high risk PCa using 16 equally spaced b-value images ranging from 0 to 2000 s/mm2. Our results show that DWI obtained with b = 1600 s/mm2 has the optimal AUC (0.74) for discriminating low risk from intermediate– high risk cancers. However, the differences in AUC among the different b-values >1000 s/mm2 were small suggesting that even a b-value around 1067 s/mm2 can be sufficient for the depiction of high risk cancers. The calculated DWI images derived from relatively low b-values (<1000 s/mm2) can also be used to replace direct HBV-DWI.
PI-RADSv2 recommends DWI to be used as the primary pulse sequence for lesions in the peripheral zone. This formulation includes qualitative evaluation of ADC maps and high b-value DWI (with b-values between 1400 and 2000 s/mm2, if adequate signal-to-noise ratio [SNR] permits).7 HBV-DWI is advantageous because it suppresses background normal tissue and most of the low risk PCa. The higher diffusion of background tissue and low risk PCa quickly decays to noise levels with increases in b-value due to its higher ADC value, then plateaus at higher b-values. However, the DWI intensity of intermediate–high risk PCa decreases more slowly with the increase in b-value due to the impeded diffusion in these tumors. In this manuscript, we have shown that the performance of acquired high b-value DWI peaked at b = 1600 s/ mm2, then decreased with the further increase in b-values. Furthermore, there was no statistically significant difference in the performance of acquired high b-value DWI between b-values of 1000 s/mm2 and 2000 s/mm2. Therefore, this manuscript supports the consensus recommendation in PI-RADSv2.
In most MP-MRI studies, DWI is evaluated qualitatively based on ADC maps and the appearance of bright lesions on HBV-DWI.6,7 This work concurs with several prior studies that state that b = 2000 s/mm2 HBV-DWI has better diagnostic performance in comparison to b = 1000 s/mm2 (see references 16,21–26) and also in comparison to b = 500, 1000, and 2000 s/mm2.20 Both b = 1500 s/ mm2 and b = 2000 s/mm2 HBV-DWI have similar and improved diagnostic performance compared with b = 1000 s/mm2 and b = 2500 s/mm2.19 However, the distinction between clinically insignificant (low risk) and clinically significant (intermediate–high risk) cancers was not made in these studies. This study differs from previous studies because it compares the ability of HBV-DWI to distinguish low from intermediate–high risk tumors. Patient selection for biopsy is an important consideration in reducing health care costs related to the use of MRI for PCa. By identifying patients with abnormal but low risk disease, some biopsies could be avoided or at least deferred.
This study has several limitations. First, we used TRUS/MRI fusion guided biopsy as a validation method instead of radical prostatectomy. The advantage of doing this is that it allows a broader class of patients to be included in the study (i.e., active surveillance and radiation therapy candidates as well as surgical candidates). There is a chance that a tumor will be missed on MP-MRI or missed/ undersampled at biopsy because this study did not use whole-mount histopathology as the gold standard. However, TRUS/MRI fusion guidance has been proven highly effective in diagnosing patients with intermediate/high grade tumors compared with traditional systematic biopsy.35 A second limitation of this study is that only lesions positive on MP-MRI were included. Across multiple studies, the false negative rate for the detection of intermediate–high risk cancer is <5% using MP-MRI so this should have a small impact on the results. AUC is not perfect, indicating that this method still misses some tumors and false calls others positives. HBV-MRI, while a step forward, is not the definitive method for diagnosing such cancers. Other methods, alone or in combination, may be needed to further improve the diagnosis of intermediate high risk PCa. A third limitation of this study is that the use of an endorectal coil and images acquired at a field strength of 3T may not be performed in all centers. Scans obtained with lower SNR may have different optimal high b-values compared with what we found in this study. A fourth limitation of this study included using the CAPRA method on a per lesion basis instead of on a per patient basis. The CAPRA scoring system is one of the very few available validated nomograms that can allow patients with secondary Gleason pattern 4 to be an active surveillance candidate. Using this system on a per patient basis would not contribute to our primary objective to find the best high b-value in the detection of high risk prostate cancer in the peripheral zone as the sample size would artificially dilute our lesion categorizations. Thus, using the CAPRA scoring system on a per lesion basis was useful as an extra step to biopsy confirmation. Finally, this is a retrospective study with a relatively limited patient/ lesion population size which could introduce a potential patient selection bias that would be less likely to occur prospectively. However, the patients in this study were consecutive reducing the likelihood of a specific selection bias.
In conclusion, our study shows that b = 1600 s/mm2 is the optimal b-value for HBV-DWI in separating high risk PCa from low risk PCa. HBV-DWI at b = 1600 s/mm2 and HBV-DWI between b = 1067 and b = 2000 s/mm2 has similar performance indicating that a HBV-DWI with b-value between 1067 and 2000 s/mm2 can be comfortably used to detect high risk PCa lesions. The computed HBV-DWI computed without perfusion effect performed similar to that of acquired HBV-DWI with best performance around b = 2000 s/mm2.
References
- 1.Hoeks CM, Barentsz JO, Hambrock T, et al. Prostate cancer: multi-parametric MR imaging for detection, localization, and staging. Radiology 2011;261:46–66. [DOI] [PubMed] [Google Scholar]
- 2.Delongchamps NB, Rouanne M, Flam T, et al. Multiparametric magnetic resonance imaging for the detection and localization of prostate cancer: combination of T2-weighted, dynamic contrast-enhanced and diffusion-weighted imaging. BJU Int 2011;107:1411–1418. [DOI] [PubMed] [Google Scholar]
- 3.Kurhanewicz J, Vigneron D, Carroll P, et al. Multiparametric magnetic resonance imaging in prostate cancer: present and future. Curr Opin Urol 2008;18:71–77. [DOI] [PMC free article] [PubMed] [Google Scholar]
- 4.Turkbey B, Mani H, Aras O, et al. Prostate cancer: can multiparametric MR imaging help identify patients who are candidates for active surveillance? Radiology 2013;268:144–152. [DOI] [PMC free article] [PubMed] [Google Scholar]
- 5.Pinto PA, Chung PH, Rastinehad AR, et al. Magnetic resonance imaging/ultrasound fusion guided prostate biopsy improves cancer detection following transrectal ultrasound biopsy and correlates with multiparametric magnetic resonance imaging. J Urol 2011;186:1281–1285. [DOI] [PMC free article] [PubMed] [Google Scholar]
- 6.Barentsz JO, Richenberg J, Clements R, et al. ESUR prostate MR guidelines 2012. Eur Radiol 2012;22:746–757. [DOI] [PMC free article] [PubMed] [Google Scholar]
- 7.Weinreb JC, Barentsz JO, Choyke PL, et al. Prostate imaging and reporting and data system: version 2. Eur Radiol 2016;69:16–40. [DOI] [PMC free article] [PubMed] [Google Scholar]
- 8.Patterson DM, Padhani AR, Collins DJ. Technology insight: water diffusion MRI--a potential new biomarker of response to cancer therapy. Nat Clin Pract Oncol 2008;5:220–233. [DOI] [PubMed] [Google Scholar]
- 9.Kajihara H, Hayashida Y, Murakami R, et al. Usefulness of diffusion-weighted imaging in the localization of prostate cancer. Int J Radiat Oncol Biol Phys 2009;74:399–403. [DOI] [PubMed] [Google Scholar]
- 10.Yoshimitsu K, Kiyoshima K, Irie H, et al. Usefulness of apparent diffusion coefficient map in diagnosing prostate carcinoma: correlation with stepwise histopathology. J Magn Reson Imaging 2008;27:132–139. [DOI] [PubMed] [Google Scholar]
- 11.Turkbey B, Shah VP, Pang Y, et al. Is apparent diffusion coefficient associated with clinical risk scores for prostate cancers that are visible on 3-T MR images? Radiology 2011;258:488–495. [DOI] [PMC free article] [PubMed] [Google Scholar]
- 12.Itou Y, Nakanishi K, Narumi Y, et al. Clinical utility of apparent diffusion coefficient (ADC) values in patients with prostate cancer: can ADC values contribute to assess the aggressiveness of prostate cancer? J Magn Reson Imaging 2011;33:167–172. [DOI] [PubMed] [Google Scholar]
- 13.Vargas HA, Akin O, Franiel T, et al. Diffusion-weighted endorectal MR imaging at 3 T for prostate cancer: tumor detection and assessment of aggressiveness. Radiology 2011;259:775–784. [DOI] [PMC free article] [PubMed] [Google Scholar]
- 14.Hambrock T, Somford DM, Huisman HJ, et al. Relationship between apparent diffusion coefficients at 3.0-T MR imaging and gleason grade in peripheral zone prostate cancer. Radiology 2011;259:453–461. [DOI] [PubMed] [Google Scholar]
- 15.Grant KB, Agarwal HK, Shih JH, et al. Comparison of calculated and acquired high b value diffusion-weighted imaging in prostate cancer. Abdom Imaging 2015;40:578–586. [DOI] [PMC free article] [PubMed] [Google Scholar]
- 16.Tamada T, Kanomata N, Sone T, et al. High b value (2,000 s/mm2) diffusion-weighted magnetic resonance imaging in prostate cancer at 3 Tesla: comparison with 1,000 s/mm2 for tumor conspicuity and discrimination of aggressiveness. Plos One 2014;9:e96619. [DOI] [PMC free article] [PubMed] [Google Scholar]
- 17.Rosenkrantz AB, Mannelli L, Kong X, et al. Prostate cancer: utility of fusion of T2-weighted and high b-value diffusion-weighted images for peripheral zone tumor detection and localization. J Magn Reson Imaging 2011;34:95–100. [DOI] [PubMed] [Google Scholar]
- 18.Maas MC, Futterer JJ, Scheenen TW. Quantitative evaluation of computed high B value diffusion-weighted magnetic resonance imaging of the prostate. Invest Radiol 2013;48:779–786. [DOI] [PubMed] [Google Scholar]
- 19.Metens T, Miranda D, Absil J, et al. What is the optimal b value in diffusion-weighted MR imaging to depict prostate cancer at 3T? Eur Radiol 2012;22:703–709. [DOI] [PubMed] [Google Scholar]
- 20.Ohgiya Y, Suyama J, Seino N, et al. Diagnostic accuracy of ultra-high-b-value 3.0-T diffusion-weighted MR imaging for detection of prostate cancer. Clin Imaging 2012;36:526–531. [DOI] [PubMed] [Google Scholar]
- 21.Katahira K, Takahara T, Kwee TC, et al. Ultra-high-b-value diffusion-weighted MR imaging for the detection of prostate cancer: evaluation in 201 cases with histopathological correlation. Eur Radiol 2011;21: 188–196. [DOI] [PubMed] [Google Scholar]
- 22.Kim CK, Park BK, Kim B. High-b-value diffusion-weighted imaging at 3 T to detect prostate cancer: comparisons between b values of 1,000 and 2,000 s/mm2. AJR Am J Roentgenol 2010;194:W33–W37. [DOI] [PubMed] [Google Scholar]
- 23.Ueno Y, Kitajima K, Sugimura K, et al. Ultra-high b-value diffusion-weighted MRI for the detection of prostate cancer with 3-T MRI. J Magn Reson Imaging 2013;38:154–160. [DOI] [PubMed] [Google Scholar]
- 24.Rosenkrantz AB, Hindman N, Lim RP, et al. Diffusion-weighted imaging of the prostate: comparison of b1000 and b2000 image sets for index lesion detection. J Magn Reson Imaging 2013;38:694–700. [DOI] [PubMed] [Google Scholar]
- 25.Manenti G, Nezzo M, Chegai F, et al. DWI of prostate cancer: optimal b-value in clinical practice. Prostate Cancer 2014;2014:868269. [DOI] [PMC free article] [PubMed] [Google Scholar]
- 26.Kitajima K, Takahashi S, Ueno Y, et al. Clinical utility of apparent diffusion coefficient values obtained using high b-value when diagnosing prostate cancer using 3 tesla MRI: comparison between ultra-high b-value (2000 s/mm(2)) and standard high b-value (1000 s/mm(2)). J Magn Reson Imaging 2012;36:198–205. [DOI] [PubMed] [Google Scholar]
- 27.Xu S, Kruecker J, Turkbey B, et al. Real-time MRI-TRUS fusion for guidance of targeted prostate biopsies. Comput Aided Surg 2008;13: 255–264. [DOI] [PMC free article] [PubMed] [Google Scholar]
- 28.Feuerlein S, Davenport MS, Krishnaraj A, et al. Computed high b-value diffusion-weighted imaging improves lesion contrast and conspicuity in prostate cancer. Prostate Cancer Prostatic Dis 2015;18: 155–160. [DOI] [PubMed] [Google Scholar]
- 29.Cooperberg MR, Freedland SJ, Pasta DJ, et al. Multiinstitutional validation of the UCSF cancer of the prostate risk assessment for prediction of recurrence after radical prostatectomy. Cancer 2006; 107:2384–2391. [DOI] [PubMed] [Google Scholar]
- 30.Cooperberg MR, Pasta DJ, Elkin EP, et al. The University of California, San Francisco Cancer of the Prostate Risk Assessment score: a straightforward and reliable preoperative predictor of disease recurrence after radical prostatectomy. J Urol 2005;173:1938–1942. [DOI] [PMC free article] [PubMed] [Google Scholar]
- 31.Hanley JA, McNeil BJ. The meaning and use of the area under a receiver operating characteristic (ROC) curve. Radiology 1982;143:29–36. [DOI] [PubMed] [Google Scholar]
- 32.Hanley JA, McNeil BJ. A method of comparing the areas under receiver operating characteristic curves derived from the same cases. Radiology 1983;148:839–843. [DOI] [PubMed] [Google Scholar]
- 33.Robin X, Turck N, Hainard A, et al. pROC: an open-source package for R and S1 to analyze and compare ROC curves. BMC Bioinform 2011;12:77. [DOI] [PMC free article] [PubMed] [Google Scholar]
- 34.Tamada T, Sone T, Jo Y, et al. Diffusion-weighted MRI and its role in prostate cancer. NMR Biomed 2014;27:25–38. [DOI] [PubMed] [Google Scholar]
- 35.Siddiqui MM, Rais-Bahrami S, Turkbey B, et al. Comparison of MR/ ultrasound fusion-guided biopsy with ultrasound-guided biopsy for the diagnosis of prostate cancer. JAMA 2015;313:390–397. [DOI] [PMC free article] [PubMed] [Google Scholar]