Abstract
Purpose:
The studies investigate the anticancer activity of 5-fluorouracil (5-FU)-hyaluronidase (Hase) enzyme-loaded chitosan nanoparticles (5-FUChnps) using three-dimensional (3D) spheroid HCT-116 culture. Hase-loaded nanoparticles (Chnps) have recently been used to improve the efficacy of chemotherapeutic drugs for cancer treatment. It has been found that administration of Hase improves tumor vessel densities and increase perfusion within tumor.
Methods:
Particle size and zeta potential of the nanoparticles were determined using a particle size analyzer while Fourier transform infrared (FTIR) was used to investigate the interactions among the various components making up the chitosan nanoparticles. Cytotoxic effects of 5-FU and 5FUchnps against dimensional (2D) and 3D spheroid cultures were assessed using trypan blue assay.
Results:
Low molecular weight chitosan (ChiL) nanoparticle size was determined to between 215 to 670 nm while medium molecular weight chitosan (ChiM) nanoparticle size ranged from 151 to 778 nm. All 5FUChnps exhibited a zeta potential value ranging from +4 to +37 mV. Among the 16 formulations prepared, formulation #7 (5-FUChnps7) was selected for the in-vitro cytotoxic studies based on its high 5-FU entrapment efficiency (59%). 5FUchnps treated 3D HCT-116 culture exhibited significant growth inhibition compared with 5-FU treated groups. Further, spheroids with significant growth inhibition exhibited high spheroid volume and non-spherical shapes.
Conclusion:
5-FUChnps were significantly cytotoxic to the 3D HCT-116 cultures than that of the free 5-FU. Chnps proved to have the ability to deliver and improve the anticancer activity of 5-FU in 3D HCT-116 culture studies.
Keywords: Colorectal cancer, 5-Fluoruracil, Chitosan, Nanoparticles, Spheroids
Introduction
In recent data, the leading causes of death in the United States were rated as: (i) heart disease, (ii) cancer (malignant), and (iii) chronic lower respiratory disease [1]. Within the cancer group, American Cancer Society ranks colorectal cancer (CRC) as the 2nd and 3rd leading cause of deaths in men and women respectively in the United States [1]. SEER (Surveillance, Epidemiology, and End Results Program) estimates that 140,250 new cases will occur in 2018 including 50,630 estimated deaths. Currently, surgery combined with chemotherapy is the primary treatment for resectable and confined metastatic carcinoma; recurrence of the tumor following surgery has become a considerable concern as it may occur in the lungs, liver or other distant sites [2]. CRC recurrence may often lead to a reduction in overall survival with a reported 5-year survival rate of 30–60% at stage III [3]. There is an ongoing need to design and enhance drug delivery of chemotherapeutic agents through the use of nanoparticles. Nanoparticles loaded with anticancer agents can successfully increase the drug concentration in cancer tissues and act at cellular levels thereby enhancing anticancer efficacy.
5-FU has been used for the treatment of solid tumors and is employed most extensively in clinical chemotherapy for the treatment of carcinomas of the colon and/or rectum. However, like other drugs used for chemotherapy, it affects the growth of normal body cells and often causes side effects such as hair loss, fatigue, birth defects, mouth sores and ulcers, liver disease, and a temporary drop in bone marrow function [4, 5]. While reports indicate that chitosan nanoparticles might prevent the side effects induced by 5-FU [6]. Besides, chitosan offers several advantages such as low toxicity and good biodegradability as well as high mucoadhesive properties and has been used as an excipient in different formulations, such as tablets, matrix, micro- and nanoparticles to enhance residence time and improve bioavailability [7].
Poloxamer-188 is a group of water soluble polymers, widely used and recognized as solubilizing agents, capable of increasing water solubility and stability of drugs. In this study, poloxamer-1888 was incorporated within the chitosan nanoparticle due to the ability of improving drug dissolution rate.
Accumulation of extracellular matrix (ECM) plays a critical role in the development of tumor resistance, as hyaluronic acid (HA) is a major component in ECM. It has been observed that there is high HA content in solid tumors. HA is reported to be involved in the activation of cell signaling pathways that promotes cell motility, angiogenesis, proliferation and differentiation [8]. Reports have shown that hyaluronidase (Hase) is a promising therapeutic adjuvant in systemic cancer therapy [9]. Hase is a matrix-degrading enzyme, as it degrades intratumoral HA. Based on this, we investigated the use of surfactant decorated-chitosan nanoparticles as carriers for the delivery of 5-FU to 3D HCT-116 cancer spheroids.
3D cell culture is regarded as a more stringent and representative model on which to assess the cytotoxicity of anticancer formulation. Reports indicate that 3D cell cultures possess several in-vivo features of tumors such as drug penetration [10], cell-cell interaction [11], hypoxia [12], response and resistance [12], and production/deposition of extracellular matrix [13]. In addition, the study of cancer cell dynamics in a 3D context allows us to stimulate the architecture of living tissue and to better evaluate the effect of drugs against cancers.
In the present study, we developed 5-FU-hyaluronidase (Hase) enzyme-loaded chitosan nanoparticles (5-FUChnps) as targeted drug delivery system by ionotropic gelation technique using chitosan as bioactive polymer, tripolyphosphate (TPP) as polyanion, Hase as an enzyme and poloxamer-188 as surfactant. 5-FU and Hase were encapsulated into the chitosan nanoparticles through crosslinking as a result of electrostatic interaction and investigated their cellular uptake and anticancer activity by using 2D and 3D HCT-116 spheroids.
Materials and Methods
Materials
Chitosan (low molecular weight (ChiL) 50,000–190,000 daltons; medium molecular weight (ChiM) 200,000 ± 300,000 daltons) with degree of deacetylation of 95%, 5-FU, phosphate-buffered saline (PBS) and acetic acid were purchased from Sigma-Aldrich (St. Louis, MO). Nunclon sphera 3D 96-well plates purchased from ThermoFisher Scientific (Waltham, MA). Colorectal carcinoma cell lines, HCT-116 cells were purchased from American Type Culture Collection (ATCC) (Manassas, VA). All other chemicals were of analytical grade and used as such without further purification.
Preparation of 5-FUchnps
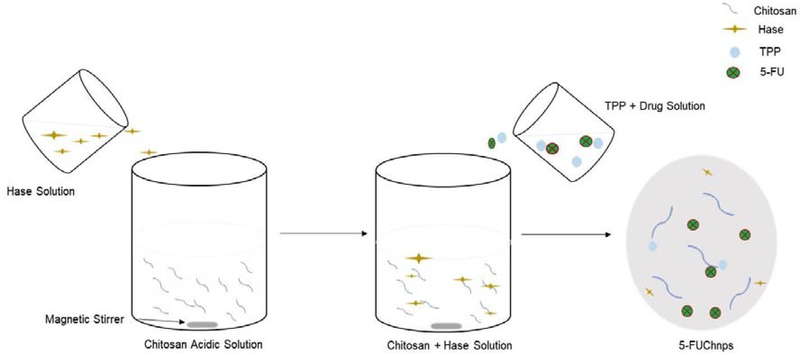
5-FUChnps were prepared by following a previously reported method with some modifications [9]. Briefly, 40 mg low molecular weight chitosan (ChiL) or medium (ChiM) molecular weight chitosan and 50 mg of Hase were dissolved in 10 mL of 1% aqueous acetic acid solution under moderate stirring (500 rpm). Once homogenous solution was attained, pH of solution was adjusted to 5. Varying amounts of 5-FU were dissolved directly in TPP solution (3 mg/mL) to obtain different 5-FU concentrations of 20, 30, 40 and 50 % (w/v), Table 1 [3]. To form nanoparticles, TPP solution containing different concentrations of 5-FU was added dropwise to chitosan-Hase solution under magnetic stirring at 500 rpm at room temperature until the solution turned turbid or cloudy. The cloudy nature of the solution indicated the formation of nanoparticles as a result of crosslinking between chitosan and TPP. The nanoparticle formed was separated from the free 5-FU and unentrapped Hase by centrifugation at 1500 rpm, while the supernatant was decanted, the pellets were suspended in TPP solution containing 5 mg/mL of poloxamer-188 and stirred at 500 rpm for 60 mins. The 5-FUChnp formed was collected by centrifugation at 1,500 rpm and lyophilized for 24 hour using mannitol (5 % w/w) as cryoprotectant. The mannitol also aided in the dispersion of 5-FUChnps.
Table 1:
Composition of 5-FUChnps containing different amounts of chitosan and poloxamer-188
| Formulation | 5-FU (% w/v) | ChiL (% w/v) | ChiM (% w/v) | P-188 (% w/v) | TPP (% w/v) | Hase (% w/v) |
|---|---|---|---|---|---|---|
| 1 | 20 | - | 0.4 | 1.0 | 0.3 | 0.5 |
| 2 | 30 | - | 0.4 | 1.0 | 0.3 | 0.5 |
| 3 | 40 | - | 0.4 | 1.0 | 0.3 | 0.5 |
| 4 | 50 | - | 0.4 | 1.0 | 0.3 | 0.5 |
| 5 | 20 | 0.4 | - | 1.0 | 0.3 | 0.5 |
| 6 | 30 | 0.4 | - | 1.0 | 0.3 | 0.5 |
| 7 | 40 | 0.4 | - | 1.0 | 0.3 | 0.5 |
| 8 | 50 | 0.4 | - | 1.0 | 0.3 | 0.5 |
| 9 | 20 | - | 0.4 | 1.5 | 0.3 | 0.5 |
| 10 | 30 | - | 0.4 | 1.5 | 0.3 | 0.5 |
| 11 | 40 | - | 0.4 | 1.5 | 0.3 | 0.5 |
| 12 | 50 | - | 0.4 | 1.5 | 0.3 | 0.5 |
| 13 | 20 | 0.4 | - | 1.5 | 0.3 | 0.5 |
| 14 | 30 | 0.4 | - | 1.5 | 0.3 | 0.5 |
| 15 | 40 | 0.4 | - | 1.5 | 0.3 | 0.5 |
| 16 | 50 | 0.4 | - | 1.5 | 0.3 | 0.5 |
5FU = 5-Flurouracil, ChiL= low molecular weight, ChiM=medium molecular weight chitosan, chitosan, P-188 = poloxamer-188, TPP = sodium tripolphosphate. Hase: Hyaluronidase
Characterization of 5-FUchnps
The particles were suspended in deionized water before measurement. The particle sizes and zeta potential values of 5-FUChnps were determined by using a Zeta Potential/ Particle Sizer (NICOMP 380 ZLS).
Analysis of 5-FU
Quantitative analysis of 5-FU in 5-FUChnps was validated by high performance liquid chromatography (HPLC). Analysis was performed on a C18 column with an injection volume of 20 μL. The mobile phase consisted of 5 mM phosphate buffer and 5% methanol (95:5) at a flow rate of 1.0 mL/min. 5-FU was detected using a Waters 2996 photodiode array detector at a wavelength of 268 nm. The method was shown to be specific and linear in the range of 0.048 – 50 μg/mL (r = 0.9).
Entrapment efficiency and loading capacity of 5-FU
The entrapment efficiency (E.E) was measured indirectly by measuring the amount of 5-FU in 5-FUChnps by suspending 20 mg of lyophilized 5-FUChnps in 2 mL of PBS. The suspension was mixed and then centrifuged at 6,000 rpm for 5 mins. A hundred microliters (100 μL) of supernatant was added to 900 μL mobile phase. The solutions were run on HPLC to estimate the amount of 5-FU presence in the 20 mg sample. The E.E and LC were calculated based on the following equations:
| 1 |
| 2 |
Where: LC = loading capacity; nps = nanoparticles.
Fourier transform infrared (FTIR) spectroscopy of 5-FUChnps
A small quantity of 5-FU, ChiL or 5-FUChnps was uniformly mixed with 200 mg of KBr and compressed to form tablets. The tablets were scanned in transmission mode in the spectral region of 4000–500 cm−1 using high resolution. This study was conducted to determine the interactions between 5-FU and chitosan nanoparticles in 5-FUChnps.
Drug release
A 5-FUChnps7 suspension containing 20 mg/mL was placed in dialysis bag and immersed completely in PBS solution under magnetic stirring for 24 hours at 37°C. At predetermined time intervals (5, 10, 15, 30, 60, 120, 240, 480, 720 and 1440 minutes), aliquots of 1 mL of receiver solution was withdrawn and replaced with equal volume of fresh PBS at 37°C. Amount of 5-FU present in each sampled solution was determined by reverse-phase HPLC.
Mathematical model to determine the release mechanism
The release kinetics of 5-FU from Chnps7 was investigated to predict the possible mechanism of release using mathematical models. For zero order kinetics, Ct was platted against ‘t’ and for first-order kinetics, logCt was plotted against “t”. The release order was determined using zero order (Equation 3) and first order (Equation 4) kinetic model as shown below.
| 3 |
| 4 |
where Co is the initial amount of drug, Ct is the % cumulative 5-FU released with respect to time (“t”), ko is zero order rate release constant and k1 is the first order rate release constant.
A Higuchi model was used to determine whether the release mechanism follows Fickian diffusion as shown in equation 5:
| 5 |
where C is the % cumulative 5-FU released at time, t and kH is the Higuchi constant. For Higuchi model, C was plotted against t1/2.
5-FUChnps enzyme activity
Based on highest E.E of 5-FU by Chnps7 (Table 2), 5-FUChnps7 was selected to investigate Hase enzymatic activity. The procedure to assay for Hase activity (turbidimetric determination) was followed with slight modification as reported by a published paper [9]. Briefly, 82 mg of lyophilized 5-FUChnps7 was dissolved in 10 mL PBS to act as enzyme solution. The enzyme solution of varying concentrations (mg/mL) was pipetted into series of labeled test tubes containing enzyme diluent (enzyme diluent was prepared with 20 mM sodium phosphate with 77 mM sodium chloride and 0.01% (w/v) bovine serum albumin, pH 7.0). The solutions were mixed by swirling followed by 10 minutes equilibration at 37°C. Afterwards, 1 mL of hyaluronic acid solution (0.5 mg/mL) was added to each of the test tubes. Again, the mixture was mixed by swirling and incubation at 37°C for 45 minutes.
Table 2:
5-FUChnps formulation with corresponding particle size, zeta potential value, entrapment efficiency and loading capacity.
| Formulation | Mean size (nm) | P.I | ZP (mV) | % EE | LC |
|---|---|---|---|---|---|
| 1 | 402.7 | 0.54 | +19.02 | ND | ND |
| 2 | 778.2 | 0.50 | +23.94 | 12.91 | 0.04 |
| 3 | 768.0 | 0.72 | +4.49 | 15.04 | 0.08 |
| 4 | 446.9 | 0.87 | +11.71 | 12.90 | 0.05 |
| 5 | 571.9 | 0.82 | +20.84 | 18.92 | 0.08 |
| 6 | 670.0 | 0.51 | +7.24 | 32.4 | 0.24 |
| 7 | 567.0 | 0.50 | +16.03 | 59.0 | 1.76 |
| 8 | 442.8 | 0.50 | +26.13 | 18.51 | 0.18 |
| 9 | 285.6 | 1.31 | +22.32 | 14.98 | 0.03 |
| 10 | 315.6 | 2.28 | +20.89 | 18.20 | 0.09 |
| 11 | 273.7 | 1.63 | +16.22 | 15.85 | 0.09 |
| 12 | 151.4 | 1.75 | +27.14 | 17.35 | 0.13 |
| 13 | 215.0 | 0.46 | +20.77 | 17.20 | 0.05 |
| 14 | 392.4 | 0.52 | +24.58 | 12.97 | 0.04 |
| 15 | 276.7 | 0.75 | +31.64 | 10.19 | 0.003 |
| 16 | 283.8 | 0.50 | +37.02 | 12.75 | 0.06 |
ZP = zeta potential, PI = polydispersity index, EE= entrapment efficiency, LC = loading capacity, ND = not detected.
After 45 minutes, 500 μL of the mixture and blank were transferred to 6 different tubes, each containing 2.5 mL of acidic albumin solution (acidic albumin solution prepared with 24 mM sodium acetate, 79 mM acetic acid with 0.1% (w/v) bovine serum albumin, pH 3.75).
The solution was mixed immediately by inversion and allowed to stand for 10 minutes at room temperature. After 10 minutes, 300 μL of the mixture was placed in a 96-well plate (triplicates) and transmittance was determined at 595 nm using a BIO-RAD microplate reader. A tube containing 1 mL of 0.1 M sodium phosphate buffer at pH 5.3 with 0.15 M sodium chloride was used as the blank. Absorbance at 595 nm was measured at regular time intervals and plotted against Hase concentration (mg/mL) in 5-FUChnps7. The enzyme-mediated hyaluronic acid degradation was calculated to give standard curve. The procedure was a turbidimetric determination (% Transmittance at 540 nm, Light path = 1 cm) of Hase activity.
For a standard curve
Different tubes containing varying concentrations of HA (0.04 − 0.032 mg/mL) and 1 mL of buffer (0.1 M Sodium phosphate buffer, pH 5.3 with 0.15 M sodium chloride) added to each tube was heated in water-bath for 5 minutes and then cooled to room temperature. At room temperature, 9.0 mL of albumin reagent was added to tube and allowed to stand for 10 minutes. Transmittance was read at 540 nm and absorbance versus HA (mg) was plotted to give the standard curve.
Units of enzyme/mL was calculated as follows:
| 6 |
where:
df = dilution factor of enzyme
14.84 = Extinction Coefficient
mL of enzyme solution = Volume of enzyme solution used in reaction
T = Transmittance
Amount of HA degraded was calculated based on the equation:
| 7 |
It was based on the following reaction:
Viscosity Measurement
Viscosity behavior of varying amounts of 5-FU and surfactant P-188 in the various formulations 37°C was determined using a Brookfield Viscosity DV-III Rheometer. Aqueous solutions of all formulations were prepared by adding some amount of the formulation to deionized water. During preparation, solutions were magnetically stirred to ensure proper dissolution of all the formulations (Table 3).
Table 3:
Viscosity, shear stress and shear rate of different formulations
| Formulation | Viscosity (cP) | Shear Stress (d.cm−2) | Shear Rate (s−1) | Temperature (°C) |
|---|---|---|---|---|
| 1 | 1.09 | 3.60 | 330 | 37.03 |
| 2 | 1.09 | 3.64 | 330 | 37.00 |
| 3 | 1.09 | 3.60 | 330 | 36.99 |
| 4 | 1.10 | 3.64 | 330 | 37.04 |
| 5 | 1.10 | 3.64 | 330 | 37.00 |
| 6 | 1.04 | 3.44 | 330 | 37.01 |
| 7 | 1.07 | 3.44 | 330 | 37.00 |
| 8 | 1.07 | 3.48 | 330 | 37.02 |
| 9 | 1.06 | 3.44 | 330 | 37.02 |
| 10 | 1.08 | 3.56 | 330 | 37.00 |
| 11 | 1.02 | 3.40 | 330 | 37.02 |
| 12 | 1.06 | 3.52 | 330 | 37.02 |
| 13 | 1.04 | 3.44 | 330 | 37.00 |
| 14 | 1.07 | 3.52 | 330 | 36.97 |
| 15 | 1.06 | 3.44 | 330 | 37.01 |
| 16 | 1.04 | 3.44 | 330 | 37.02 |
| 5-FU | 0.91 | 3.44 | 330 | 37.01 |
Spheroids ± 3D cell model
The in-vitro cytotoxicity of free 5-FU and 5-FUChnps7 was determined using HCT-116 cultures. HCT-116 cells were seeded at a density of 3 × 10⁵ cells/well [14] [15]. Cells were cultured in Dulbecco’s Modified Eagle Medium/Nutrient Mixture F-12 (DMEM/F-12) medium enriched with 25mM L-glutamine, 5mM ((4-(2-hydroxyethyl)-1-piperazineethanesulfonic acid (HEPES), 10% fetal bovine serum (FBS), and 1% penicillin- streptomycin and maintained at 37°C and 5% CO2. Cell passage was done after reaching 75% confluency. Trypsin/EDTA 1x (0.25%) was used to detach the cells. Using Nunclon Sphera 96-U-shaped bottom wells with super low cell attachment surface, HCT-116 cells were seeded at a density of 7 × 10² cells/well and six wells with spheroids (n = 6 wells of spheroid) were treated per concentration. Cells were incubated for 72 hours to allow spheroid formation. On day 4, the formed spheroids were treated with different concentrations of free 5-FU (4 − 15 μM) and 5-FUChnps7 (4 − 15 μM, 5-FU equivalent) for 48 hours. Control spheroids were cultured with only growth medium.
Cell Viability Assay
On day 7, spheroids were harvested and disrupted using trypsin/EDTA. Trypan blue solution (0.4%) was used to stain the dead cells and viable cells counted using automated cell counter (Bio-Rad TC-20).
Cellular uptake
HCT-116 cells were cultured and plated into a 6-well plate with a seeding density of 3 ×10⁵ cells/well in growth media until cells reached 70% confluency. Cells were then incubated with fluorescein isothiocyanate-labeled chitosan nanoparticles (FITC-Chnps) for 2–3 hours at 37 °C. After incubation, cells were thoroughly washed with PBS, detached from the culture plate with 0.25% trypsin, and effect of trypsin on cells was terminated by adding culture medium and centrifuged at 6,000 rpm for 5 minutes. The cell pellets were washed 3 times with PBS and resuspended in 500 uL of PBS. Flow cytometry analysis was performed using a BD FACSCanto™ Analyzer and a BD FASAria™ Cell Sorter (BD BIosciencs).
Statistical analysis
Data was presented as means ± standard deviation and statistical difference between 5-FU and 5-FUChnps was determined by using student’s t-test and considered significant at p < 0.05. All experiments were performed at least in triplicate and analyzed using GraphPad Prism software (GraphPad Software, Inc., La Jolla, CA, USA)
Results and Discussion
Characterization of 5-FUchnps
Chitosan loaded 5-FU nanoparticles were prepared by ionic gelation interaction between cationic and anionic charge of Chitosan and TPP solutions as shown in Table 1. Chitosan is a hydrophilic cationic polymer used to prepare nanoparticles by means of electrostatic interactions. Particle size diameter of 5-FUChnps7 was found to be 567 nm. Recent study indicates that chitosan nanoparticle mean size and size distribution correlates with chitosan:TPP ratio [16], while other published report argued that excess TPP concentration in relation to chitosan concentration could cause increase in chitosan nanoparticle size. In view of this, TPP concentration (0.3 % w/v as indicated in literature) was kept constant as shown in Table 1 to minimize high particle size variability.
As shown in Table 2 as the concentration of the surfactant increased, nanoparticle size decreased. Of all the formulations, 5-FUChnps7 had the highest 5-FU entrapment efficiency (EE) of 59% and for that reason, the formulation was chosen for all the studies. Our prepared formulations showed a reasonable wide range of 5-FU EE of 10.19 – 59.0 %. 5-FU loading capacity (LC) showed a positive correlation with that of EE, in that a decreased in LC resulted in a decreased in EE (Table 2). Overall, formulations (# 5, 6, 7 and 8) made of low molecular weight chitosan (ChiL) and 1% P-188 (surfactant) exhibited significant EE compared with the other formulations (Table 1).
The zeta potential value is a significant parameter used to assess the stability of nanoparticle suspensions in aqueous medium [17, 18]. Zeta potential of 5-FUChnps7 was observed to be +16.03 (Table 2) indicating an acceptable stability. The positive value obtained for 5-FUChnps7 suggests that the nanoparticle surface was positively charged. The positive charge may be attributed to the presence of NH3+ group on the chitosan. Published papers indicate that transport of positive charged nanoparticles across cells can be facilitated by electrostatic attractions between the positively charged nanoparticles and the negatively charged cell membrane [17–19]. Although other formulations exhibited zeta potential values higher than that of 5-FUChnps7, the lower EEs of these formulations were used as the basis to exclude them from further studies.
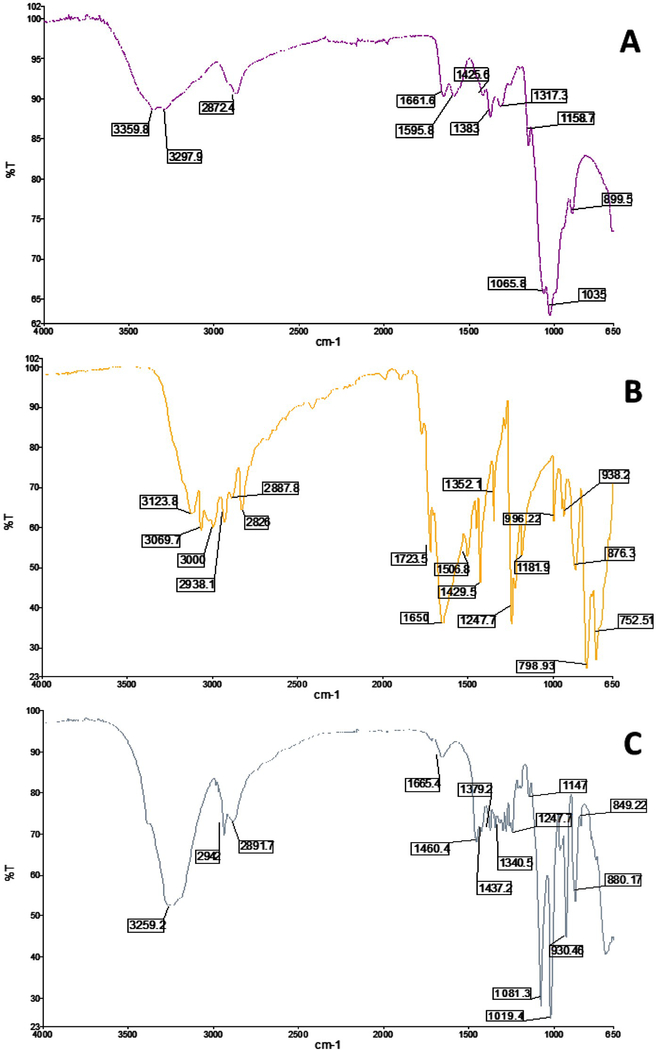
Fourier transmission infrared spectroscopy (FTIR) analysis was an approach used to determine the association of 5-FU and the chitosan nanoparticle. Figure 2 showed spectra of 5-FU, low molecular weight chitosan and 5-FUChnps. Analysis of the FTIR spectra displayed different absorption peaks of the 3 samples (Figure 2A-C). In Figure 2A, the vibrational band at 3297.5 cm−1 represents the N-H stretch in the primary amino group of chitosan. The stretching bands at 1158.7−1, 1425 cm−1, 1506 cm−1, and 3359.8 cm−1 were due to the C-O, C-H, N-H bending and hydroxyl groups present in chitosan [20, 21]. In the case of 5-FU, peaks at 3123.8 cm−1, 1650 cm−1, 1247.7 cm−1, and 1429.5 cm−1 corresponded to N-H stretch, amide carboxyl C=O stretch, C-N stretching, and C=C respectively (Figure 2B) [20, 21]. When 5-FU was loaded in chitosan nanoparticle (Figure 2C) a sharp bands were observed at 1081.3 cm−1, 1340 cm−1 and a small band at 1666.4 cm−1 indicating the C-F stretch, an aromatic ring and the amide C=O from the 5-FU structure. This confirmed the interaction between 5-FU and chitosan nanoparticle.
Figure 2:
FTIR spectra of A) Low MW Chitosan, B) 5-FU and C) 5-FUChnps
In vitro drug release
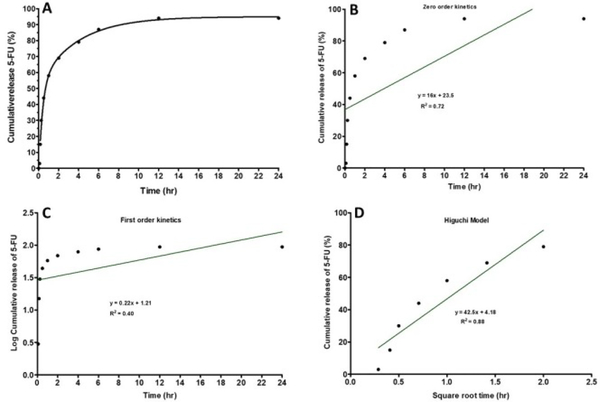
The drug release profile of chitosan nanoparticle depends on the degree of cross-linking, ionic interactions and solvent compatibility [22]. We designed our formulation with the expectation that drug would be encapsulated, internalized, retained and eventually released at appropriate location and time [23, 24]. In Figure 3A, the cumulative in-vitro drug release of 5-FU during a 24-hour period of incubation at 37°C was presented. Initial release of 50% of 5-FU occurred within the first 1 hour, followed by an additional 30% release over the next 5-hour period thereby increasing the total drug release to 80 % over total period of 6 hours. In addition, 10 % of 5-FU was further released over the period between the 6th and 12th hours. Thereafter, the release of 5-FU with time became fairly constant with no observable increase.
Figure 3:
In-vitro release of 5-FU from Chnps: Cumulative release of 5-FU from Chnps over a 24-hour period, (a) percent cumulative release against time, (b) zero-order release kinetic profile, (c) first-order release kinetic, and (d) Higuchi release model.
Overall, the release results displayed a faster and higher amount of 5-FU from 5-FUChnps7 within the first 6 hours. In-vitro 5-FU release kinetics data obtained from in-vitro dissolution study of 5-FUChnps7 is shown in Figure 3 (B, C and D). Among the three models, Higuchi model appeared to be the best fit for 5-FU release with the highest R2 value of 0.88 while Zero release kinetics R2 = 0.72 and First order release R2 = 0.40. The major advantages of Higuchi model include: (i) to better understand the underlying drug release mechanisms and, (ii) to offer a promising approach to deduce drug release profile to facilitate delivery optimization [25]. Put together, the release study suggests that the chitosan nanoparticle can load, retain and release 90 % of 5-FU within the first 12 hours in in-vitro.
Enzyme encapsulation
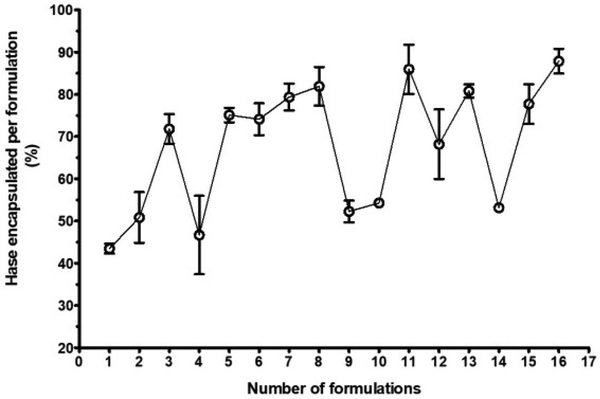
The enzymatic assay of Hase was used to determine the percent of Hase encapsulation in chitosan nanoparticle. Figure 4 shows the percent of Hase encapsulated per formulation. Out of 16 formulations, nine (3, 5, 6, 7, 8, 11, 13, 15 and 16) had Hase encapsulation of at least 70 % or more, whereas seven formulations (1, 2, 4, 9, 10, 12 and 14) showed less than 70% Hase encapsulation. With the exception of formulation #14 (5-FUChnps14), all formulations made of ChiL and 1% P-188 or 1.5% P-188 surfactant encapsulated at least 70% or more of Hase. Published papers provide evidence of Hase role in aiding deep penetration of anticancer drug delivery system. Literature search indicates that Hase loaded or Hase surface-grafted nanoparticles promote significant intratumoral distribution of anticancer drug through Hase enzymatic degradation of HA in tumor microenvironment (TME) [9, 26, 27]. The degradation of the HA into monosaccharides and disaccharides, and HA fragments, allows for deep penetration of nanoparticles and subsequent release of the anticancer drug. The role of Hase in HA degradation in cytotoxicity studies is well-documented in published papers [26, 27].
Figure 4:
Enzyme encapsulation showing different percentages of Hase enzyme entrapped by each formulation, 16 formulations were analyzed for their ability to entrapped Hase enzyme.
Viscosity of Chnps
The propensity of different molecular weights of chitosan nanoparticles to gel and affect viscosity has been well-documented [28]. The purpose of this study was to determine whether Chnps viscosity may be significantly different from that of 5-FU solution. As shown in Table 3 no significant difference in viscosity was observed among the formulations as well as 0.5% (w/v) 5-FU solution (0.91 centiPoise at 37°C). Report indicates that intrinsic viscosity of chitosan is directly proportional to the polymer average molecular weight [29]. However, no difference in viscosity between the ChiL and ChiM formulations was observed but published data suggest that incorporation of additives to chitosan solutions have been found to provide protective effect on molecular weight and viscosity [29]. This phenomenon could be attributed to creation of a protective hydration layer around the chitosan chains through interchain hydrogen bonds leading no effect on viscosity.
Cellular Uptake
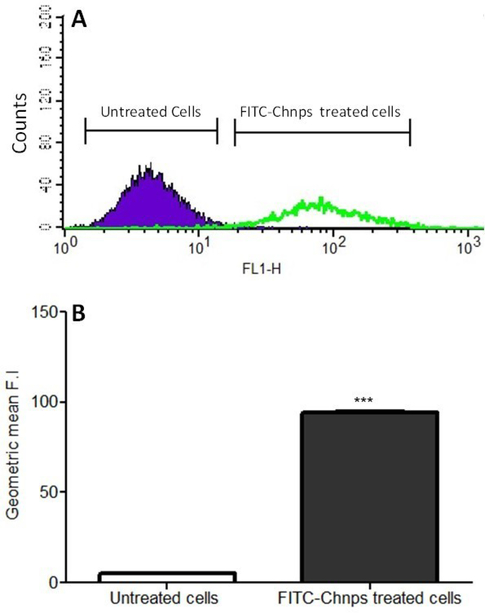
To assess the ability of HCT-116 cells to take up Chnps, HCT-116 cells were treated with fluorescein isothiocyanate-tagged-Chnps (FITC-Chnps). Flow cytometric data revealed that cells incubated with FITC-Chnps showed strong fluorescence of FITC two-fold high that cells treated with only FITC (Figure 5A). Quantitative analysis of cellular uptake of FITC-Chnps using geometric mean also displayed a similar trend (Figure 5B) where cells treated with FITC-Chnps was significantly greater (p<0.001) than the untreated (cells exposed to only FITC). Putting together, data suggest that FITC-Chnps were taken up significantly by HCT-116 cells.
Figure 5:
Cellular Uptake: (A) Flow cytometry analysis of HCT-116 cells uptake of FITC-Chnps after hours of incubation, (B) Geometric mean of HCT-116 cellular uptake of FITC-Chnps. (***p < 0.001 for comparing geometric mean of untreated vs treated). Untreated = cells exposed to FITC; treated = cells exposed to FITC-Chnps
Degradation of HA
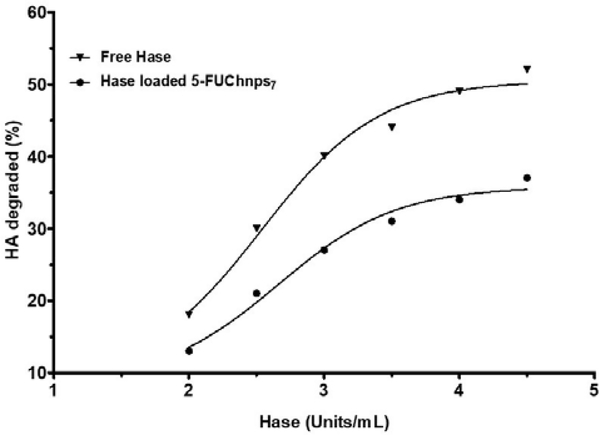
Activity of Hase linked 5-FUChnps7 on HA was evaluated using in vitro assay. As shown in Figure 6, percent of HA degradation increases as Hase linked nanoparticles increases. Our result shows a maximum of 40% HA degradation at 4.5 units/mL of Haselinked 5-FUChnps7 after 1 mL (0.03% w/v) of HA was incubated with Hase-linked 5-FUChnps in 10 minutes whereas free Hase enzymes (4.5 units/mL) degraded 50% of HA within the time frame. The decrease in degradation of HA by Hase-linked 5-FUChnps appeared to depend on the release rate of Hase from Chnps as time was needed to allow for swelling of Chnps and subsequent release of 5-FU from the nanoparticles while free Hase enzyme had direct interaction with HA solution. Evidence suggests that HA accumulation in tumor stroma is associated with reduced survival in preclinical cancer models and that PEGylated Hase breakdown of HA facilitate tumor access for cancer therapies [30].
Figure 6:
HA Degradation: Percent degradation of HA by free Hase and Hase-linked 5-FUChnps7. The incubation time between Hase and HA was 10 minutes at room temperature and the turbidity reading (% Transmittance) was done at 540 nm.
Comparison of 2D and 3D treated culture models
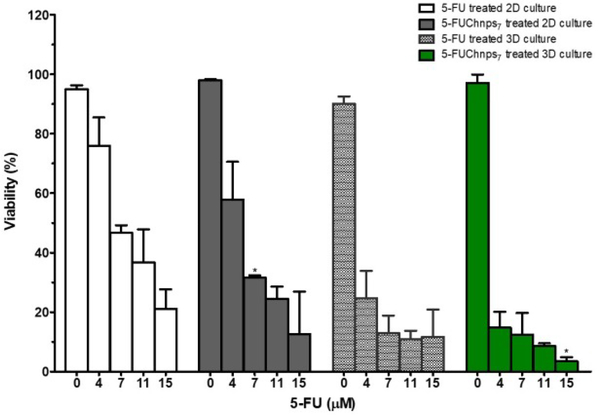
Two-dimensional (2D) cell cultures are often grown and used as the common method to assay cytotoxicity of established cancer cell lines. However, 2D cell cultures have been studied and shown to have limitations. Monolayer cultures do not possess the ability of mimicking the full dimension of the cellular environment of human tumors. Therefore, three-dimensional (3D) cell culture models have been readily used for cytotoxicity assays, allowing tumors to grow in 3D conformation repeating drug responses of human cancer, mimicking the barrier complexity/complex behavior that of clinical tumors. To evaluate the efficacy of 5-FUChnps, we compared the effect of 5-FU and 5-FUChnps7 on 2D and 3D HCT-116 cultures. In Figure 7, both 5-FU and 5-FUChnps7 treated 2D cultures showed a comparable trend of growth inhibition, where growth inhibition increases as 5-FU concentration increases, however; we observed no significant difference in growth inhibition among respective concentrations of 5-FU and 5-FUChnps7 treated 2D groups except concentration at 7 μM where inhibitory effect of 5-FUChnps7 treated 2D group was notably higher (p < 0.5) than 5-FU treated 2D group. For 3D treated groups, there was a remarkable inhibitory effect of 5-FU and 5-FUChnps7 compared with 2D treated groups across all 5-FU concentrations as shown in Figure 7. Within the 3D treated groups, 5-FUChnps7 treated groups appeared to be more effective especially at 11 μM and 15 μM (p < 0.05) concentrations than the corresponding 5-FU concentrations. Put together, 5-FUChnps7 was more effective in controlling HCT-116 cell growth than 5-FU.
Figure 7:
Effects of 5-FU and 5-FUChnps7 on cell growth: HCT 116 cells treated in 2D and 3D cell cultures with varying concentrations of 5-FU and 5-FUChnps7. Comparisons of 7μm 5-FUChnps7 treated 2D culture vs 7μm 5-FU treated 2D culture; 15μm 5-FUChnps7 treated 3D culture vs 15μm 5-FU 3D treated culture (* refer to p < 0.05).
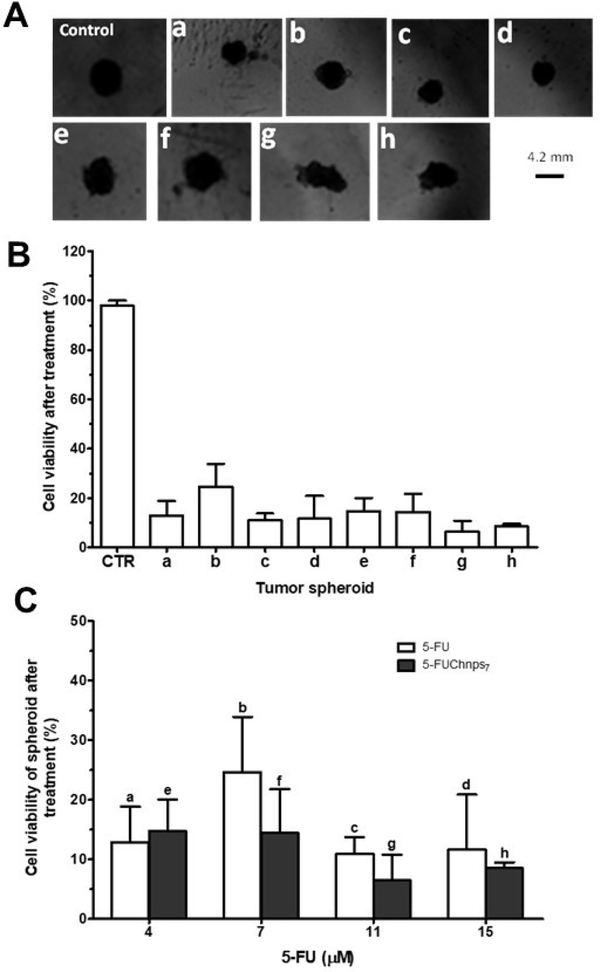
The cytotoxic effects of both free 5-FU and 5-FUChnps7 were displayed in alterations in HCT-116 spheroid’s morphology (Figure 8A). Based on these images, we observed that as 5-FUChnps7 (5-FU equivalent) concentration increases, the spherical shape becomes more irregular or non-spheroids as shown in images f, g and h compared with that of the control (Figure 8A). This indicates that at certain concentrations of 5-FUChnps7, spheroid shapes disappear, disturbed or undergo structural changes as a result of enhanced antitumor activity. On the contrary, no significant changes in spheroidal structure of 5-FU treated spheroids were observed in images a, b, c and d (Figure 8A). The lack of significant spheroid structural changes in 5-FU treated groups may be attributed to the absence of Hase which is implicated in the breakdown of HA, a major component of tumor structural barrier [9, 30]. After treatment, percent cell viability of 5-FU treated-spheroids and 5-FUChnps7 treated-spheroids were compared on the basis of concentrations as shown in Figure 8 (B and C). The 5-FUChnps7 treated group displayed a higher growth inhibition compared with free 5-FU at all concentrations (5-FU equivalent) except at a concentration 4 μM.
Figure 8:
Spheroid Viability: (A) Microscope images of untreated and treated spheroids: (a) cells treated with 4 μM of 5-FU, (b) cells treated with 7 μM of 5-FU, (c) cells treated with 11 μM of 5-FU, (d) cells treated with 15 μM of 5-FU, (e) cells treated with 4 μM of 5-FUChnps7, (f) cells treated with 7μM of 5-FUChnps7, (g) cells treated with 11μM of 5FUChnps7, (h) cells treated with 15 μM of 5-FUChnps7, (B) Percent cell viability against tumor spheroids treated with varying concentrations of 5FU or 5-FUChnps7 after 48 hours (CTR = control; spheroids exposed to only culture medium), (C) Comparison of percent cell viability and corresponding tumor spheroids treated with same concentrations of 5-FU or 5-FUChnps7 after 48 hours.
Spheroid model was developed to simulate the tumor microenvironment of human solid cancers by retaining the cellular composition [31]. The result obtained with spheroid model, especially the comparable overall treatment responses to 5-FU and 5-FUChnps7 were not similar. Mimicking the impact of the tumor microenvironment on drug response with this model allows a more effective drug development process by identifying promising drug candidates for clinical investigation [31]. Despite this advantage, the cancer tissue spheroid model has limitations. Although a number of micro-environmental interactions can be recapitulated, an intact human capillary network is missing which is required for the development and testing of anti-angiogenic drugs [31]
Conclusion
In this study, biocompatible chitosan nanoparticles were formulated with the incorporation of 5-FU. FTIR studies showed the interaction of 5-FU within the Chnps, as HPLC analysis quantified EE of 5-FU at 59%. Significant cellular uptake of Chnps was observed in HCT-116 cells. 5-FUChnps7 showed a significant growth inhibition of 2D and 3D HCT-116 cultures compared to 5-FU. In-vitro 5-FU release kinetics appeared to follow Higuchi model. Overall, the studies provide potential evidence for a promising therapeutic application of Chnp7 as a drug delivery system that may improve the penetration and distribution of 5-FU in the treatment of CRC.
Figure 1:
Schematic diagram showing the sequence of preparation of 5-FU loaded chitosan nanoparticles
Acknowledgements
This project was supported by the National Institute of Minority Health and Health Disparities of the National Institutes of Health through grant number G12MD007582-33. The authors are solely responsible for the content and writing of this project.
Footnotes
Conflict of Interest: No conflicts declared.
References
- 1.Jemal A, Murray T, Ward E, Samuels A, Tiwari RC, Ghafoor A, et al. Cancer statistics, 2005. CA Cancer J Clin 2005;55(1):10–30. PubMed PMID: . [DOI] [PubMed] [Google Scholar]
- 2.Labianca R, Beretta GD, Kildani B, Milesi L, Merlin F, Mosconi S, et al. Colon cancer. Crit Rev Oncol Hematol 2010;74(2):106–33. PubMed PMID: . [DOI] [PubMed] [Google Scholar]
- 3.Labianca R, Nordlinger B, Beretta GD, Mosconi S, Mandala M, Cervantes A, et al. Early colon cancer: ESMO Clinical Practice Guidelines for diagnosis, treatment and follow-up. Ann Oncol 2013;24 Suppl 6:64–72. PubMed PMID: . [DOI] [PubMed] [Google Scholar]
- 4.Shah A, MacDonald W, Goldie J, Gudauskas G, Brisebois B. 5-FUinfusion in advanced colorectal cancer: a comparison of three dose schedules. Cancer treatment reports 1985;69(7–8):739–42. PubMed PMID: . [PubMed] [Google Scholar]
- 5.Caballero GA, Ausman RK, Quebbeman EJ. Long-term, ambulatory, continuous IV infusion of 5-FU for the treatment of advanced adenocarcinomas. Cancer treatment reports 1985;69(1):13–5. PubMed PMID: . [PubMed] [Google Scholar]
- 6.Cheng MR, Li Q, Wan T, He B, Han J, Chen HX, et al. Galactosylated chitosan/5-fluorouracil nanoparticles inhibit mouse hepatic cancer growth and its side effects. World J Gastroenterol. 2012;18(42):607687 PubMed PMID: . [DOI] [PMC free article] [PubMed] [Google Scholar]
- 7.Hosseinzadeh H, Atyabi F, Dinarvand R, Ostad SN. Chitosan-Pluronic nanoparticles as oral delivery of anticancer gemcitabine: preparation and in vitro study. Int J Nanomedicine 2012;7:1851–63. PubMed PMID: . [DOI] [PMC free article] [PubMed] [Google Scholar]
- 8.Murakami T, Otsuki S, Okamoto Y, Nakagawa K, Wakama H, Okuno N, et al. Hyaluronic acid promotes proliferation and migration of human meniscus cells via a CD44-dependent mechanism. Connect Tissue Res 2018:1–11. PubMed PMID: . [DOI] [PubMed] [Google Scholar]
- 9.Rajan M, Raj V, Al-Arfaj AA, Murugan AM. Hyaluronidase enzyme core-5-fluorouracil-loaded chitosan-PEG-gelatin polymer nanocomposites as targeted and controlled drug delivery vehicles. Int J Pharm 2013;453(2):514–22. PubMed PMID: . [DOI] [PubMed] [Google Scholar]
- 10.Minchinton AI, Tannock IF. Drug penetration in solid tumours. Nature reviews Cancer 2006;6(8):583–92. PubMed PMID: . [DOI] [PubMed] [Google Scholar]
- 11.Baker BM, Chen CS. Deconstructing the third dimension: how 3D culture microenvironments alter cellular cues. J Cell Sci 2012;125(Pt 13):3015–24. PubMed PMID: . [DOI] [PMC free article] [PubMed] [Google Scholar]
- 12.Wartenberg M, Ling FC, Muschen M, Klein F, Acker H, Gassmann M, et al. Regulation of the multidrug resistance transporter P-glycoprotein in multicellular tumor spheroids by hypoxia-inducible factor (HIF-1) and reactive oxygen species. FASEB journal : official publication of the Federation of American Societies for Experimental Biology 2003;17(3):503–5. PubMed PMID: . [DOI] [PubMed] [Google Scholar]
- 13.Kimlin LC, Casagrande G, Virador VM. In vitro threedimensional (3D) models in cancer research: an update. Mol Carcinog 2013;52:167–82. PubMed PMID: . [DOI] [PubMed] [Google Scholar]
- 14.Davoodi H, Hashemi SR, Seow HF. 5-Fluorouracil Induce the Expression of TLR4 on HCT116 Colorectal Cancer Cell Line Expressing Different Variants of TLR4. Iranian J Pharm Res 2013. 12(12):453–60. PubMed PMID: . [PMC free article] [PubMed] [Google Scholar]
- 15.De Angelis PM, Svendsrud DH, Kravik KL, Stokke T. Cellular response to 5-fluorouracil (5-FU) in 5-FU-resistant colon cancer cell lines during treatment and recovery. Mol Cancer 2006;5:20 PubMed PMID: . [DOI] [PMC free article] [PubMed] [Google Scholar]
- 16.Abul Kalam M, Khan AA, Khan S, Almalik A, Alshamsan A. Optimizing indomethacin-loaded chitosan nanoparticle size, encapsulation, and release using Box-Behnken experimental design. Int J Biol Macromol 2016;87:329–40. PubMed PMID: . [DOI] [PubMed] [Google Scholar]
- 17.Ahmad N, Alam MA, Ahmad R, Naqvi AA, Ahmad FJ. Preparation and characterization of surface-modified PLGA-polymeric nanoparticles used to target treatment of intestinal cancer. Artif Cells Nanomed Biotechnol 2018;46(2):432–46. PubMed PMID: . [DOI] [PubMed] [Google Scholar]
- 18.Yan JK, Qiu WY, Wang YY, Wu LX, Cheung PCK. Formation and characterization of polyelectrolyte complex synthesized by chitosan and carboxylic curdlan for 5-fluorouracil delivery. Int J Biol Macromol 2018;107(Pt A):397–405. PubMed PMID: . [DOI] [PubMed] [Google Scholar]
- 19.Tantra R, Knight A. Cellular uptake and intracellular fate of engineered nanoparticles: a review on the application of imaging techniques. Nanotoxicology 2011;5(3):381–92. PubMed PMID: . [DOI] [PubMed] [Google Scholar]
- 20.Antoniraj MG, Ayyavu M, Henry LJK, Nageshwar Rao G, Natesan S, Sundar DS, et al. Cytocompatible chitosan-graft-mPEG-based 5-fluorouracil-loaded polymeric nanoparticles for tumor-targeted drug delivery. Drug Dev Ind Pharm 2018;44(3):365–76. PubMed PMID: . [DOI] [PubMed] [Google Scholar]
- 21.Mohammed MO, Hussain KS, Haj NQ. Preparation and Bioactivity Assessment of Chitosan-1-Acetic Acid-5-Flurouracil Conjugates as Cancer Prodrugs. Molecules 2017;22(11):629 (1–12) PubMed PMID: . [DOI] [PMC free article] [PubMed] [Google Scholar]
- 22.Belem-Goncalves S, Tsan P, Lancelin JM, Alves TL, Salim VM, Besson F. Interfacial behaviour of bovine testis hyaluronidase. Biochem J 2006;398(3):569–76. PubMed PMID: . [DOI] [PMC free article] [PubMed] [Google Scholar]
- 23.Badran MM, Mady MM, Ghannam MM, Shakeel F. Preparation and characterization of polymeric nanoparticles surface modified with chitosan for target treatment of colorectal cancer. Int J Biol Macromol 2017;95:643–9. PubMed PMID: . [DOI] [PubMed] [Google Scholar]
- 24.Lakkakula JR, Matshaya T, Krause RW. Cationic cyclodextrin/alginate chitosan nanoflowers as 5-fluorouracil drug delivery system. Mater Sci Eng C Mater Biol Appl 2017;70(Pt 1):169–77. PubMed PMID: . [DOI] [PubMed] [Google Scholar]
- 25.Siepmann J, Peppas NA. Higuchi equation: derivation, applications, use and misuse. Int J Pharm 2011;418(1):6–12. PubMed PMID: . [DOI] [PubMed] [Google Scholar]
- 26.Bouga H, Tsouros I, Bounias D, Kyriakopoulou D, Stavropoulos MS, Papageorgakopoulou N, et al. Involvement of hyaluronidases in colorectal cancer. BMC Cancer 2010;10:499 PubMed PMID: . [DOI] [PMC free article] [PubMed] [Google Scholar]
- 27.Jacobson A, Rahmanian M, Rubin K, Heldin P. Expression of hyaluronan synthase 2 or hyaluronidase 1 differentially affect the growth rate of transplantable colon carcinoma cell tumors. Int J Cancer 2002;102(3):212–9. PubMed PMID: . [DOI] [PubMed] [Google Scholar]
- 28.Honary S, Ebrahimi P, Hadianamrei R. Optimization of size and encapsulation efficiency of 5-FU loaded chitosan nanoparticles by response surface methodology. Curr Drug Deliv 2013;10(6):742–52. PubMed PMID: . [DOI] [PubMed] [Google Scholar]
- 29.Szymanska E, Winnicka K. Stability of chitosan-a challenge for pharmaceutical and biomedical applications. Mar Drugs 2015;13(4):1819–46. PubMed PMID: . [DOI] [PMC free article] [PubMed] [Google Scholar]
- 30.Infante JR, Korn RL, Rosen LS, LoRusso P, Dychter SS, Zhu J, et al. Phase 1 trials of PEGylated recombinant human hyaluronidase PH20 in patients with advanced solid tumours. Br J Cancer 2018;118(2):156–67. PubMed PMID: . [DOI] [PMC free article] [PubMed] [Google Scholar]
- 31.Hoffmann OI, Ilmberger C, Magosch S, Joka M, Jauch KW, Mayer B.Impact of the spheroid model complexity on drug response. J Biotechnol 2015;205:14–23. PubMed PMID: . [DOI] [PubMed] [Google Scholar]


