

Abstract
Purpose:
To derive the theoretical basis for the extended clearance model of organ elimination following both oral and IV dosing, and critically analyze the approaches previously taken.
Methods:
We derived from first principles the theoretical basis for the extended clearance concept of organ elimination following both oral and IV dosing and critically analyzed previous approaches.
Results:
We point out a number of critical characteristics that have either been misinterpreted or not clearly presented in previously published treatments. First, the extended clearance concept is derived based on the well-stirred model. It is not appropriate to use alternative models of hepatic clearance. In analyzing equations, clearance terms are all intrinsic clearances, not total drug clearances. Flow and protein binding parameters should reflect blood measurements, not plasma values. In calculating the AUCR-factor following oral dosing, the AUC terms do not include flow parameters. We propose that calculations of AUCR may be a more useful approach to evaluate drug-drug and pharmacogenomic interactions than evaluating rate-determining steps. Through analyses of cerivastatin and fluvastatin interactions with cyclosporine we emphasize the need to characterize volume of distribution changes resulting from transporter inhibition/induction that can affect rate constants in PBPK models. Finally, we note that for oral doses, prediction of systemic and intrahepatic drug-drug interactions do not require knowledge of fu,H or Kp,uu for substrates/victims.
Conclusions:
The extended clearance concept is a powerful tool to evaluate drug-drug interactions, pharmacogenomic and disease state variance but evaluating the AUCR-factor may provide a more valuable approach than characterizing rate-determining steps.
Keywords: Extended Clearance Concept, Well-Stirred Model, Hepatic Clearance, Rate-Determining Step
INTRODUCTION
Here we show that the extended clearance concept and the well-stirred model are derived from the same organ clearance relationship with different hypothesized rate-determining steps, and that different rate-determining steps must be considered when applying the extended clearance concept to predicting clearance following intravenous and oral dosing. However, we maintain that the emphasis on rate-determining steps can be misleading when evaluating drug-drug and pharmacogenomic interactions, and that a more general analysis based on area under the curve ratios (AUCR) may be a more useful approach. Using blood concentration measurements and recognition that only the well-stirred organ clearance model is relevant, it is possible to identify critical extended clearance concept parameters that may be affected by potential drug-drug interactions (DDIs) and pharmacogenomic variance of relevant metabolic enzymes and transporters, as well as their implication with respect to AUCR following oral and intravenous (IV) dosing.
We have recently shown (1) that when organ clearance is calculated as the product of the extraction ratio (ER ) and the blood flow to the organ (Q ) as in Eq. 1, this is only consistent with the well-stirred model in pharmacokinetics. This is true since the driving force concentration for elimination is assumed to be the concentration entering the organ, Cin, rather than the concentration within the organ. In other words, measured Rate of Elimination = Q · (Cin – Cout) is set equal to CL · Cin resulting in a relationship that assumes there is no incremental clearance within the organ and all elimination is driven only by the entering concentration, which is the well-stirred model.
| (1) |
In an accompanying Commentary, Rowland and Pang (2) argue that Eq. 1 “simply express[es] proportionality between observed rate of elimination and a reference concentration” and is not model dependent. However, in a subsequent analysis (3) we identified the marked difference in mean residence time (MRT ) of drug within the organ when drug elimination follows the well-stirred model versus the parallel tube and dispersion models. Equation 2 describes the relationship between CL, volume of distribution steady-state (Vss) and MRT.
| (2) |
It is hard to imagine how Rowland and Pang can justify their supposition that clearance is model independent when MRT is model dependent. To do so, they must hypothesize that Vss is also model dependent and changes exactly as MRT from model to model. Yet, it is well recognized in pharmacokinetics that volume of distribution is drug dependent and not a function of CL nor MRT. All of the models of hepatic elimination relate to the same concentrations entering and exiting the organ, but the MRT of drug within the organ and, of course, the AUC of drug within the organ differ from model to model. The supposition that Eq. 1 is model independent (2) is not supported either by pharmacokinetic theory or by experimental data.
Although Eq. 2 is a general relationship in linear pharmacokinetics, independent of clearance and transporter mechanisms, Eq. 1 relates clearance only to the elimination of drug from the organ and does not consider that critical steps of drug passage into and out of the organ can affect the clearance measurement. This concept of drug passage was initially considered by Gillette and Pang (4) and in more detail by Sirianni and Pang (5). The equations presented in those publications (the derivations were not included) are correct, but they did not specifically indicate that the equations were based on the well-stirred model, that the transporter/diffusion parameters were all intrinsic clearances and that the organ flow and protein binding measurements should be blood values, not plasma parameters. Sirianni and Pang (5) justify using plasma parameters since they evaluated enalapril and found no distribution into red blood cells. Considering the possibility that flow into the elimination site within the organ (here the hepatocyte in the liver) can be rate-determining, we derive the general clearance relationship for the liver model depicted in Fig. 1.
Fig. 1.
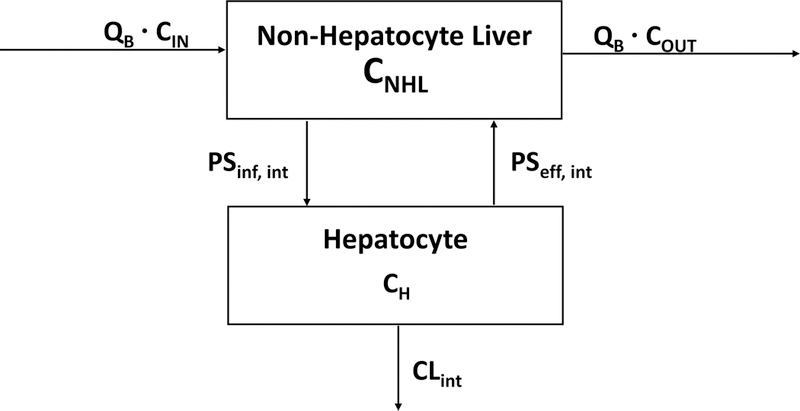
Schematic representation of the liver where blood flow (QB) at steady-state blood concentrations into (Cin) and out (Cout) of the non-hepatocyte portion of the organ related to influx (inf) and efflux (eff) intrinsic transport clearances (PSint) to the hepatocyte portion of the organ multiplied by the steady-state concentrations (CNHL and CH, respectively) driving each process. Intrinsic transporter clearances are the sum of active transporter driven intrinsic processes and passive intrinsic diffusional processes. Irreversible loss of drug by the hepatocyte is characterized by the intrinsic clearance (CLint), which sums the hepatocyte metabolic and biliary excretion intrinsic clearances.
METHODS
Solving for the change in total drug amount within the hepatocyte (AH) with time in Fig. 1 gives Eq. 3:
| (3) |
where PSint values for basolateral influx (inf ) and efflux (eff ) into and out of the hepatocyte, respectively, are the intrinsic membrane passage clearances as reported by Miyauchi et al. (6). We utilize the PS terms, as proposed by Kusuhara and Sugiyama (7), to clearly differentiate the membrane passage related clearances from the elimination clearances. These membrane passage clearances are composed of both active intrinsic transporter clearances as well as passive intrinsic diffusional processes (Qdiff,int); fu values are fraction unbound in the blood in the non-hepatocyte portion of the liver (NHL) and in the hepatocyte (H ), respectively; C values are total drug concentrations in the respective compartments reflected in Fig. 1; while CLH,int is the intrinsic clearance for irreversible drug removal from the hepatocyte, the sum of the intrinsic metabolic clearance (CLH,int,met) and intrinsic biliary clearance (CLH,int,bil).
At steady-state (ss), the differential term in Eq. 3 equals zero and the steady-state concentration within the hepatocyte will be given by Eq. 4.
| (4) |
Equation 4 may be solved following the well-stirred model derivation of Rowland et al. (8) where CNHL,ss is set equal to Cout and fu,B,NHL equal to fu,B. This allows the liver blood flow values to be inserted into the equations. Solving for Cout/Cin and substituting back into the clearance relationship of Eq. 1, as was done initially by Rowland et al. (8) and more recently by Benet et al. (1), gives the general Eq. 5.
| (5) |
Webborn et al. (9), Caminesch and Umehara (10) and Barton et al. (11) presented the same well-stirred model relationship. A similar equation was presented by Sirianni and Pang (5) using plasma (QP and fu,P) parameters as noted above. Pfizer scientists (12, 13) also presented a similar equation recognizing that the relationship was derived based on the well-stirred model, but not explicitly indicating that the transporter parameters were intrinsic clearances, not total drug transporter clearances. Recently, Patilea-Vrana and Unadkat (14) also presented the equation, recognizing that the relationship was derived based on the well-stirred model, but not substituting blood for plasma parameters. Yoshikado et al. (15) also presented a form of Eq. 5 but did not explicitly indicate that the transport terms were intrinsic parameters, although they did so subsequently (16). However, none of the papers from the Sugiyama and Kusuhara laboratories indicate that Eq. 5 was derived based on the well-stirred model. In deriving Eq. 5 others designate the non-hepatocyte liver compartment of Fig. 1 as liver plasma [Liu and Pang (17), with the hepatocyte compartment in Fig. 1 designated liver tissue], plasma [Patilea-Vrana and Unadkat (14)], or simply blood [El-Kattan and Varma (13) and many others]. In these alternate depictions, what we are designating as hepatocyte in Fig. 1, just becomes liver as a whole. Despite the difference in compartment designation by the various authors, the basic relationship between transport intrinsic clearance and elimination intrinsic clearance is still defined as in Eq. 5.
Our contention here is that equations allowing calculation/prediction of AUCR may be a more useful approach to evaluate drug-drug and pharmacogenomic interactions as derived subsequently as compared to clearance equations. Following IV dosing where all elimination occurs via the liver
| (6) |
Following oral dosing, the area under the blood concentration time curve (AUC ), where clearance is only due to liver elimination, is given by
| (7) |
where the bioavailability (F ) is the product of the fraction of the dose absorbed intact (Fabs), the fraction of the absorbed dose that gets through the gut membranes into the hepatic portal blood intact (FG ) and the fraction of unchanged drug in the hepatic portal blood that get through the liver intact (FH )
| (8) |
Following the relationship first presented by Rowland (18), FH may be determined as one minus the liver extraction ratio (ER)
| (9) |
We have previously shown (1) that this is a well-stirred model assumption, and that the relationship is only correct for the well-stirred model.
Substituting Eq. 5 into Eq. 9 with a common denominator
| (10) |
Substituting Eq. 10 into Eq. 8 and then subsequently substituting Eqs. 8 and 5 into Eq. 7, while dividing by Dose gives
| (11) |
Note that following oral dosing, AUC and changes in AUC, the so-called AUCR-factor, are completely independent of organ blood flow. The changes in AUC will be the result of changes in intrinsic clearances and fraction unbound in blood, as well as effects on Fabs and FG. Equation 11 is a well-stirred model relationship.
It is also important to characterize the equations for AUC within the hepatocyte (AUCH). From Fig. 1, and by rearrangement of Eq. 4
| (12) |
where AUCNHL is the AUC within the non-hepatocyte liver. For an IV dose, substituting Eq. 6 into Eq. 12 for AUCNHL gives
| (13) |
And substituting Eq. 11 into Eq. 12 for AUCNHL for an oral dose gives
| (14) |
RESULTS AND DISCUSSION
A. The General Relationship for Orally Administered Drugs
There are large number of publications discussing the rate-determining steps in the extended clearance relationship and the prediction of drug-drug and pharmacogenomic interactions. However, these rate-determining assumptions are not necessary to understand and predict the relevance of drug-drug and pharmacogenomic interactions. General equations, Eqs. 11 and 14, with no additional rate-determining assumptions, will predict most interactions for orally administered drugs.
A.1. Inhibition of PSinf,int.
No assumptions concerning rate-determining steps are necessary to explain/predict the inhibition of hepatic uptake transporters, for example OATP1B1 and OATP1B3. Equation 11 predicts decreasing PSinf,int will result in increased AUCR independent of whether or not hepatic elimination by metabolism or biliary excretion is extensive or not. That is, one does not need to hypothesize that PSeff,int is negligible or much less than CLint,H, or that β (i.e., ) is close to 1 for inhibition of PSinf,int to yield an inverse increase in AUCR. The importance of these rate-limiting assumptions was misinterpreted by multiple authors in multiple papers because the authors attempted to explain the results in terms of hepatic clearance rather than in terms of outcome, AUC. Thus, it is unnecessary to make any assumptions concerning rate-determining processes to predict that rifampin inhibition of OATP1B1 and 1B3 will increase AUC of BDDCS Class 2, 3 and 4 and ECCS Class 1B and 3B statins, independent of whether metabolism is extensive or not relative to transport. This concept is demonstrated in our glyburide-rifampin interaction study (19) as shown in Table 1 of that paper, where concomitant dosing of 600 mg IV rifampin following a single oral 10 mg dose of glyburide vs a control single oral dose of glyburide yielded an AUCR of 2.18. Rifampin was then dosed continuously for 6 days and AUCR for glyburide was determined under enzyme induced vs noninduced conditions (when no rifampin was measureable in the plasma), resulting in an AUCR value of 0.35, indicating a marked increase in metabolism. However, giving a concomitant 600 mg rifampin IV dose under enzyme induced conditions yielded an AUCR of 2.06 for glyburide, comparable to the magnitude of the interaction in the noninduced condition. That is, rifampin inhibition of PSinf,int gave the same AUCR result for the same dose of rifampin, independent of changes to the other parameters in Eq. 11, as would be expected. From Eq. 11 we may deduce that the decrease in AUC for the enzyme induction condition is due to decreased FG, since the term will only increase (and approach unity) when CLH,int increases due to induction. Since the FG term does not appear in the clearance equation, this supports our contention that the proper predictive metrics should be AUC based. Thus, it is incorrect to assume that changes in metabolism will not affect AUC for carboxylic acids that are substrates for OATP1B1 and 1B3. This holds for atorvastatin also, as the drug label indicates that concomitant multiple dosing of enzyme inducers such as rifampin and phenytoin can lead to decreased AUC.
From Eq. 14 we can see that changes in PSinf,int will have no effect on AUCH for an oral dose and thus, as reported by a number of authors, a drug interaction yielding increased systemic AUC would not be expected to change the pharmacodynamic outcome of drugs where AUCH is the driving concentration, such as the statins. No assumptions concerning rate-determining steps are necessary to reach this conclusion. In contrast, in our glyburide study (19) where effect is related to the systemic concentration, concomitant rifampin following one-half of the usual single dose of glyburide yielded adverse effects.
A.2. PBPK considerations, volume of distribution and models of hepatic clearance.
Recently, a number of excellent papers have been published examining the use of physiologically based pharmacokinetic (PBPK) modeling to characterize the critical parameters in oral DDIs and the use of the bottom-up approach to predict these DDIs from in vitro measures (11, 15, 16, 20–27). These publications are extremely complex and the PBPK approach is daunting to many pharmaceutical scientists. However, much of the outcome of these analyses becomes obvious when examined in terms of Eqs. 11 and 14. In Fig. 2 we reproduce the concentration time curves for a single oral 0.2 mg dose of cerivastatin without and with concomitant oral cyclosporine (28), which was recently analyzed by Yao et al. (27). Observation of Fig. 2 tells us that AUC significantly increased with little change in terminal half-life. Examination of Eq. 11 indicates that AUC would increase significantly if PSinf,int, fu,B or CLH,int decreased (the latter if PSeff,int was not negligible compared to CLH,int) or alternatively if Fabs · FG or PSeff,int increased. One would expect that if the decrease in either PSinf,int or CLH,int (or both) and/or the increase in PSeff,int were significant, the terminal half-life for cerivastatin might be expected to change, which does not appear to be the case. However, it is possible that changes in PSinf,int and/or PSeff,int by concomitant cyclosporine could also result in similar changes in volume of distribution, leaving half-life unchanged. And, in fact, Mück et al. (28) report that V1/F (volume of the central compartment divided by bioavailability) decreased by 67% when CL/F decreased by 73%, possible explaining the lack of change in terminal half-life. We address the importance of characterizing the volume of distribution change subsequently below and in our analysis of fluvastatin. Returning to the Eq. 11 analysis, although the cerivastatin protein binding was not examined, it is difficult to imagine a drug-drug interaction significantly increasing protein binding, leaving an increase in Fabs · FG as a very possible explanation for the cerivastatin-cyclosporine interaction. In their extensive PBPK analysis, Yao et al. (27) concluded that a portion of the AUC increase for cerivastatin blood concentrations with concomitant cyclosporine can be explained by PSinf,int inhibition, but the majority of the increase was due to increased Fabs · FG, a condition that had not been previously considered. We include this detailed analysis to indicate that much of DDI causation following oral dosing can be anticipated when investigators consider the AUC equations presented here, which are usually more revealing than examining rate-determining steps in clearance.
Fig. 2.
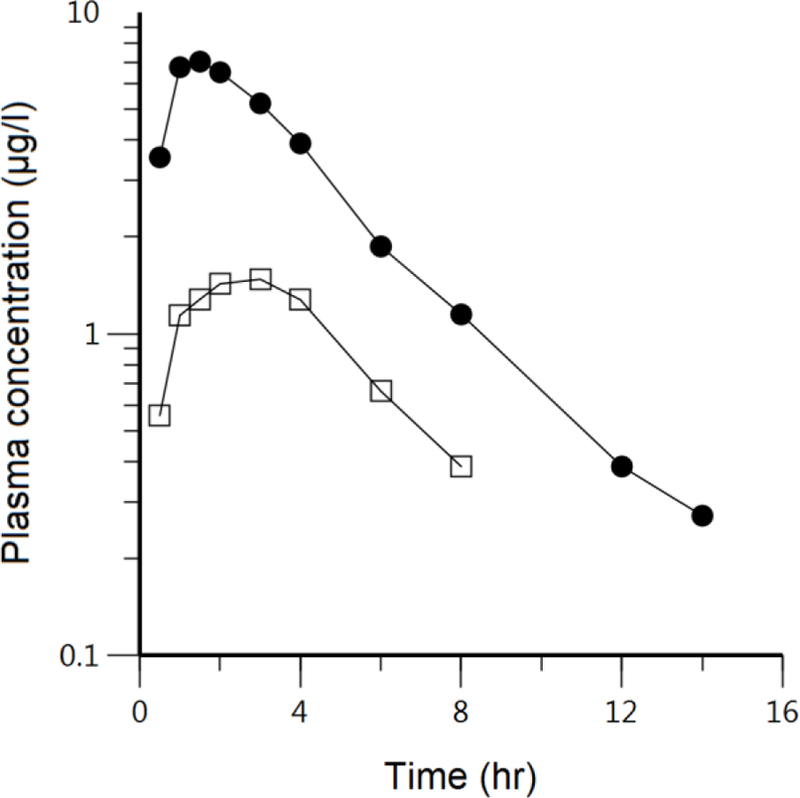
Cerivastatin log plasma concentration-time profiles following 0.2 mg single oral doses in 12 kidney transplant recipients receiving stable individual cyclosporine (CsA) treatment (solid circles) compared to 12 healthy subjects without cyclosporine intake (open squares). Reproduced with permission from Mück et al. (28).
It is important to consider the possibility of volume of distribution changes when transporters are inhibited, especially in the PBPK models used in the analyses above, while anticipating no change in volume of distribution when intrinsic clearance is altered. Grover and Benet (29) addressed this issue and found that for drugs eliminated by the liver, inhibition of uptake transporters caused volume of distribution to decrease. Volume of distribution changes are an important consideration in PBPK modeling since the final outcome attempts to predict the time course of systemic concentrations, not just AUC changes, and uses this fitting of time course concentrations as a measure of the effectiveness of the model. Presently PBPK models, e.g., Simcyp, do not account for transporter-mediated changes in volume of distribution, which was noted by Wang et al. (24) who were unable to adequately model the rifampin-rosuvastatin interaction using either a bottom up or top down approach.
For example, in our analysis of the effect of IV rifampin on atorvastatin pharmacokinetics, Lau et al. (30) showed that the ratio of CL/F in the control versus the rifampin phase was 7.7, but the ratio of Vss/F in the control versus the rifampin phase was 17.7 and the half-life ratio was 2.7. We also recently demonstrated for 20 mg oral rosuvastatin doses in White subjects wild type for both OATP1B1 and BCRP that the ratio of CL/F in control versus a 600 mg IV single dose of rifampin was 3.6, while the ratio of Vss/F in the control versus rifampin phase was 12.2 and the half-life ratio was 1.6 (31). In contrast, as noted above, Mück et al. (28) when analyzing the cyclosporine-cerivastatin interaction found no change in half-life, which as we noted above is consistent with V1/F changing in a parallel manner with CL/F.
However, in analyzing the atorvastatin DDI data, we must also consider the study of Maeda et al. (32), where IV dosing of the CYP3A inhibitor itraconazole did not increase the AUC of oral atorvastatin over 10 hrs. The data are unusual in that mean atorvastatin levels do not differ significantly over the 10 hr sampling period with or without itraconazole; they seem to decrease in the first 2 hrs but then increase back to Cmax levels at 6 hrs, then from 6 to 10 hrs mean atorvastatin concentrations with concomitant itraconazole appear to decrease slower than in the absence of itraconazole. Perhaps, if measurements had been made for longer periods of time than 4 hrs after the second peak there would have been a difference in AUC values. But assuming no difference, Maeda et al. (32) explain the results by suggesting that CLH,int >> PSeff,int, therefore the CLH,int terms in the numerator and denominator of Eq. 11 cancel each other, and since IV itraconazole is not expected to effect FG, AUC is unchanged.
We raise another issue related to PBPK modeling concerning models of hepatic elimination. After describing the extended clearance concept leading to Eq. 5, Miyauchi et al. (6) then applied the relationship to the parallel tube model of hepatic clearance. Similarly, Kusuhara and Sugiyama (7) and Yoshikado et al. (15, 16) describe a PBPK extended clearance model with 5 consecutive in-series liver compartments where each liver compartment mimics the dispersion model. However, as shown here, and as recognized by Pang, Caminesch, Varma, Unadkat, Riley and their co-workers (5, 9–14, 17, 20, 22), the extended clearance relationship is derived from the well-stirred model. Nevertheless, the dispersion clearance approach appears to be universally used to model organ clearance as described throughout the PBPK literature. However, even though this general PBPK treatment ignores the derived relationship here that the extended clearance is a well-stirred model concept, the outcome results in little prediction error, just many unnecessary computational steps. Thus, there is no advantage to using a more complicated model of organ clearance than the well-stirred model when transporter effects are relevant, but if more complex models are used any differences will be negligible. However, the recognition here that the extended clearance concept is derived from the well-stirred model explains why PBPK models function best with multiple (often 5) consecutive liver compartments when FH is low. Each well-stirred model compartment can only decrease concentrations by a single step, since there is no incremental metabolism as in the parallel tube and axial dispersion models. However, the incremental process can be mimicked by the series of consecutive well-stirred model steps.
A.3. Protein binding changes.
Although it appears from Eq. 11 that drug interactions related to protein binding can be important, and there is no doubt that protein binding interactions can change total drug AUC measurements, all of these interactions related to systemic concentrations following oral dosing will be clinically irrelevant since pharmacodynamic outcomes are related to unbound concentrations as shown by Benet and Hoener (33). As can be seen in Eq. 11, unbound AUC (i.e., fu,B · AUC ) is only a function of PSinf,int, PSeff,int, CLH,int, Fabs and FG. For BDDCS Class 1 drugs only FG and CLH,int interactions can be clinically relevant, since BDDCS Class 1 drugs do not show clinically relevant changes due to transporters (34). In contrast BDDCS and ECCS Class 2 drugs can be affected by intestinal efflux transporters such as P-glycoprotein and BCRP that can cause Fabs changes. A metabolic interaction can affect FG, in addition to CLH,int, for drugs that are substrates for enzymes that are present in significant amounts in the intestine such as CYP3A, glucuronosyl transferase and sulfotransferase. Similarly, changes in intrahepatic protein binding (fu,H) will have no effect on pharmacodynamic outcomes related to intrahepatic concentrations, such as for statins. As can be seen in Eq. 14, unbound AUCH,u (i.e., fu,H · AUCH ) is only a function of CLH,int, Fabs and FG.
A.4. Intrinsic permeability clearances, fraction unbound measurements and Kp,uu.
It is useful to understand why the derivations here must be in terms of the intrinsic uptake, efflux and diffusional clearances as well as fraction unbound in blood. If the derivations related to the influx and efflux transporter driving force processes were characterized in terms of total drug transport clearances, i.e., (PSinf · CNHL) and (PSeff · CH ), rather than using intrinsic transport clearances, the resulting systemic concentration relationships comparable to Eqs. 7 and 12 would contain fu,H, the difficult to measure fraction unbound in the hepatocyte. Therefore, if it is possible to measure elimination (metabolism and biliary excretion) and basolateral efflux for total drug, under these conditions (which is potentially quite difficult), no measure of fu,H or Kp,uu is necessary to calculate or predict the AUCR-factor, since
| (15) |
This relationship is often attributed to Liu and Pang (17), Shitara et al. (35) and Barton et al. (11), with the latter authors explicitly indicating that the transport clearances are intrinsic clearance parameters. We believe that the apparent necessity of determining Kp,uu in many extended clearance analyses results from the lack of recognition that in the derivation of the extended clearance concept, the relevant transport clearances are intrinsic transport clearances, not total transport clearances. This finding partially contradicts the 2013 review of the International Transporter Consortium (36) where the authors summarize their findings as: “The intracellular concentration of the unbound form of a drug is an important parameter for predicting drug efficacy, toxicity and DDIs”. We agree that predictions of drug efficacy and toxicity are dependent on unbound intracellular drug concentrations, as well as for determining the relevance of an intracellular perpetrator drug, but the derivations here (Eqs. 13 and 14) suggest that this is not true for predicting clinically relevant DDIs related either to systemic or intracellular concentrations.
In the present manuscript we do not detail the methodologies for determining these permeability and elimination clearances. However, the methodologies employed are neither trivial nor reliable. Studies often involve hepatocyte uptake studies over a range of drug concentrations to be able to estimate Vmax and Km parameters, allowing active versus passive permeability to be determined, studies at 4°C or in inactivated/dead hepatocytes to differentiate unspecified binding effects, microsome studies to estimate metabolic clearance, sandwich-cultured hepatocytes to differentiate biliary clearance from metabolic clearance, and attempts to predict efflux permeability clearances by subtracting metabolic and biliary clearances from total cellular clearance measures. Layered on top of the experimental difficulties in carrying out such studies is the recognition that in vitro to in vivo extrapolation is unreliable with in vitro measures predominantly and often significantly under-predicting in vivo clearance even when only metabolism is evaluated as we and others have well documented (37–40). For example, in the Yao et al. (27) cerivastatin-cyclosporine DDI analysis the in vitro value for fraction of cerivastatin metabolized by CYP2C8 was found to be too low to account for the observed clinical data. However, the authors conducted a PBPK sensitivity analysis to modify the in vitro value to allow for improved prediction of the cerivastatin concentration-time curve. Thus, the PBPK studies referenced above and the cerivastatin-cyclosporine discussion demonstrate the possibility of utilizing this powerful methodology to examine different hypotheses and to carry out sensitivity analyses to validate or modify in vitro measurements.
A.5. Intrinsic permeability clearances, active vs passive.
In this manuscript we have deliberately derived the equations utilizing the sum of passive and active intrinsic permeability parameters, since these sums define AUC. Thus, just as above we don’t utilize β in predicting AUCR, we make a similar proposal concerning Rdif ( the ratio of passive intrinsic influx rate to active intrinsic influx rate). Equation 11 indicates that the total influx and efflux intrinsic clearances should be considered in predicting AUCR, with no assumption concerning Rdif. However, Rdif is useful in predicting whether transporter inhibition is an important driver of AUC change. But, we caution again that in vitro measures may not predict in vivo relevance. Here again sensitivity analyses in PBPK provide a useful approach.
A.6. Utility of AUCR-based analyses: Fluvastatin as an example.
The effects of concomitant dosing of cyclosporine with fluvastatin are depicted in Fig. 3 as reported by Park et al. (41). These data appear very similar to those for cerivastatin in Fig. 2, i.e., a marked increase in AUC with little change in half-life or curve shape. Could the fluvastatin data be explained based on Eq. 11 using the same rationale as for cerivastatin? First, we consider the human studies of Niemi et al. (42) that demonstrated no clinically significant differences in the pharmacokinetics for pharmacogenomic variants of OATP1B1 for the BDDCS Class 1 drug fluvastatin. It is possible in Eq. 11 that the transport intrinsic clearances are just high passive permeability rates and therefore would not be affected by pharmacogenomic variants of OATP1B1 for a 40 mg oral fluvastatin dose. Alternatively, the lack of effect of OATP1B1 variants could be explained by other hepatic uptake transporters being more important. However, one might expect that if cyclosporine markedly inhibited these transporters fluvastatin half-life would increase, unless as we proposed above for cerivastatin, inhibition of uptake transporters decreased volume of distribution to an equivalent extent. The hypothesis of other uptake transporters being more relevant is probably more viable since Takehara et al. (43) recently showed that for a low oral dose of fluvastatin (2mg) in a cocktail study, a 300 mg oral rifampin dose significantly increased fluvastatin plasma concentrations. A 600 mg rifampin dose did not result in significant further inhibition, suggesting the possibility that the transporter inhibition could be saturated and that fluvastatin transport intrinsic clearances are primarily passive. Further, it should be noted that the Niemi et al. OATP1B1 variant study was conducted at a much higher fluvastatin dose (40 mg) and that it is possible that these transporter intrinsic clearances are also primarily passive permeability, potentially overwhelming the effects of OATP1B1 polymorphism. We are undertaking the rifampin interaction study at a clinically relevant fluvastatin dose. We caution, as before, that in vitro determinations of Rdif may not always translate to in vivo relevance for BDDCS Class 1 high Qdiff,int drugs like fluvastatin.
Fig. 3.
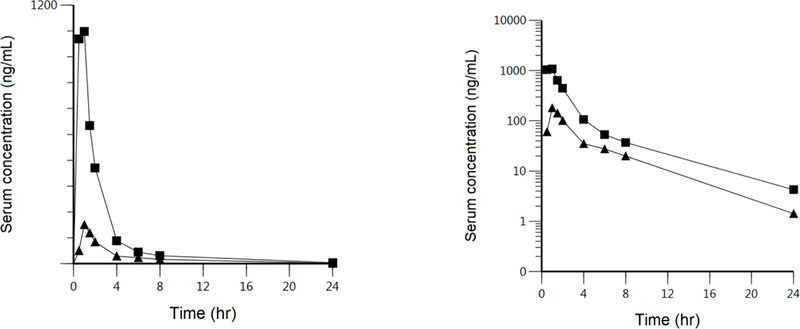
Fluvastatin linear and log plasma concentration-time profiles in 10 heart transplant recipients receiving continuous cyclosporine doses (solid squares) compared to 10 healthy subjects after administration of 40 mg oral fluvastatin without cyclosporine intake (solid triangles). Transformed to log plasma concentrations from the report of Park et al. (41).
However, here we will assume that the Takehara results (43) do confirm that active PSinf,int transport is relevant thereby assuming CLH,int >> PSeff,int to be most consistent with the available data. Thus, Eq. 11 becomes
| (16) |
which is the equation explaining the lack of an effect of IV itraconazole on oral atorvastatin reported by Maeda et al. (32), as discussed above. This could also explain the lack of an effect of an oral dose of gemfibrozil on the AUC of orally dosed fluvastatin (44). Gemfibrozil is a potent CYP2C9 inhibitor, but since this term is cancelled out in Eq. 11, no change would be expected. Oral gemfibrozil might also be expected to inhibit intestinal CYP2C9 (stated to be approximately 15% of the CYPs in the intestinal tissue) but as noted by Watanabe et al. (45) based on the oral/IV study of Tse et al. (46), Fabs · FG for fluvastatin approaches 1. Therefore, no enzyme inhibition effect would be expected based on Eq. 16. However, enzyme induction could affect FG consistent with the marked decrease in AUC of fluvastatin with multiple dosing of rifampin (47). Gemfibrozil is also an inhibitor of OATPs, but not a very potent inhibitor so any effect on PSinf,int could be minimal. Sharma et al. (48) could not determine an IC50 for gemfibrozil decreasing OATP1B1 activity on fluvastatin in HEK293-OATP1 (common wild-type variant) cells versus IC50s of 18 µM for pravastatin, 19 µM for rosuvastatin and 32 µM for atorvastatin, concordant with the results of Niemi et al. (42), who found no change in fluvastatin pharmacokinetics in subjects with decreased OATP1 activity. Although gemfibrozil is not a potent inhibitor of OATPs, it is possible that gemfibrozil glucuronide is, but our analysis did not consider this.
Yoshikado et al. (15) could not explain the results in Fig. 3 using PBPK modeling together with β, Rdif, inhibition of biliary excretion clearance and enteroheptic recirculation of fluvastatin, and suggest that an unknown “complex CsA-mediated inhibitory mechanism may be present”. However, based on the finding of rifampin increasing fluvastatin AUC reported two years later by Takehara et al. (43) and the statement of Yoshikado et al. (15) that the inhibitory constants for unbound drug (Ki,u) and measured cyclosporine concentrations were consistent with the 3.5 fold increase in AUC shown in Fig. 3, we suspect that the inability to adequately fit the resulting plasma concentrations using a bottom-up approach is more likely a deficiency of the PBPK model to consider volume of distribution changes, their resulting effects on elimination rate constants, and therefore the shape of the curve. Thus, we believe that the interactions with fluvastatin can be explained and predicted based on Eq. 16. Yoshikado et al. (15) also tested the possibility that cyclosporine, a potent BCRP and MRP2 inhibitor, could affect the biliary clearance of fluvastatin, a known substrate of these two transporters. No significant effect was found as would be predicted by Eq. 16.
B. The General Relationship for IV Administered Drugs
The AUC equations following IV dosing are markedly more complicated than following oral dosing. General equations, Eqs. 6 and 13, with no additional rate-determining assumptions, will predict AUCR interactions in the systemic circulation and within the hepatocyte, respectively. As opposed to oral dosing, where the great majority of the potential interactions can be understood based on the general Eqs. 11 and 14, characterization of rate-determining steps is necessary in predicting AUCR following IV dosing.
B.1. The well-stirred model of organ elimination where uptake/efflux is significantly greater than elimination.
Under these conditions, the original intrinsic clearance derivation (8, 49) results when the intrinsic influx and efflux clearances do not differ and are much greater than the intrinsic hepatic elimination clearance.
That is,
Then dividing numerator and denominator of Eq. 5 by PSinf,int and recognizing that the ratio CLH,int/PSinf,int will approach zero, Eq. 5 becomes the well-stirred model organ clearance relationship,
| (17) |
Pfizer scientists (12, 13) also demonstrated this outcome. It is probable that when both are only passive diffusional intrinsic clearances (Qdiff,int ). It should be recognized that the well-stirred model makes no assumption concerning the relative magnitude of blood flow and these diffusional clearances. Rowland and Pang (2) incorrectly characterized this relationship as one of the three assumptions they propose to support their argument that Eq. 1 is model independent. As recognized for the well-stirred model following IV dosing
| (18) |
Equation 18 will be the appropriate relationship to utilize to predict the AUCR-factor for all IV dosed BDDCS Class 1 drugs and for IV dosed BDDCS Class 2 drugs that appear to be unaffected by transporters, such as felodipine (50). Note that Eq. 18 allows differentiation related to blood flow and the extent of metabolism, with high clearance compounds being rate limited by blood flow to the organ of elimination. However, when QB >> fu,B · CLH,int, i.e., for low extraction ratio drugs, only changes in metabolic capacity and protein binding will affect the AUCR-factor as given by Eq. 18a
| (18a) |
The AUCH equation (Eq. 13) is even more complicated. However, for low extraction ratio drugs (QB >> fu,B · CLH,int) Eq. 13 reduces to
| (13a) |
But for high extraction ratio drugs all of the potential transport and elimination intrinsic clearances, blood flow and fraction unbound in blood and within the hepatocyte must be considered to evaluate AUC and AUCH.
B.2. High extraction ratio drugs where intrinsic efflux is significantly greater than intrinsic elimination.
Patilea-Vrana and Unadkat (14) simulate the situation where PSinf,int is inhibited when PSeff,int >> CLH,int (but using plasma parameters) with the resulting AUC equation.
| (19) |
At present there are no data in the literature that support such a scenario and we are unable to identify an IV dosed, high extraction drug that is a substrate for OATPs. Patilea-Vrana and Unadkat (14) attempt to explain their results using atorvastatin, but this is not appropriate since only oral atorvastatin DDI data are available, where QB is never relevant (Eq. 11). Thus, we believe this B.2. situation is not relevant.
B.3. Blood flow rate is significantly greater than intrinsic influx transport.
It is possible to consider the situation that Rowland and Pang (2) incorrectly considered as a well-stirred model assumption, that is QB >> CLinf,int. Then from Eq. 6
| (20) |
If in addition PSeff,int >> CLH,int and is equivalent to PSinf,int, i.e., the situation where both intrinsic transport rates are Qdiff,int, then Eq. 20 reverts to Eq. 18a. Alternatively if in addition CLH,int >> PSeff,int, then Eq. 20 becomes
| (21) |
However, there are so few drug interactions studies following IV dosing of drugs that are transporter substrates, that it is difficult to relate these equations to experimental data. We believe that Eq. 20 could be relevant for IV dosing of BDDCS Class 2 compounds that are substrates for OAT2 hepatic uptake such as warfarin (24) and tolbutamide (25) and Eq. 21 for the BDDCS Class 2, 3 and 4 statins.
B.4. Protein binding changes.
As described above in section A.3. protein binding changes are clinically irrelevant for AUCR measurements for drug interactions following oral dosing both for systemic concentrations and intrahepatic concentrations. The same is true for low extraction ratio drugs following IV dosing (Eqs. 18a and 13a, respectively). However, for high extraction ratio drugs dosed IV, changes in fu,B can change AUCu for systemic concentrations (Eq. 6) and both changes in fu,B and fu,H can change AUCH,u (Eq. 13), requiring measurements or estimation of fu,H or Kp,uu.
CONCLUSIONS
The theoretical basis for the extended clearance model of organ elimination is derived from first principle mass balance relationships following both oral and IV dosing. We point out a number of characteristics that in previous publications have not been clearly specified and may be misinterpreted. The extended clearance concept is derived based on the well-stirred model. It is not appropriate to use alternate hepatic clearance models. The transport clearances in the equations are all intrinsic clearances, not total drug clearances. The systemic flow (QB) and protein binding (fu ) terms reflect blood measurements, not plasma. The AUCoral equations do not include QB terms and the numerators of the AUCoral equations do not include FH terms. These terms are already considered in the derivation. We propose that calculations of AUCR may be a more useful approach to evaluate drug-drug and pharmacogenomic interactions. We emphasize the need to characterize the effect of transporter inhibition and induction on changes in volume of distribution, since volume terms affect half-life and other rate constants describing the concentration-time course. We make this observation with respect to PBPK models and review the analyses of such models for the interactions of cyclosporine with cerivastatin and fluvastatin. The equations for intracellular (hepatic) AUC values are also presented and for oral dosing are only affected by changes in Fabs, FG and intracellular intrinsic elimination clearance, but not transport rates. Finally, we note that prediction of systemic and intrahepatic drug-drug interactions do not require knowledge of fraction unbound within the liver (fu,H ) or Kp,uu for substrates/victims.
Acknowledgments
SOURCE OF FUNDING
Supported in part by a Mary Anne Koda-Kimble Seed Award for Innovation. Dr. Benet is a member of the UCSF Liver Center supported by NIH Grant P30 DK026743. Ms. Bowman is supported by the National Science Foundation Graduate Research Fellowship Program (Grant 114427). Ms. Liu is supported by the China Scholarship Council. Ms. Sodhi is supported in part by an American Foundation for Pharmaceutical Education Pre-Doctoral Fellowship and NIGMS grant R25 GM56847.
Abbreviations:
- AH
amount of drug in the hepatocyte
- AUC
area under the concentration time curve
- AUCH
area under the concentration time curve within the hepatocyte
- AUCR-factor
ratio of AUC of substrate when perpetrator is active to AUC of substrate under similar conditions in the absence of the perpetrator
- ss
steady-state
- CH
total drug concentration in hepatocyte
- Cin
total drug blood concentration entering organ
- CL
clearance
- CLH,int,bil
biliary intrinsic clearance
- CLH,int,met
metabolic intrinsic clearance
- CLH,int
hepatic intrinsic clearance
- CNHL
total drug concentration in the non-hepatocyte portion of the liver
- Cout
total drug blood concentration exiting organ
- DDI
drug-drug interaction
- ER
extraction ratio
- F
bioavailability
- Fabs
fraction absorbed
- FG
fraction escaping intestinal elimination
- FH
fraction escaping hepatic elimination
- fu,B
fraction of unbound drug in blood
- fu,B,NHL
fraction of unbound drug in blood in the non-hepatocyte portion of the liver
- fu,H
fraction of unbound drug in hepatocyte
- IV
intravenous
- Ki,u
inhibitory constant for unbound drug
- Kp,uu
unbound partition coefficient
- MRT
mean residence time
- PSeff,int
basolateral efflux (both active and passive) intrinsic clearance
- PSinf,int
basolateral influx (both active and passive) intrinsic clearance
- QB
blood flow
- Qdiff,int
passive intrinsic diffusion clearance
- Rdif
ratio of passive intrinsic flux rate to active intrinsic flux rate
- Vss
volume of distribution steady-state
- β factor
ratio of metabolism plus biliary clearances to all intracellular clearances of a drug including basolateral efflux
Footnotes
CONFLICT OF INTEREST/DISCLOSURE
The authors declared no conflicts of interest.
REFERENCES
- 1.Benet LZ, Liu S, Wolfe AR. The universally unrecognized assumption in predicting drug clearance and organ extraction ratio. Clin Pharmacol Ther 2018;103:521–5. [DOI] [PMC free article] [PubMed] [Google Scholar]
- 2.Rowland M, Pang KS. Commentary on “The universally unrecognized assumption in predicting drug clearance and organ extraction ratio”. Clin Pharmacol Ther 2018;103:386–8. [DOI] [PubMed] [Google Scholar]
- 3.Benet LZ. Clearance revisited. Clin Pharmacol Ther 2018; invited Opinion, submitted.
- 4.Gillette JR, Pang KS. Theoretic aspects of pharmacokinetic drug interaction. Clin Pharmacol Ther 1977;22:623–39. [DOI] [PubMed] [Google Scholar]
- 5.Sirianni GL, Pang KS. Organ clearance concepts: new perspectives on old principles. J Pharmacokinet Biopharm 1997;25:449–70. [DOI] [PubMed] [Google Scholar]
- 6.Miyauchi S, Sugiyama Y, Sawada Y, Morita K, Iga T, Hanano M. Kinetics of hepatic transport of 4-methylumbelliferone in rats. Analysis by multiple indicator dilution method. J Pharmacokinet Biopharm 1987;15:25–38. [DOI] [PubMed] [Google Scholar]
- 7.Kusuhara H, Sugiyama Y. In vitro-in vivo extrapolation of transporter-mediated clearance in the liver and kidney. Drug Metab Pharmacokinet 2009;24:37–52.19252335 [Google Scholar]
- 8.Rowland M, Benet LZ, Graham GG. Clearance concepts in pharmacokinetics. J Pharmacokinet Biopharm 1973;1:123–36. [DOI] [PubMed] [Google Scholar]
- 9.Webborn PJH, Parker AJ, Denton RL, Riley RJ. In vitro-in vivo extrapolation of hepatic clearance involving active uptake: theoretical and experimental aspects. Xenobiotica 2007;37: 1090–109. [DOI] [PubMed] [Google Scholar]
- 10.Caminesch G, Umehara K. Predicting human hepatic clearance from in vitro drug metabolism and transport data: a scientific and pharmaceutical perspective for assessing drug-drug interactions. Biopharm Drug Dispos 2012;33:179–94. [DOI] [PubMed] [Google Scholar]
- 11.Barton HA, Lai Y, Goosen TC, Jones HM, El-Kattan AF, Gossed JR, Lin J, Varma MV. Model-based approaches to predict drug-drug interactions associated with hepatic uptake transporters: preclinical, clinical and beyond. Expert Opin Drug Metab Toxicol 2013;9:459–72. [DOI] [PubMed] [Google Scholar]
- 12.Varma MV, Steyn SJ, Allerton C, El-Kattan AF. Predicting clearance mechanism in drug discovery: extended clearance classification system (ECCS). Pharm Res 2015;32:3785–802. [DOI] [PubMed] [Google Scholar]
- 13.El-Kattan AF, Varma MVS. Navigating transporter sciences in pharmacokinetics characterization using the extended clearance classification system. Drug Metab Dispos 2018;46:729–39. [DOI] [PubMed] [Google Scholar]
- 14.Patilea-Vrana G, Unadkat JD. Transport vs. metabolism: what determines the pharmacokinetics and pharmacodynamics of drugs? Insights from the extended clearance model. Clin Pharmacol Ther 2016;100:413–8. [DOI] [PMC free article] [PubMed] [Google Scholar]
- 15.Yoshikado T, Yoshida K, Kotani N, Nakada T, Asaumi R, Toshimoto K, Maeda K, Kusuhara H, Sugiyama Y. Quantitative analyses of hepatic OATP-mediated interactions between statins and inhibitors using PBPK modeling with a parameter optimization method. Clin Pharmacol Ther 2016;100:513–23. [DOI] [PubMed] [Google Scholar]
- 16.Yoshikado T, Maeda K, Kusuhara H, Furihata K-I, Sugiyama Y. Quantitative analyses of the influence of parameters governing rate-determining process of hepatic elimination of drugs on the magnitudes of drug-drug interactions via hepatic OATPs and CYP3A using physiologically based pharmacokinetic models. J Pharm Sci 2017;106:2738–50. [DOI] [PubMed] [Google Scholar]
- 17.Liu L, Pang KS. The roles of transporters and enzymes in hepatic drug processing. Drug Metab Dispos 2015;33:1–9. [DOI] [PubMed] [Google Scholar]
- 18.Rowland M Influence of route of administration on drug availability. J Pharm Sci 1972;61:70–4. [DOI] [PubMed] [Google Scholar]
- 19.Zhang HX, Huang Y, Frassetto LA, Benet LZ. Elucidating rifampin’s inducing and inhibiting effects on glyburide pharmacokinetics and blood glucose in healthy volunteers: unmasking the differential effects of enzyme induction and transporter inhibition for a drug and its primary metabolite. Clin Pharmacol Ther 2009;85:78–85. [DOI] [PMC free article] [PubMed] [Google Scholar]
- 20.Varma MV, Lai Y, Feng B, Litchfield J, Goosen TC, Bergman A. Physiologically based modeling of pravastatin transporter-mediated hepatobiliary disposition and drug-drug interactions. Pharm Res 2012;29:2860–73. [DOI] [PubMed] [Google Scholar]
- 21.Yoshida K, Maeda K, Sugiyama Y. Hepatic and intestinal drug transporters: prediction of pharmacokinetic effects caused by drug-drug interactions and genetic polymorphisms. Annu Rev Pharmacol Toxicol 2013;53:581–612. [DOI] [PubMed] [Google Scholar]
- 22.Varma MV, Bi Y-a, Kimoto E, Lin J. Quantitative prediction of transporter- and enzyme-mediated clinical drug-drug interactions of organic anion-transporter polypeptide 1B1 substrates using a mechanistic net-effect model. J Pharmacol Exp Ther 2014;351:214–23. [DOI] [PubMed] [Google Scholar]
- 23.Tohimoto K, Tomoda Y, Chiba K, Sugiyama Y. Analysis of the change in the blood concentration-time profile caused by complex drug-drug interactions in the liver considering the enterohepatic circulation: examining whether the inhibition constants for uptake, metabolism, and biliary excretion can be recovered by the analyses using physiologically based pharmacokinetic modeling. J Pharm Sci 2017;106:2727–38. [DOI] [PubMed] [Google Scholar]
- 24.Wang Q, Zheng M, Liel T. Investigating transporter-mediated drug-drug interactions using a physiologic based pharmacokinetic model of rosuvastatin. CPT Pharmacometrics Syst Pharmacol 2017;6:228–38. [DOI] [PMC free article] [PubMed] [Google Scholar]
- 25.Bi Y, Lin J, Mathialagan S, Tylaska L, Callegari E, Rodrigues AD, Varma MVS. Role of hepatic organic anion transporter 2 in the pharmacokinetics of R- and S-warfarin: in vitro studies and mechanistic evaluation. Mol Pharmaceutics 2018;15:1284–95. [DOI] [PubMed] [Google Scholar]
- 26.Bi Y, Mathialagan S, Tylaska L, Fu M, Keefer J, Vildhede A, Costales C, Rodrigues AD, Varma MVS. Organic anion transporter 2 mediates hepatic uptake of tolbutamide, a CYP2C9 probe drug. J Pharmacol Exp Ther 2018;364:390–8. [DOI] [PubMed] [Google Scholar]
- 27.Yao Y, Toshimoto K, Kim S-J, Yoshikado T, Sugiyama Y. Quantitative analysis of complex drug-drug interactions between cerivastatin and metabolism/transport inhibitors using physiologically based pharmacokinetic modeling. Drug Metab Dispos 2018;46:924–33. [DOI] [PubMed] [Google Scholar]
- 28.Mück W, Mai I, Fritsche L, Ochmann K, Rohde G, Unger S, Johne A, Bauer S, Budde K, Roots I, Neumayer H-H, Kuhlmann J. Increase in cerivastatin systemic exposure after single and multiple dosing in cyclosporine-treated kidney transplant recipients. Clin Pharmacol Ther 1999;65:251–61. [DOI] [PubMed] [Google Scholar]
- 29.Grover A, Benet LZ. Effects of drug transporters on volume of distribution. AAPS J 2009;11:250–61. [DOI] [PMC free article] [PubMed] [Google Scholar]
- 30.Lau YY, Huang Y, Frassetto L, Benet LZ. Effect of OATP1B transporter inhibition on the pharmacokinetics of atorvastatin in healthy volunteers. Clin Pharmacol Ther 2007;81:194–204. [DOI] [PubMed] [Google Scholar]
- 31.Wu H-F, Hristeva N, Chang J, Liang X, Li R, Frassetto L, Benet LZ. Rosuvastatin pharmacokinetics in Asia and White subjects wild type for both OATP1B1 and BCRP under control and inhibited conditions. J Pharm Sci 2017;106:2751–7. [DOI] [PMC free article] [PubMed] [Google Scholar]
- 32.Maeda K, Ikeda Y, Fujita T, Yoshida K, Azuma Y, Haruyama Y, Yamane N, Kumagai Y, Sugiyama Y. Identification of the rate-determining process in the hepatic clearance of atorvastatin in a clinical cassette microdosing study. Clin Pharmacol Ther 2011;90:575–81. [DOI] [PubMed] [Google Scholar]
- 33.Benet LZ, Hoener B-a. Changes in plasma protein binding have little clinical relevance. Clin Pharmacol Ther 2002;71:115–21 [DOI] [PubMed] [Google Scholar]
- 34.Shugarts S, Benet LZ. The role of transporters in the pharmacokinetics of orally administered drugs. Pharm Res 2009;26:2039–54. [DOI] [PMC free article] [PubMed] [Google Scholar]
- 35.Shitara Y, Horie T, Sugiyama Y. Transporters as a determinant of drug clearance and tissue distribution. Eur J Pharm Sci 2006;27:425–46. [DOI] [PubMed] [Google Scholar]
- 36.Chu X, Korzekwa K, Elsby R, Fenner K, Galetin A, Lai Y, Matsson P, Moss A, Nagar S, Rosania GR, Bai JP, Polli JW, Sugiyama Y, Brouwer KL. Intracellular drug concentrations and transporters: measurement, modeling, and implications for the liver. Clin Pharmacol Ther 2013;94:126–41. [DOI] [PMC free article] [PubMed] [Google Scholar]
- 37.Chiba M, Ishii Y, Sugiyama Y. Prediction of hepatic clearance in human from in vitro data for successful drug development. AAPS J 2009;2:262–76. [DOI] [PMC free article] [PubMed] [Google Scholar]
- 38.Bowman CM, Benet LZ. Hepatic clearance predictions from in vitro-in vivo extrapolation and the Biopharmaceutics Drug Disposition Classification System. Drug Metab Dispos 2016;44:1731–35. [DOI] [PMC free article] [PubMed] [Google Scholar]
- 39.Wood FL, Houston JB, Hallifax D. Clearance prediction methodology needs fundamental improvement: trends common to rat and human hepatocytes/microsomes and implications for experimental methodology. Drug Metab Dispos 2017;45:1178–88. [DOI] [PubMed] [Google Scholar]
- 40.Wood FL, Houston JB, Hallifax D. Importance of the unstirred water layer and hepatocyte membrane integrity in vitro for quantification of intrinsic metabolic clearance. Drug Metab Dispos 2018;46:268–78. [DOI] [PubMed] [Google Scholar]
- 41.Park J-W, Siekmeier R, Lattke P, Merz M, Mix C, Schüler S, Jaross W. Pharmacokinetics and pharmacodynamics of fluvastatin in heart transplant recipients taking cyclosporine A. J Cardiovasc Pharmacol Therapeut 2001;6:351–61. [DOI] [PubMed] [Google Scholar]
- 42.Niemi M, Pasanen MK, Neuvonen PJ. SLCO1B1 polymorphism and sex affect the pharmacokinetics of pravastatin but not fluvastatin. Clin Pharmacol Ther 2006;80:356–66. [DOI] [PubMed] [Google Scholar]
- 43.Takehara I, Yoshikado T, Ishigame K, Mori D, Watanabe N, Ando O, Maeda K, Sugiyama Y, Kusuhara H. Comparative study of the dose-dose-dependence of OATP 1B inhibition by rifampicin using probe drugs and endogenous substrates in healthy volunteers. Pharm Res 2018;35:e-pub ahead of print May 10, 2018. [DOI] [PubMed] [Google Scholar]
- 44.Spence JD, Munoz CE, Hendricks L, Latchinian L, Khouri HE. Pharmacokinetics of the combination of fluvastatin and gemfibrozil. Am J Cardiol 1995;76:80A–83. [DOI] [PubMed] [Google Scholar]
- 45.Watanabe T, Kusuhara H, Sugiyama Y. Application of physiologically based pharmacokinetic modeling and clearance concept to drugs showing transporter-mediated distribution and clearance in humans. J Pharmacokinet Pharmacodyn 2010;37:575–90. [DOI] [PubMed] [Google Scholar]
- 46.Tse FLS, Jaffe JM, Troendle A. Pharmacokinetics of fluvastatin after single and multiple doses in normal volunteers. J Clin Pharmacol 1992;32:630–8. [DOI] [PubMed] [Google Scholar]
- 47.Garnett WR. Interactions with hydroxymethylglutaryl-coenzyme A reductase inhibitors. Am J Health-Syst Pharm 1995;52:1639–45. [DOI] [PubMed] [Google Scholar]
- 48.Sharma P, Butters CJ, Smith V, Elsby R, Surry D. Prediction of OATP1B1 mediated drug-drug interaction potential of an investigational drug against a range of statins. Eur J Pharm Sci 2012;47:244–55. [DOI] [PubMed] [Google Scholar]
- 49.Wilkinson GR, Shand DG. A physiological approach to hepatic drug clearance. Clin Pharmacol Ther 1975;18:377–90. [DOI] [PubMed] [Google Scholar]
- 50.Wu C-y, Benet LZ. Predicting drug disposition via application of BCS: transport/absorption/elimination interplay and development of a biopharmaceutics drug disposition classification system. Pharm Res 2005;22:11–23. [DOI] [PubMed] [Google Scholar]