

Abstract
Current evidence suggests that age-associated inflammation, a strong risk factor for the health status of elderly individuals, is closely associated with gut microbiota. Previous animal studies have demonstrated a benefit of microbiota-driven therapy in decreasing low-grade chronic inflammation in elderly individuals; however, it remains controversial in clinical studies. Therefore, the present systematic review and meta-analysis were designed to assess the effects of microbiota-driven therapy on inflammatory markers in elderly individuals. PubMed, EMBASE, and the Cochrane Library were searched with no language restrictions from the inception of the database to November 11th, 2018 to identify all existing literature. We calculated pooled standard mean difference (SMD) using fixed effect model or random effect model to assess the effects of microbiota-driven therapy on elderly individuals. The methodological quality of the studies was determined according to the Cochrane Handbook. The publication bias was evaluated by funnel plot and Egger regression test. Ten randomized controlled studies, with 689 elderly individuals (347 individuals in the microbiota-driven therapy group and 342 individuals in the placebo group), were included in the analysis. Compared with placebo, microbiota-driven therapy did not decrease the levels of tumor necrosis factor-α (SMD, -0.24; 95% CI, -0.69 to 0.21; p = 0.30; I2 = 82.7%), interleukin-6 (SMD, -0.13; 95% CI, -0.74 to 0.49; p = 0.69; I2 = 90.7%) and interleukin-10 (SMD, 1.00; 95% CI, -0.15 to 2.15; p = 0.09; I2 = 96.3%). In addition, the microbiota-driven therapy also did not decrease the levels of C reactive protein (SMD, -1.28; 95% CI, -2.62 to 0.06; p = 0.06; I2 = 96.2%), interleukin-1β (SMD, -0.22; 95% CI, -0.81 to 0.37; p = 0.46; I2 = 73.8%), interleukin-8 (SMD, -0.03; 95% CI, -0.67 to 0.61; p = 0.93; I2 = 88.0%) and monocyte chemoattractant protein-1 (SMD, -0.11; 95% CI, -0.41 to 0.20; p = 0.49; I2 = 0%) when compared with placebo. No obvious publication bias was observed (p>0.05). In conclusion, the present meta-analysis of available randomized controlled studies did not suggest any significant benefit of microbiota-driven therapy in decreasing the inflammatory responses of elderly individuals.
Introduction
Age-associated inflammation is a strong risk factor for the health status of elderly individuals. Previous studies have demonstrated that elderly individuals with higher levels of inflammatory markers are less independent and more likely to develop a variety of late-life diseases[1–4], accompanied by a higher hospitalization rate and all-cause mortality rate[5,6]. Age-associated inflammation has also been shown to increase susceptibility to pneumococcal infection[7,8] and has been associated with increased disease severity and decreased survival from coronary heart disease in elderly individuals[9,10].
The evidence has proven that some gut microbiota promote aging-associated inflammation and that reversing these microbiota changes represents a potential therapeutic effect on reducing age-associated inflammation. Microbiota-driven therapy, mainly including the intake of probiotics, prebiotics or symbiotics, seems a promising approach to manage age-associated inflammation. Previous animal studies have demonstrated that microbiota-driven therapy changed the composition of the gut microbiota and decreased inflammatory markers[11]; however, it remains controversial in clinical studies. Some studies have indicated that microbiota-driven therapy decreased inflammatory biomarkers, such as tumor necrosis factor α (TNF-α) and C-reactive protein (CRP)[12,13]; in contrast, other studies have suggested no beneficial effects of the therapy[14,15]. Therefore, the present meta-analysis of randomized controlled trials (RCTs) was designed to assess the effect of microbiota-driven therapy on the inflammatory responses in elderly individuals.
Methods
This study was performed according to the guidelines of the 2009 Preferred Reporting Items for Systematic Reviews and Meta-Analysis statement (PRISMA)[16] (S1 Table). PRISMA is an evidence-based minimum set of items for reporting in systematic reviews and meta-analyses, which focuses on the reporting of reviews evaluating randomized trials[16]. The methodological quality of eligible studies was determined according to the recommendation of the Cochrane Handbook[17]. The Cochrane Handbook for systematic reviews of interventions contains methodological guidance for the preparation and maintenance of intervention reviews[17].
Data source and search strategies
Two reviewers (Hua Qu and Ying Zhang) searched PubMed, EMBASE, and the Cochrane Library with no language restrictions from the inception of the database to November 2018 to identify all existing literature. The searching strategies are supplied in the S2 Table. A manual search was also performed to identify relevant references from the selected articles and published reviews. The studies were eligible if they met the following inclusion criteria: (1) the study described a randomized, controlled, parallel or crossover trial; (2) the participants were healthy elderly individuals with age>60 years; (3) the intervention group received microbiota-driven therapy (probiotic, prebiotic or symbiotic), and the compared group received placebo.
Data extraction and assessment of study quality
Two reviewers (Hua Qu and Hua Chai) extracted data independently. If a disagreement occurred between them, it was resolved by consulting with the third investigator (Da-zhuo Shi). We would contact with authors if the article was only published in abstract form, and the studies with which we failed to obtain original data were excluded. The data extracted from the eligible studies were as follows: (1) the first author’s name and publication year, (2) intervention duration, (3) inclusion criteria, (4) intervention method, (5) number of individuals, (6) age of individuals, (7) percentage of males, and (8) clinical outcomes.
Statistical analysis
In this meta-analysis, the outcomes, which are continuous data, are used to calculate standard mean difference (SMD) presenting with effect size and 95% confidence intervals (CI); and P<0.05 (two-sided hypothesis testing) indicating a statistically difference between microbiota-driven therapy group and placebo group. Interstudy variations and heterogeneities were estimated using Cochran’s Q-test, with Ph<0.05(two-sided hypothesis testing) indicating a statistically significant heterogeneity[18]. Furthermore, the effects of heterogeneity were quantified using the I2 test (range, 0–100%), which represented the proportion of interstudy variability that was able to be contributed to heterogeneity rather than to chance[19]. When a Q-test with Ph<0.05 or I2≥ 50%, the heterogeneity among studies was considered to be statistically significant and the random-effects model was chosen for the meta-analysis; otherwise, the fixed-effects model was used[20]. We performed a subgroup analysis to detect the potential sources of heterogeneity in the condition of I2≥ 50%[20]. In addition, the meta-regression provided a linear regression using a random effects model (I2≥50%) or a fixed effects model (I2<50%) and predicted effect size from a predictor variable[21]. Sensitivity analysis was performed to check the robustness of the pooled results by eliminating one study at a time. The publication bias was evaluated by a funnel plot and Egger’s regression test[22]. Statistical analysis was performed by using Stata (version 12.0). We have registered protocol for the present systematic review and meta-analysis, and the registered number of PROSPERO is CRD 42018116433.
Results
Description of included studies
One thousand seven hundred and seventy-nine studies (775 from PubMed, 655 from EMBASE and 349 from the Cochrane Library) were identified; 352 articles were excluded because of duplicated records. After the titles and abstracts of articles were screened, 1390 articles were excluded due the study being in review format, experimental studies or the study being an inappropriate design and/or unavailable outcomes. After the remaining 37 full-text articles were reviewed, 27 articles were excluded due to no-randomized clinical trials, unavailable outcomes or irrelevant outcomes. Finally, 10 studies[12–15,23–28] (5 randomized controlled crossover studies and 5 randomized controlled paralleled studies) published in English from 2008 to 2017, with sample sizes ranging from 36 to 88 individuals and intervention periods ranging from 14 days to 180 days, were entered into our meta-analysis (Fig 1, Table 1). The total number of elderly individuals was 689 (347 individuals in the microbiota-driven therapy group and 342 individuals in the placebo group). Overall, the effects of microbiota-driven therapy were evaluated based on TNF-α in 7 study arms (241 individuals in the microbiota-driven therapy group and 236 individuals in the placebo group)[12–15,23,26,27], interleukin-6 (IL-6) in 6 study arms (236 individuals in the microbiota-driven therapy group and 232 individuals in the placebo group)[12,13,15,23,24,26], interleukin-10 (IL-10) in 6 study arms (208 individuals in the microbiota-driven therapy group and 208 individuals in the placebo group)[12–15,26,28], CRP in 4 study arms (148 individuals in the microbiota-driven therapy group and 148 individuals in the placebo group)[13,24–26], interleukin-8 (IL-8) in 4 study arms (189 individuals in the microbiota-driven therapy group and 164 individuals in the placebo group) [12,13,15,24], interleukin-1β (IL-1β) in 2 study arms (87 individuals in the microbiota-driven therapy group and 87 individuals in the placebo group)[12,13] and monocyte chemoattractant protein-1 (MCP-1) in 2 study arms (84 individuals in the microbiota-driven therapy group and 80 individuals in placebo group)[13,23].
Fig 1. Literature search process and study selection.

Table 1. Basic characteristics of individuals.
| Study | Duration | Inclusion criteria | Intervention | Individuals (T/P) |
Age(y) | Male(%) | Outcome | ||
|---|---|---|---|---|---|---|---|---|---|
| T | P | T | P | ||||||
| Park 2008 | 112 days | Age>60 | prebiotic vs. placebo | 78(41/37) | 65.89 ±1.29 | 65.76 ±1.39 | 58.54 | 51.35 | IL-6, TNF-α, MCP-1 |
| Ouwehand 2008 | 180 days | age>60 | probiotic vs. placebo |
36(18/18) | 84.3 ±0.98 | 84.3 ±0.98 | N | N | IL-10, TNF-α |
| Costabile 2017 | 21 days | age 60–80 | probiotic vs. placebo | 74(37/37) | 60–80 | 60–80 | N | N | IL-6, IL-8, CRP |
| Scheid 2014 | 63 days | Age>60 | prebiotic vs. placebo | 74(37/37) | 67.11±6.12 | 67.11±5.53 | N | N | CRP |
| Valentini 2015 | 56 days | age 65–85 | probiotic vs. placebo | 62(31/31) | 65–85 | 65–85 | N | N | IL-6, IL-10, CRP, TNF-α |
| Ouwehand 2009 | 14 days | Age>65 | probiotic vs. placebo | 47(24/23) | 70.3±7.2 | 71.7±6.2 | 20.8 | 30.4 | TNF-α |
| Vulevic 2015 | 70 days | age 65–85 | prebiotic vs. placebo | 80(40/40) | 65–85 | 65–85 | N | N | IL-6, IL-8, IL-10, TNF-α |
| Vulevic 2008 | 70 days | age 64–79 | prebiotic vs. placebo | 88(44/44) | 64–79 | 64–79 | 36.4 | 36.4 | IL-1β, IL-6, IL-8, IL-10, TNF-α |
| Macfarlane 2013 | 28 days | age 65–90 | synbiotic vs. placebo | 86(43/43) | 71.9±5.4 | 71.9±5.4 | 48.84 | 48.84 | IL-1β, IL-6, IL-8, IL-10, TNF-α, CRP, MCP-1 |
| Spaiser 2015 | 21 days | age 65–80 | probiotic vs. placebo | 44(22/22) | 73.9±15.3 | 71.8±20 | 60.9 | 60.9 | IL-10 |
Abbreviations: CRP, C reactive protein; TNF-α, tumor necrosis factor alpha; IL-1β, interleukin-1β; IL-6, interleukin-6; IL-8, interleukin-8; IL-10, interleukin-10; MCP-1, monocyte chemoattractant protein-1; T: microbiota-driven therapy group; P: placebo group; N, not clear.
Quality assessment
The quality assessment was performed to detect the potential risk biases. “Low risk”, “high risk” or “unclear risk” was categorized for all 10 included studies according to 7 sources of risk bias presented as sequence generation, allocation sequence concealment, blinding of individuals and personnel, blinding of outcome assessment, incomplete outcome data, selective outcome reporting and other potential sources of bias (Fig 2, Table 2). Taken together, no obvious attrition bias and reporting bias were observed, and the randomization and blinding in the included studies were considered adequate in the meta-analysis according to the Cochrane Handbook [17].
Fig 2. Risk of bias.

a, Risk of bias summary: each risk of bias item for each included study; b, risk of bias graph: each risk of bias item presented as percentages across all included studies.
Table 2. Quality assessment of included study.
| Study | Random sequence generation(selection bias) | Allocation concealment(selection bias) | Blinding of participants and presonel(preformance bias) | Blinding of outcome assessment(detection bias) | Incomplete outcome data(attrition bias) | Selective reporting (reporting bias) | Other bias |
|---|---|---|---|---|---|---|---|
| Park 2008 | Low risk | Low risk | Unclear risk | Unclear risk | Low risk | Low risk | Low risk |
| Ouwehand 2008 | Unclear risk | Unclear risk | Unclear risk | Unclear risk | Low risk | Low risk | Unclear risk |
| Vulevic 2008 | Low risk | Low risk | Low risk | Low risk | Low risk | Low risk | Low risk |
| Ouwehand 2009 | High risk | Low risk | High risk | High risk | Low risk | Low risk | Unclear risk |
| Macfarlane 2013 | Low risk | Low risk | Low risk | Low risk | Low risk | Low risk | Low risk |
| Scheid 2014 | Unclear risk | Unclear risk | Low risk | Low risk | Low risk | Low risk | Unclear risk |
| Valentini 2015 | Low risk | Low risk | High risk | High risk | Low risk | Low risk | Low risk |
| Vulevic 2015 | Low risk | Low risk | Low risk | Low risk | Low risk | Low risk | Unclear risk |
| Spaiser 2015 | Low risk | Low risk | Low risk | Low risk | Low risk | Unclear risk | Low risk |
| Costabile 2017 | Low risk | Low risk | Low risk | Low risk | Low risk | Low risk | Unclear risk |
Meta-analysis
When compared with placebo, microbiota-driven therapy did not decrease the levels of TNF-α (SMD, -0.24; 95% CI, -0.69 to 0.21; p = 0.30), IL-6 (SMD, -0.13; 95% CI, -0.74 to 0.49; p = 0.69) and IL-10 (SMD, 1.00; 95% CI, -0.15 to 2.15; p = 0.09) (Figs 3–5). There were significant heterogeneities among the studies regarding the outcomes of TNF-α, IL-6 and IL-10 (I2 = 82.7%, I2 = 90.7%, I2 = 96.3%), which were not obviously associated with the period of microbiota-driven therapy (P = 0.28, P = 0.16, P = 0.28, respectively, Fig 6).
Fig 3. Forest plot for TNF-α, microbiota-driven therapy vs. placebo.

TNF-α, tumor necrosis factor α; SMD, standard mean difference; CI, confidence interval. In the forest plot, solid vertical line represents for ineffective line, and the dashed red line represents for standard mean difference between microbiota-driven group and placebo group.
Fig 5. Forest plot for IL-10, microbiota-driven therapy vs. placebo.

IL-10, interleukin-10; SMD, standard mean difference; CI, confidence interval. In the forest plot, solid vertical line represents for ineffective line, and the dashed red line represents for standard mean difference between microbiota-driven group and placebo group.
Fig 6. Meta-regression plot.
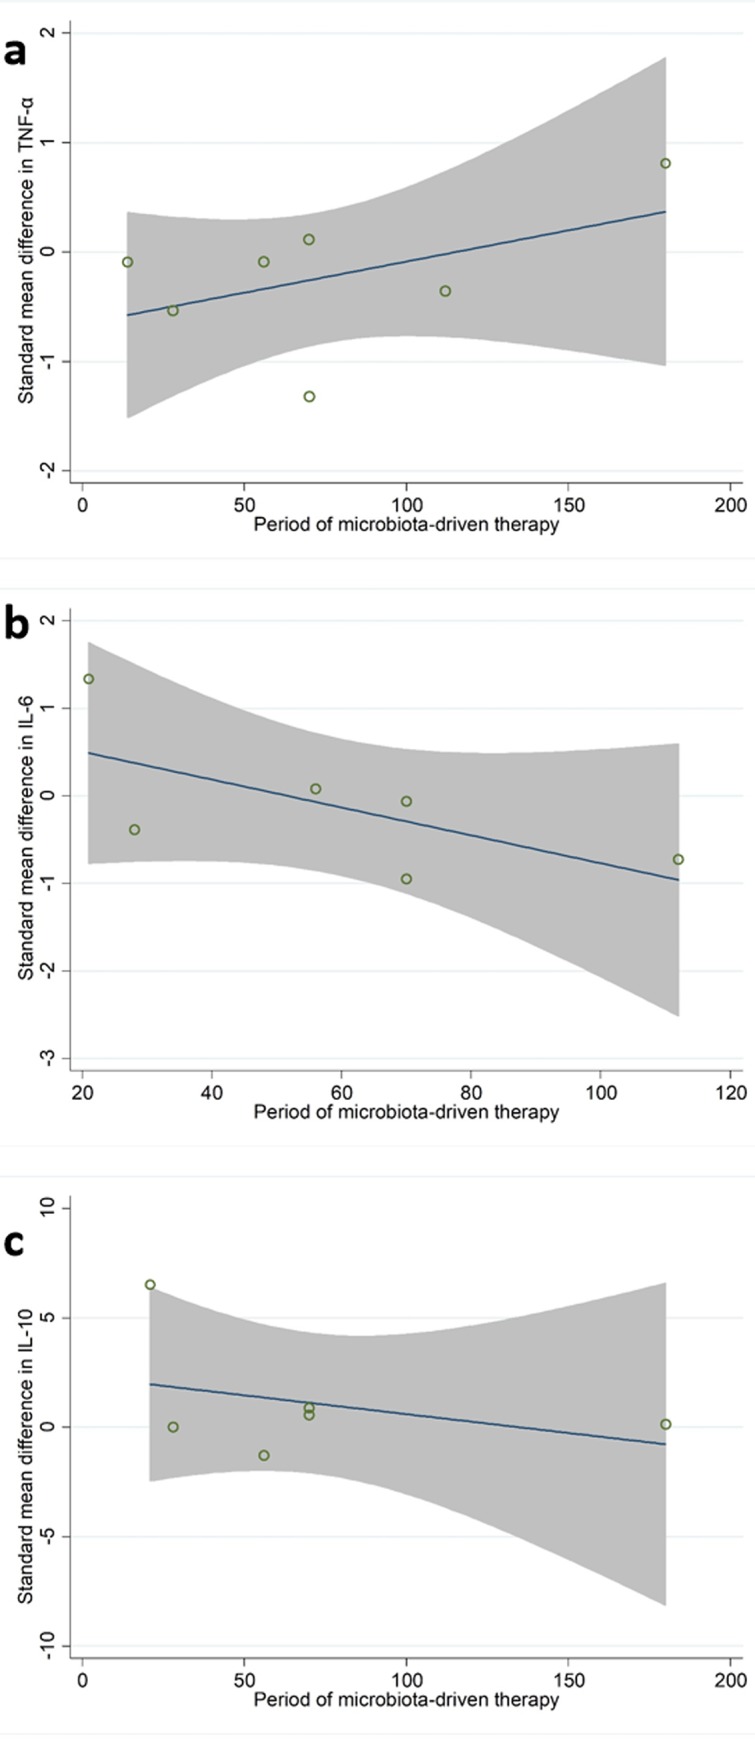
a, standard mean difference in TNF-α according to period of microbiota-driven therapy (P = 0.28); b, standard mean difference in IL-6 according to period of microbiota-driven therapy (P = 0.16); c, standard mean difference in IL-10 according to period of microbiota-driven therapy (P = 0.28). TNF-α, tumor necrosis factor α; IL-6, interleukin-6; IL-10, interleukin-10.
Fig 4. Forest plot for IL-6, microbiota-driven therapy vs. placebo.

IL-6, interleukin-6; SMD, standard mean difference; CI, confidence interval. In the forest plot, solid vertical line represents for ineffective line, and the dashed red line represents for standard mean difference between microbiota-driven group and placebo group.
The effects of microbiota-driven therapy on other inflammatory markers, such as CRP, IL-1β, IL-8 and MCP-1 were also evaluated. Compared with placebo, microbiota-driven therapy did not decrease the levels of CRP (SMD, -1.28; 95% CI, -2.62 to 0.06; p = 0.06; I2 = 96.2%), IL-1β (SMD, -0.22; 95% CI, -0.81 to 0.37; p = 0.46; I2 = 73.8%), IL-8 (SMD, -0.03; 95% CI, -0.67 to 0.61; p = 0.93; I2 = 88.0%) and MCP-1 (SMD, -0.11; 95% CI, -0.41 to 0.20; p = 0.49; I2 = 0%). (Figs 7–10)
Fig 7. Forest plot for CRP, microbiota-driven therapy vs. placebo.

CRP, C reactive protein; SMD, standard mean difference; CI, confidence interval. In the forest plot, solid vertical line represents for ineffective line, and the dashed red line represents for standard mean difference between microbiota-driven group and placebo group.
Fig 10. Forest plot for MCP-1, microbiota-driven therapy vs. placebo.

MCP-1, monocyte chemoattractant protein-1; SMD, standard mean difference; CI, confidence interval. In the forest plot, solid vertical line represents for ineffective line, and the dashed red line represents for standard mean difference between microbiota-driven group and placebo group.
Fig 8. Forest plot for IL-8, microbiota-driven therapy vs. placebo.

IL-8, interleukin-8; SMD, standard mean difference; CI, confidence interval. In the forest plot, solid vertical line represents for ineffective line, and the dashed red line represents for standard mean difference between microbiota-driven group and placebo group.
Fig 9. Forest plot for IL-1β, microbiota-driven therapy vs. placebo.

IL-1β, interleukin-1β; SMD, standard mean difference; CI, confidence interval. In the forest plot, solid vertical line represents for ineffective line, and the dashed red line represents for standard mean difference between microbiota-driven group and placebo group.
Sensitivity analysis
To assure the reliability of the present meta-analysis, we performed sensitivity analysis to evaluate the robustness of the pooled results by eliminating each study at one time sequentially, indicating that the heterogeneity among the studies did not change significantly for the effect of microbiota-driven therapy on TNF-α, IL-6, and IL-10 (S3–S5 Tables).
Publication bias
There was no significant publication bias identified in the analysis for the effect of microbiota-driven therapy on TNF-α, IL-6 and IL-10 using regression for funnel plot asymmetry (Egger’s test P = 0.37, P = 0.26, P = 0.20, respectively). The funnel plots created for the visual analysis of publication bias are presented in Fig 11.
Fig 11. Publication bias.

a, funnel plot for TNF-α; b, funnel plot for IL-6; c, funnel plot for IL-10; d, egger test for TNF-α(P = 0.37); e, egger test for IL-6(,P = 0.26); f, egger test for IL-10 (P = 0.20). TNF-α, tumor necrosis factor α; IL-6, interleukin-6; IL-10, interleukin-10; SMD, standard mean difference.
Discussion
To our knowledge, the present systematic review is the first to assess the effect of microbiota-driven therapy on inflammatory markers in elderly individuals and to provide a thorough synthesis of results from RCTs. After the treatment, no differences were observed between microbiota-driven therapy group and placebo group in the levels of TNF- α, CRP, IL-1 β, IL-6, IL-8, IL-10 and MCP-1.
Inflammatory markers (Il-1β, TNF-α, IL-6 and CRP) are continuously upregulated during the aging process[29], which were associated with reductions of muscle mass and sex hormones[30–32]. Accumulating evidence indicates that the low-grade chronic inflammatory state contributes to many age-related degenerative diseases that were previously not considered inflammatory disorders, including atherosclerosis[33–35], obesity[33,36], Alzheimer’s disease and Parkinson’s disease[34,37–40]. Recently, many studies have suggested the potential effect of microbiota-driven therapy on improving low-grade inflammatory states in some chronic diseases, such as type 2 diabetes[41–43] obesity[44,45] and inflammatory bowel disease (IBD)[46,47]. In addition, some studies also showed a benefit of microbiota-driven therapy in elderly individuals from the perspective of inflammation[12,13]. However, in most instances, the studies focusing on the effects of microbiota-driven therapy on inflammatory markers in elderly individuals had methodological limitations (mainly owing to small numbers of patients included), leaving effects of the therapy unproven.
In the present analysis, we provided the most reliable evidence to date, including 689 individuals from randomized trials to assess the specific effects of microbiota-driven therapy on inflammatory markers in elderly individuals. Contrary to findings from several smaller studies, we observed no significant effect of microbiota-driven therapy on inflammatory markers in elderly individuals. Notably, the effect sizes in the present study were independent of the period of microbiota-driven therapy. The sensitivity analyses of the present systematic review confirmed that the effect size was robust and was representative of all included studies. Therefore, this meta-analysis suggested that microbiota-driven therapy for decreasing the low-grade inflammation response in elderly individuals is not an effective option. However, we did not perform subgroup analysis based on the type of microbiota-driven therapy because of the limited number of included studies. Thus, it is necessary to perform an analysis to compare the differences in decreasing inflammatory markers among prebiotic, probiotic and symbiotic when there are enough available studies. In addition, the dosage of microbiota-driven therapy could also influence the present results, the meta-regression based on dosage of microbiota-driven therapy is also needed in the future. Several limitations should be illustrated in the present meta-analysis. First, the included studies were heterogeneous because of population characteristics and the period of microbiota-driven therapy. However, meta-regression and sensitivity analyses were performed to assure the reliability of the present meta-analysis. Second, there were a limited number of eligible RCTs, and most of them included relatively small populations; thus, the impact of the variables (e.g., sex, region, etc.) on the outcomes could not be evaluated. The analyses based on these variables should be performed when there are enough data in the future.
Conclusion
This meta-analysis of available RCTs does not suggest any significant benefit of microbiota-driven therapy in improving the low-grade chronic inflammatory state of elderly individuals.
Supporting information
(DOCX)
(DOCX)
(DOCX)
(DOCX)
(DOCX)
Acknowledgments
We would like to thank all the authors of the studies included in our meta-analysis.
Data Availability
The data underlying the results presented in the study are available from https://osf.io/f3xsj/quickfiles.
Funding Statement
Da-zhuo Shi received National Natural Science Foundation of China (no. 81030063), http://www.nsfc.gov.cn/; and Zhu-ye Gao received project of China Academy of Chinese Medical Sciences (no. ZZ11-066), http://www.catcm.ac.cn. Da-zhuo Shi and Zhu-ye Gao designed the review and provided methodological perspectives of the meta-analysis.
References
- 1.Bruunsgaard H, Andersen-Ranberg K, Jeune B, Pedersen AN, Skinhøj P, Pedersen BK. A high plasma concentration of TNF-alpha is associated with dementia in centenarians. J Gerontol A Biol Sci Med Sci. 1999;54: M357–64. Available: http://www.ncbi.nlm.nih.gov/pubmed/10462168 [DOI] [PubMed] [Google Scholar]
- 2.Bruunsgaard H. The clinical impact of systemic low-level inflammation in elderly populations. With special reference to cardiovascular disease, dementia and mortality. Dan Med Bull. 2006;53: 285–309. Available: http://www.ncbi.nlm.nih.gov/pubmed/17092450 [PubMed] [Google Scholar]
- 3.de Gonzalo-Calvo D, de Luxán-Delgado B, Rodríguez-González S, García-Macia M, Suárez FM, Solano JJ, et al. Interleukin 6, soluble tumor necrosis factor receptor I and red blood cell distribution width as biological markers of functional dependence in an elderly population: A translational approach. Cytokine. 2012;58: 193–198. 10.1016/j.cyto.2012.01.005 [DOI] [PubMed] [Google Scholar]
- 4.Leng SX, Xue Q-L, Tian J, Walston JD, Fried LP. Inflammation and Frailty in Older Women. J Am Geriatr Soc. 2007;55: 864–871. 10.1111/j.1532-5415.2007.01186.x [DOI] [PubMed] [Google Scholar]
- 5.Giovannini S, Onder G, Liperoti R, Russo A, Carter C, Capoluongo E, et al. Interleukin-6, C-Reactive Protein, and Tumor Necrosis Factor-Alpha as Predictors of Mortality in Frail, Community-Living Elderly Individuals. J Am Geriatr Soc. 2011;59: 1679–1685. 10.1111/j.1532-5415.2011.03570.x [DOI] [PMC free article] [PubMed] [Google Scholar]
- 6.de Gonzalo-Calvo D, de Luxán-Delgado B, Martínez-Camblor P, Rodríguez-González S, García-Macia M, Suárez FM, et al. Chronic inflammation as predictor of 1-year hospitalization and mortality in elderly population. Eur J Clin Invest. 2012;42: 1037–1046. 10.1111/j.1365-2362.2012.02689.x [DOI] [PubMed] [Google Scholar]
- 7.Yende S, Tuomanen EI, Wunderink R, Kanaya A, Newman AB, Harris T, et al. Preinfection Systemic Inflammatory Markers and Risk of Hospitalization Due to Pneumonia. Am J Respir Crit Care Med. 2005;172: 1440–1446. 10.1164/rccm.200506-888OC [DOI] [PMC free article] [PubMed] [Google Scholar]
- 8.Yende S, Alvarez K, Loehr L, Folsom AR, Newman AB, Weissfeld LA, et al. Epidemiology and Long-term Clinical and Biologic Risk Factors for Pneumonia in Community-Dwelling Older Americans. Chest. 2013;144: 1008–1017. 10.1378/chest.12-2818 [DOI] [PMC free article] [PubMed] [Google Scholar]
- 9.Antunes G, Evans SA, Lordan JL, Frew AJ. Systemic cytokine levels in community-acquired pneumonia and their association with disease severity. Eur Respir J. 2002;20: 990–995. 10.1183/09031936.02.00295102 [DOI] [PubMed] [Google Scholar]
- 10.Reade MC, Yende S, DʼAngelo G, Kong L, Kellum JA, Barnato AE, et al. Differences in immune response may explain lower survival among older men with pneumonia*. Crit Care Med. 2009;37: 1655–1662. 10.1097/CCM.0b013e31819da853 [DOI] [PMC free article] [PubMed] [Google Scholar]
- 11.de Vrese M, Schrezenmeir J. Probiotics, prebiotics, and synbiotics. Adv Biochem Eng Biotechnol. 2008;111: 1–66. 10.1007/10_2008_097 [DOI] [PubMed] [Google Scholar]
- 12.Vulevic J, Drakoularakou A, Yaqoob P, Tzortzis G, Gibson GR. Modulation of the fecal microflora profile and immune function by a novel trans-galactooligosaccharide mixture (B-GOS) in healthy elderly volunteers. Am J Clin Nutr. United States; 2008;88: 1438–1446. 10.3945/ajcn.2008.26242 [DOI] [PubMed] [Google Scholar]
- 13.Macfarlane S, Cleary S, Bahrami B, Reynolds N, Macfarlane GT. Synbiotic consumption changes the metabolism and composition of the gut microbiota in older people and modifies inflammatory processes: A randomised, double-blind, placebo-controlled crossover study. Aliment Pharmacol Ther. 2013;38: 804–816. 10.1111/apt.12453 [DOI] [PubMed] [Google Scholar]
- 14.Ouwehand AC, Bergsma N, Parhiala R, Lahtinen S, Gueimonde M, Finne-Soveri H, et al. Bifidobacterium microbiota and parameters of immune function in elderly subjects. FEMS Immunol Med Microbiol. 2008;53: 18–25. 10.1111/j.1574-695X.2008.00392.x [DOI] [PubMed] [Google Scholar]
- 15.Vulevic J, Juric A, Walton GE, Claus SP, Tzortzis G, Toward RE, et al. Influence of galacto-oligosaccharide mixture (B-GOS) on gut microbiota, immune parameters and metabonomics in elderly persons. Br J Nutr. England; 2015;114: 586–595. 10.1017/S0007114515001889 [DOI] [PubMed] [Google Scholar]
- 16.Moher D, Liberati A, Tetzlaff J, Altman DG. Preferred Reporting Items for Systematic Reviews and Meta-Analyses: The PRISMA Statement. PLoS Med. 2009;6: e1000097 10.1371/journal.pmed.1000097 [DOI] [PMC free article] [PubMed] [Google Scholar]
- 17.Higgins JPT, Altman DG, Gøtzsche PC, Jüni P, Moher D, Oxman AD, et al. The Cochrane Collaboration’s tool for assessing risk of bias in randomised trials. BMJ. 2011;343 10.1136/bmj.d5928 [DOI] [PMC free article] [PubMed] [Google Scholar]
- 18.Higgins JPT, Thompson SG. Quantifying heterogeneity in a meta-analysis. Stat Med. 2002;21: 1539–58. 10.1002/sim.1186 [DOI] [PubMed] [Google Scholar]
- 19.Zintzaras E, Ioannidis JPA. Heterogeneity testing in meta-analysis of genome searches. Genet Epidemiol. 2005;28: 123–37. 10.1002/gepi.20048 [DOI] [PubMed] [Google Scholar]
- 20.Higgins JPT. Measuring inconsistency in meta-analyses. BMJ. 2003;327: 557–560. 10.1136/bmj.327.7414.557 [DOI] [PMC free article] [PubMed] [Google Scholar]
- 21.Ioannidis JPA, Patsopoulos NA, Rothstein HR. Reasons or excuses for avoiding meta-analysis in forest plots. BMJ. 2008;336: 1413–5. 10.1136/bmj.a117 [DOI] [PMC free article] [PubMed] [Google Scholar]
- 22.Peters JL, Sutton AJ, Jones DR, Abrams KR, Rushton L. Comparison of two methods to detect publication bias in meta-analysis. JAMA. 2006;295: 676–80. 10.1001/jama.295.6.676 [DOI] [PubMed] [Google Scholar]
- 23.Park HJ, Lee YJ, Ryu HK, Kim MH, Chung HW, Kim WY. A randomized double-blind, placebo-controlled study to establish the effects of spirulina in elderly Koreans. Ann Nutr Metab. 2008;52: 322–328. 10.1159/000151486 [DOI] [PubMed] [Google Scholar]
- 24.Costabile A, Bergillos-Meca T, Rasinkangas P, Korpela K, de Vs WM, Gibson GR. Effects of soluble corn fiber alone or in synbiotic combination with Lactobacillus rhamnosus GG and the pilus-deficient derivative GG-PB12 on fecal microbiota, metabolism, and markers of immune function: A randomized, double-blind, placebo-controlled, cro. Front Immunol. 2017;8: 1–13. 10.3389/fimmu.2017.00001 [DOI] [PMC free article] [PubMed] [Google Scholar]
- 25.Scheid MMA, Genaro PS, Moreno YMF, Pastore GM. Freeze-dried powdered yacon: effects of FOS on serum glucose, lipids and intestinal transit in the elderly. Eur J Nutr. Germany; 2014;53: 1457–1464. 10.1007/s00394-013-0648-x [DOI] [PubMed] [Google Scholar]
- 26.Valentini L, Pinto A, Bourdel-Marchasson I, Ostan R, Brigidi P, Turroni S, et al. Impact of personalized diet and probiotic supplementation on inflammation, nutritional parameters and intestinal microbiota—The “RISTOMED project”: Randomized controlled trial in healthy older people. Clin Nutr. England; 2015;34: 593–602. 10.1016/j.clnu.2014.09.023 [DOI] [PubMed] [Google Scholar]
- 27.Ouwehand AC, Tiihonen K, Saarinen M, Putaala H, Rautonen N. Influence of a combination of Lactobacillus acidophilus NCFM and lactitol on healthy elderly: intestinal and immune parameters. Br J Nutr. England; 2009;101: 367–375. 10.1017/S0007114508003097 [DOI] [PubMed] [Google Scholar]
- 28.Spaiser SJ, Culpepper T, Nieves CJ, Ukhanova M, Mai V, Percival SS, et al. Lactobacillus gasseri KS-13, Bifidobacterium bifidum G9-1, and Bifidobacterium longum MM-2 Ingestion Induces a Less Inflammatory Cytokine Profile and a Potentially Beneficial Shift in Gut Microbiota in Older Adults: A Randomized, Double-Blind, Placebo-Con. J Am Coll Nutr. United States; 2015;34: 459–469. 10.1080/07315724.2014.983249 [DOI] [PubMed] [Google Scholar]
- 29.Roubenoff R, Harris TB, Abad LW, Wilson PW, Dallal GE, Dinarello CA. Monocyte cytokine production in an elderly population: effect of age and inflammation. J Gerontol A Biol Sci Med Sci. 1998;53: M20–6. Available: http://www.ncbi.nlm.nih.gov/pubmed/9467429 [DOI] [PubMed] [Google Scholar]
- 30.Chung HY, Cesari M, Anton S, Marzetti E, Giovannini S, Seo AY, et al. Molecular inflammation: Underpinnings of aging and age-related diseases. Ageing Res Rev. 2009;8: 18–30. 10.1016/j.arr.2008.07.002 [DOI] [PMC free article] [PubMed] [Google Scholar]
- 31.Trayhurn P, Wood IS. Signalling role of adipose tissue: adipokines and inflammation in obesity. Biochem Soc Trans. 2005;33: 1078 10.1042/BST20051078 [DOI] [PubMed] [Google Scholar]
- 32.Visser M, Pahor M, Taaffe DR, Goodpaster BH, Simonsick EM, Newman AB, et al. Relationship of interleukin-6 and tumor necrosis factor-alpha with muscle mass and muscle strength in elderly men and women: the Health ABC Study. J Gerontol A Biol Sci Med Sci. 2002;57: M326–32. Available: http://www.ncbi.nlm.nih.gov/pubmed/11983728 [DOI] [PubMed] [Google Scholar]
- 33.Mathieu P, Lemieux I, Després J-P. Obesity, inflammation, and cardiovascular risk. Clin Pharmacol Ther. 2010;87: 407–16. 10.1038/clpt.2009.311 [DOI] [PubMed] [Google Scholar]
- 34.Lathe R, Sapronova A, Kotelevtsev Y. Atherosclerosis and Alzheimer—diseases with a common cause? Inflammation, oxysterols, vasculature. BMC Geriatr. 2014;14: 36 10.1186/1471-2318-14-36 [DOI] [PMC free article] [PubMed] [Google Scholar]
- 35.Stoll G, Bendszus M. Inflammation and atherosclerosis: novel insights into plaque formation and destabilization. Stroke. 2006;37: 1923–32. 10.1161/01.STR.0000226901.34927.10 [DOI] [PubMed] [Google Scholar]
- 36.Mangge H, Almer G, Truschnig-Wilders M, Schmidt A, Gasser R, Fuchs D. Inflammation, adiponectin, obesity and cardiovascular risk. Curr Med Chem. 2010;17: 4511–20. Available: http://www.ncbi.nlm.nih.gov/pubmed/21062254 [DOI] [PubMed] [Google Scholar]
- 37.McGeer PL, McGeer EG. Inflammation and the degenerative diseases of aging. Ann N Y Acad Sci. 2004;1035: 104–16. 10.1196/annals.1332.007 [DOI] [PubMed] [Google Scholar]
- 38.Cameron B, Landreth GE. Inflammation, microglia, and Alzheimer’s disease. Neurobiol Dis. 2010;37: 503–9. 10.1016/j.nbd.2009.10.006 [DOI] [PMC free article] [PubMed] [Google Scholar]
- 39.McGeer PL, McGeer EG. Inflammation and neurodegeneration in Parkinson’s disease. Parkinsonism Relat Disord. 2004;10 Suppl 1: S3–7. 10.1016/j.parkreldis.2004.01.005 [DOI] [PubMed] [Google Scholar]
- 40.Whitton PS. Inflammation as a causative factor in the aetiology of Parkinson’s disease. Br J Pharmacol. 2007;150: 963–76. 10.1038/sj.bjp.0707167 [DOI] [PMC free article] [PubMed] [Google Scholar]
- 41.Aliasgharzadeh A, Dehghan P, Gargari BP, Asghari-Jafarabadi M. Resistant dextrin, as a prebiotic, improves insulin resistance and inflammation in women with type 2 diabetes: a randomised controlled clinical trial. Br J Nutr. England; 2015;113: 321–330. 10.1017/S0007114514003675 [DOI] [PubMed] [Google Scholar]
- 42.Burton KJ, Pimentel G, Rosikiewicz M, Butikofer U, Ah U, Voirol MJ, et al. Two-week intake of dairy probiotic or prebiotic suppresses the postprandial inflammatory response associated with a high-fat meal [Internet]. Diabetes. Conference: 76th scientific sessions of the american diabetes association, ADA 2016. United states. 2016. p. A197. 10.2337/db16-652-860 [DOI]
- 43.Kobyliak N, Falalyeyeva T, Mykhalchyshyn G, Kyriienko D, Komissarenko I. Effect of alive probiotic on insulin resistance in type 2 diabetes patients: randomized clinical trial [Internet]. Diabetes and metabolic syndrome: clinical research and reviews. 2018. 10.1016/j.dsx.2018.04.015 [DOI] [PubMed] [Google Scholar]
- 44.Parnell JA, Klancic T, Reimer RA. Oligofructose decreases serum lipopolysaccharide and plasminogen activator inhibitor-1 in adults with overweight/obesity. Obesity (Silver Spring). United States; 2017;25: 510–513. 10.1002/oby.21763 [DOI] [PubMed] [Google Scholar]
- 45.Nicolucci AC, Hume MP, Reimer RA. Effect of prebiotic fiber intake on adiposity and inflammation in overweight and obese children: assessing the role of the gut microbiota [Internet]. Canadian journal of diabetes. 2015. p. S43 Available: http://cochranelibrary-wiley.com/o/cochrane/clcentral/articles/849/CN-01129849/frame.html [Google Scholar]
- 46.Keshteli A, Valcheva R, Nickurak C, Halloran B, Zanten S, Kroeker K, et al. A randomized controlled trial using a personalized (Alberta anti-inflammatory diet) for prevention of relapse in ulcerative colitis [Internet]. Canadian journal of gastroenterology and hepatology. 2016. 10.1155/2016/4792898 [DOI] [Google Scholar]
- 47.Furrie E, Macfarlane S, Kennedy A, Cummings JH, Walsh S V, O’neil DA, et al. Synbiotic therapy (Bifidobacterium longum/Synergy 1) initiates resolution of inflammation in patients with active ulcerative colitis: a randomised controlled pilot trial. Gut. England; 2005;54: 242–249. 10.1136/gut.2004.044834 [DOI] [PMC free article] [PubMed] [Google Scholar]
Associated Data
This section collects any data citations, data availability statements, or supplementary materials included in this article.
Supplementary Materials
(DOCX)
(DOCX)
(DOCX)
(DOCX)
(DOCX)
Data Availability Statement
The data underlying the results presented in the study are available from https://osf.io/f3xsj/quickfiles.