

Abstract
Background:
Pathogenic RYR2 variants account for ~60% of clinically definite cases of catecholaminergic polymorphic ventricular tachycardia (CPVT). However, the rate of rare benign RYR2 variants identified in the general population remains a challenge for genetic test interpretation. Therefore, we examined the results of the RYR2 genetic test among patients referred for commercial genetic testing and examined factors impacting variant interpretability.
Methods and Results:
Frequency and location comparisons were made forRYR2 variants identified among 1355 total patients of varying clinical certainty and 60,706 ExAC controls. The impact of the clinical phenotype on the yield of RYR2 variants was examined. Six in silico tools were assessed using patient- and control-derived variants. A total of 18.2% (218/1200) of patients referred for commercial testing hosted rare RYR2variants, statistically lower than the 59% (46/78) yield among clinically definite cases, resulting in a much higher potential genetic false discovery rate among referrals considering the 3.2% background rate of rare, benign RYR2 variants. Exclusion of clearly putative pathogenic variants further complicates the interpretation of the next “novel” RYR2 variant. Exonic/topologic analyses revealed overrepresentation of patient variants in exons covering only one-third of the protein. In silico tools largely failed to show evidence towards enhancement of variant interpretation.
Conclusions:
Current expert recommendations have resulted in increased use of RYR2 genetic testing in patients with questionable clinical phenotypes. Using the largest to-date CPVT patient vs. control comparison, this study highlights important variables in the interpretation of variants in order to overcome the 3.2% background rate that confounds RYR2 variant interpretation.
Keywords: genetic testing, catecholaminergic polymorphic ventricular tachycardia, polymorphism, ryanodine receptor, RYR2 gene, in silico testing, Arrhythmias, Sudden Cardiac Death, Genetics
Introduction
Catecholaminergic polymorphic ventricular tachycardia (CPVT) is an inherited arrhythmia condition estimated to affect 1 in 10,000 individuals.1 Classically, CPVT manifests as exercise- or emotional stress-induced bidirectional or polymorphic ventricular tachycardia leading to syncope, seizures, or sudden cardiac death (SCD) in the setting of a structurally normal heart.2 With reported mortality rates as high as 30–50% by age 35 years, early identification of those at risk for this potentially lethal disorder is critical.3
Pathogenic variants in the cardiac ryanodine receptor gene (RYR2) are responsible for approximately 60% of clinically definite CPVT.4 While the discovery of CPVT mutation hotspots originally led to targeted genetic screening,5 recent advances in sequencing technology have now enabled cost-effective screening of RYR2’s 105 total coding exons. The RYR2 genetic test for CPVT is considered to be one of the most robust cardiac genetic tests6, resulting in guidelines recommending genetic testing for any patient in whom a cardiologist clinically suspects CPVT along with subsequent cascade screening in family members.7 While early genetic testing considered variants absent in 50–400 controls sufficient to suggest pathogenicity,8 it has become increasingly recognized that benign rare variants occur more often than previously anticipated. For RYR2 screening, approximately 3% of ostensibly healthy individuals carry a rare protein-altering variant.4 This genetic “noise” introduces uncertainty in positive test results. Consequently, RYR2 genetic testing may be hampered by interpretive ambiguity, leaving the caring physician with the dilemma of how to manage a family whose genetic test result is returned with the finding of a “variant of uncertain/unknown significance (VUS)”.8,9Therefore, there is a critical need for clarification of domain-related pathogenicity and RYR2 variant interpretation algorithms in an effort to distinguish true pathogenic CPVT-causing variants from rare variants of inconsequential clinical significance.7
Previous attempts at enhancing variant interpretation using protein topology-driven estimated predictive values (EPV) concomitantly with in silico phenotype prediction algorithms have been successful in the major long QT syndrome (LQTS) genes (KCNQ1, KCNH2, and SCN5A).10–12 In an effort to improve the diagnostic interpretation of rare RYR2 variants, the goal of this study was to evaluate the results of the RYR2 genetic test among patients referred for commercial genetic testing and potential impacts on interpretability.
Methods
The data, analytic methods, and study materials will be made available to other researchers upon request for purposes of reproducing the results or replicating the procedure.
Samples
A total of 1200 unrelated and suspected-CPVT patients were referred for the FAMILION® CPVT clinical genetic test (“referrals”) between November 2009 and November 2014. Samples were accepted for genetic testing and included in this retrospective analysis regardless of the level of clinical suspicion or the motivating factor for submission by the caring physician. This retrospective, institutional review board–approved analysis is derived from de-identified data. The only available clinical variables were sex, ethnicity, and age at genetic testing.
Additionally, 155 well-phenotyped cases were evaluated/assessed by either AAW or MJA and included 78 cases classified as “strong CPVT” and 77 cases classified as “possible CPVT”. The “strong” cases were defined as those with a history of exertional syncope with documentation of exercise-related bidirectional or polymorphic ventricular tachycardia. The “possible” cases were defined based on a history of exertional syncope and stress test induced ventricular ectopy or exercise-induced cardiac events and a QTc ≤ 480 ms (further details can be found in the Supplemental Material). For comparison, the spectrum and prevalence of rare RYR2 variants identified in the on-line database of next-generation sequencing results from the Exome Aggregation Consortium (ExAC, n=60,706, http://exac.broadinstitute.org) were assessed. Demographic information for the cohorts is detailed in Table 1. The Sanger-sequenced control cohort consisted of 627 additional, unrelated, ostensibly healthy subjects.
Table 1:
Case or Control Cohort Demographics
| Total | Average Age (years) | % Female | % Caucasian | |
|---|---|---|---|---|
| Referrals | 1200 | 31 ± 19 | 46 | 78 |
| Strong | 78 | 20 ± 15 | 47 | 96 |
| Possible | 77 | 21 ± 15 | 52 | |
| ExAC | 60706 | NA | NA | 61 |
For the purpose of this study, all variants predicted to alter the protein (missense canonical splice site, in-frame and frame-shift insertion or deletion, and nonsense) were identified and considered for analysis. Given the low prevalence of CPVT, only those variants with an ExAC minor allele frequency (MAF) less than 0.01% (1 in 10,000 alleles) were denoted “rare” and declared eligible as a positive test result in the analyses performed within this study. Supplemental Table 1 shows the breakdown of the genotyping method and the exons covered for each of the patient and control cohorts.
In silico Phenotype Prediction Analyses
In order to assess in silico predictive tools, we utilized six in silico tools [CADD, Grantham, MutationAssessor (MAss), Phylogenetic analysis, PolyPhen2, and SIFT]. The predictions from each tool were assessed individually. Details on the methods used for the in silico tools are further described in the Supplementary Materials.
Statistical Analysis
Statistical analyses were performed using Fisher’s Exact Test or a Student’s t-test when appropriate, with a threshold of significance set at p<0.05, unless otherwise specified. Statistical summaries were displayed as mean ± standard deviation unless otherwise specified. For the purposes of this study, we define the term “yield” to be equivalent to the screen positive rate of tested subjects in a given cohort (i.e., the proportion carrying at least one of a subset of variants under consideration to be putatively pathogenic). We then define the “background rate” of the genetic test to be the yield of the ExAC cohort. To estimate the likelihood of disease pathogenicity for a specific set of variants, we applied a modification of the positive predictive value (PPV), which is the conditional probability of a true genetic diagnosis given a positive test result. Assuming that the prevalence of benign variation is the same for patient and control populations and that all variants found in controls are benign (a reasonable assumption considering the low occurrence, 1 in 10,000 people, of CPVT, and high penetrance of CPVT variants)6, the difference in yields between patients and controls is approximately equivalent to the yield of truly pathogenic variants among patients. We calculated the estimated predictive value (EPV) as (case yield – control yield)/case yield. We also calculated the 95% confidence intervals for these probabilities, using the formula CI = 1–1/(e^{ln (RR)±z*[SE(log RR)]}), where RR represents the relative ratio of the yield in cases over the yield in controls.11 The corresponding false discovery rate (FDR), equivalent to 1 - PPV, is the probability of a false positive genetic diagnosis given a positive screening result and calculated herein as 1 – EPV.
Exon Burden Test
A Fisher’s exact test was conducted to compare the yield per exon between ExAC controls and either CPVT referral patients or the 155 previously published cases. The referral patients vary in exon coverage per the evolving design of the assay (range in sample size: 253 – 1200), resulting in differential power across the exons. To mitigate this bias, we adopted a stratified FDR13 approach to Type I error control whereby FDR within exon strata formed by shared sample size is controlled at level of 0.05 based upon the Benjamini-Hochberg procedure.14 Standard FDR control at the same level was applied for analyses of the phenotyped CPVT case results.
Results
Summary of Cohort Yields
In total, 218/1200 individuals (18.2%) submitted for commercial testing had a rare variant in RYR2. The yield in this referral cohort (18.2%) was significantly lower than the 59.0% (46/78) yield among the phenotypically “strong” CPVT cases (p=1.8×10⁻¹⁴) and the 31.2% (24/77) yield derived from “possible” CPVT cases (p=0.007). However, the yield in the referrals was significantly higher than the 3.2% (1921/60706) yield derived from the ExAC exomes (p=3.2×10−92, Figure 1). A table indicating the impact of varying MAF thresholds on the ExAC yield is shown in Supplemental Table 2. While sex and ethnicity were not associated with yield, the age at genetic testing was significantly different between screen-positive (20 ± 14 years) and screen-negative referral patients (33 ± 19 years, p=7.8×10⁻²⁰). A striking difference in yield between referrals less than 18 years of age, between 18 and 35 years of age, and older than 35 years again highlights the impact of phenotype on RYR2 genetic test interpretation (Figure 2, Supplemental Results).
Figure 1.

Yield by Clinical Phenotype. The yield of rare variants (MAF < 1 in 10,000) among patients with a “strong” CPVT phenotype, “possible” CPVT phenotype, or referred for RYR2 genetic testing. The red dotted line represents the 3.2% background rate of rare variants identified in the ExAC exomes. The EPV is provided within the column for each cohort. The p-values for comparisons, indicated by each bar, are provided above the bar. An “*” indicates p < 1.0×10⁻¹⁵ for the comparison to the ExAC background rate of rare variants.
Figure 2.
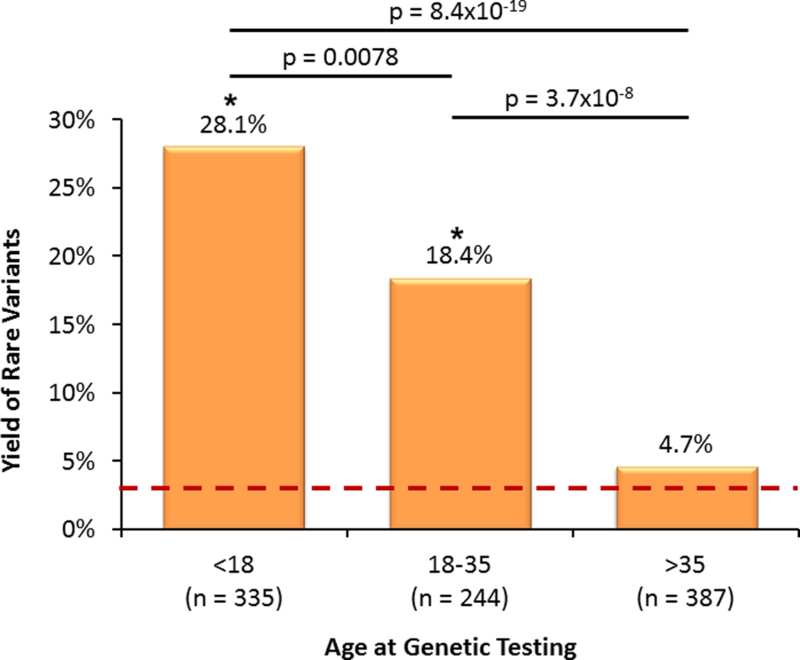
Age at Genetic Testing. The yield of rare variants among the referral cohort (grouped by age). The red dotted line represents the 3.2% background rate of rare variants identified in the ExAC exomes. The p-values for comparisons, indicated by each bar, are provided above the bar. An “*” indicates p < 0.05 for the comparison to the ExAC background rate of rare variants.
To validate the ExAC background rate that was derived by whole exome sequencing, the yield among the ExAC exomes was compared to the yield among 627 Sanger-sequenced controls and was found to be similar, although underpowered to detect small differences (Supplemental Figure 1). Additionally, there were no significant differences in yield between ethnic groups in the ExAC exomes, with yields ranging from 2.6% to 4.2%. Therefore, the overall ExAC yield of 3.2% was used as the frame of reference for all analyses within this study.
Given the overrepresentation of rare variants in cases, the EPV for identified RYR2 rare variants was high for all case cohorts examined; however, the EPV estimate in “strong” cases (95% [94–96]) was significantly higher than the “possible” cases (90% [86–92]). It is possible that certain disease cohorts present in ExAC (e.g., early onset myocardial infarction) may be enriched with unrecognized CPVT cases, leading to an inflated background rate and downwardly-biased EPV estimates. To investigate the potential impact of true CPVT cases present in ExAC, we conducted sensitivity analyses under a spectrum of latent ExAC CPVT case fractions (range: 0.00–1.00%), presented in Supplemental Figure 2. Results remained largely unchanged for realistic case frequencies. Additionally, demographic differences may also contribute to yield. These results indicate overall robustness of our EPV estimates to various violations of assumptions. Given variation in ethnic frequencies of rare variants, all EPVs were calculated using only Caucasian ExAC exomes given the Caucasian predominance of the CPVT cases (Supplemental Table 3).
Longitudinal Patterns of Referral Yield
As the referral group was screened through an expanding number of exons over the development of the test, the yield among the 38 exons screened through all referral patients was examined. The 38 exon yield fell from 25.0% for the first 300 referrals to 9.7% for the last 300 referrals (p=8.7×10⁻⁷, Figure 3). The average age at genetic testing also rose from 27 ± 16 years for the first 300 cases to 34 ± 20 years for the last 300 (p=0.004).
Figure 3.

Rare Variant Yield and Age at Genetic Test over the Life of the Clinically Available RYR2 Genetic Test. Comparing 4 consecutive groups of 300 cases, the bar graph depicts in (A) the yield of rare variants and in (B) the average age at genetic testing. The p-values for comparisons, indicated by each bar, are provided above the bar. The error bars in panel B represent the standard error of the age at genetic testing.
Identification of Near-Definite Pathogenic Variants
A total of 201 rare variants (Supplemental Table 4) were identified among the case and referral groups, the majority of which were identified in a single subject (Figure 4). Meanwhile, 36 variants were identified across multiple cases and absent among the ExAC exomes (Table 2). While these 36 overrepresented variants (ORVs) account for 17.9% of the total rare variants identified, they account for 41.0% (118/288) of the positive genetic tests.
Figure 4.

Occurrence of RYR2 Variants. This bar graph summarizes the distribution of specific rare variants among unrelated cases. The y axis depicts the number of distinct rare RYR2 variants, and the x axis represents the number of unrelated cases.
Table 2:
36 Rare Variants Absent in ExAC and Overrepresented in CPVT
| p.Asn57_Gly91del (2) | p.Cys2201Tyr (2) | p.Gly3946Ser (4) | p.Arg4497Cys (3) |
| p.Arg169Gln (2) | p.Ser2246Leu (9) | p.Met3972Ile (2) | p.Gly4749Val (2) |
| p.Glu243Lys (2) | p.Glu2296Gln (2) | p.Glu4076Lys (2) | p.Gly4749Glu (3) |
| p.Phe329Leu (2) | p.Ala2387Thr (7) | p.Ala4091Thr (2) | p.Asn4763Ser (2) |
| p.Arg332Trp (3) | p.Arg2401His (3) | p.Ala4091Val (2) | p.Val4771Ile (14) |
| p.Gly357Ser (2) | p.Ala2403Thr (2) | p.Ser4124Thr (2) | p.Ile4848Val (2) |
| p.Arg420Gln (7) | p.Ala2416Asp (2) | p.Arg4157Gln (2) | p.Phe4851Leu (2) |
| p.Glu1724Lys (4) | p.Arg2420Trp (2) | p.Asn4178Ser (8) | p.Phe4851Leu (3) |
| p.His2168Gln (2) | p.Cys3800Phe (2) | p.Leu4188Pro (2) | p.Arg4959Gln (6) |
Number of CPVT cases hosting each variant shown in parenthesis.
In an effort to identify the pathogenicity of a “novel” variant inRYR2, these 36 ORVs were removed and the yields were re-calculated. The updated yields were nearly halved for all case cohorts; 35.9% (28/78) for “strong” cases, 16.9% (13/77) for “possible” cases, and 11.2% (134/1200) for the referral group. Despite the reduction in overall yield, the EPV for a rare variant identified among “strong” cases remained high at 91% (89–93). However, for the rare variants identified among cases without a robust clinical phenotype, the EPV estimate was lower than originally calculated (“Possible”: 81% (69–88)). This would suggest that without a strong clinical phenotype, the next “novel” RYR2 variant has approximately a 1 in 5 chance of being a false positive, while with a “strong” phenotype, this false discovery rate would be ~1 in 10. This is summarized in Figure 5. As the ORVs carry an intrinsically high likelihood of pathogenicity by themselves, it is clear improvements in interpretation must be achieved for the next “novel” variant. Therefore, the 36 ORVs were removed from the following analysis unless otherwise indicated.
Figure 5.

Yield of “New” Rare RYR2 Variants by Phenotype. In an effort to identify the yield of “new” rare variants, statistically over-represented variants (ORVs) were removed and the yields were re-calculated for the remaining rare RYR2 variants. The red dotted line represents the 3.2% background rate of rare variants identified in the ExAC exomes. The EPV is provided within the column for each cohort. The p-values for comparisons, indicated by each bar, are provided above the bar. An “*” indicates p < 1.0×10⁻⁶ for the comparison to the ExAC background rate of rare variants.
Regional Analysis of the Yield of Rare Variants
As the RYR2 genetic test has expanded from a targeted test to now interrogating the entire coding region, we assessed the yield of rare variants inside and outside of the previously defined hotspot regions (exons 3–15, 44–50, 83–90, and 93–105).5 The yield in the hotspot regions was respectively 30.8% (24/78), 16.9% (13/77), and 8.8% (105/1200) for the “strong” case, “possible” case, and referral cohorts. Outside of the hotspot regions, the yields were 6.4% (5/78), 0% (0/77), and 2.6% (31/1200), respectively. The hotspot yield of 1.1% (650/60706) among the ExAC controls was significantly lower compared to all case cohorts; however, the 2.1% (1271/60706) ExAC yield outside these regions was only statistically lower than the yield among the “strong” cases.
Additionally, the yield among the cases and the controls in individual exons was compared (Figure 6). Significant yield differences were found in 8 exons (3, 8, 14, 89, 90, 93, 97,100) among the 155 previously published cases and 17 exons (3, 14, 43, 47–49, 81, 83, 88, 90, 95, 98–101, 103, 105) in the referral patients. Combined, 65.7% (88/134) of the referral and 85.4% (35/41) of the phenotyped case variants were found in these 21 unique exons (3, 8, 14, 43, 47–49, 81, 83, 88–90, 93, 95, 97–101, 103, 105). However, only 20.0% (385/1921) of the background genetic noise from the ExAC exomes was identified in these regions. Approximately 58% of exons within the previously defined hotspots were identified in our enrichment analyses, while 2 additional exons were discovered outside these regions. Complete yield results for each exon are shown in Supplemental Table 5.
Figure 6.

Comparison of Yield by Exon. This line chart represents the yield (y-axis) of rare RYR2 variants within each exon (x-axis) of the RYR2 gene. Orange line – yield in referral group, Blue line – yield in the Mayo Clinic/AAMC phenotyped cases (“strong” and “possible” cohorts), Red line – yield in the ExAC exomes. The black bar at the top of the graph the previously identified hotspot regions. Light blue column represent the 21 identified exons.
Using this updated regional analysis, the EPVs were recalculated. In the strong cases, the yield in these 21 identified exons was 30.8% (24/78) whereas outside these exons, the yield was 6.4% (5/78). Given the yields in the ExAC exomes of 0.63% (385/60706) and 2.5% (1536/60706), respectively, the EPV for the next “novel” variant localizing to one of these 21 exons rises to 98% (97–98) and falls to 61% (8–83) when residing within the remaining 84 exons even with a strong phenotype. This polarization of the EPV is seen even with the “possible” CPVT cases (inside these 21 exons: 95% [92–97], outside: 0% [0–74]).
Differentiation of Case-Derived Variants versus Control-Derived Variants Using In Silico Tools
Functional impact predictions from six in silico tools were assessed for their ability to distinguish patient-derived from control-derived rare RYR2variants. Among these tools, only the Grantham values were not significantly associated with variant status and therefore were not considered in subsequent analyses. These results are shown in Table 3. In an effort to further validate the in silico predictions, we examined the predictions for ORVs compared to ExAC variants with a MAF > 0.01% (Supplemental Table 6). While these predictions performed slightly better, they were not statistically different than the overall predictions for case- versus control-derived variants. Additionally, when the referral cohort was assessed individually, the in silico predictions were found to be indistinguishable from the well-phenotyped cohorts (Supplemental Table 7). Therefore, we used the predictions for all case- or control-derived variants for further analyses.
Table 3:
In Silico Pathogenic Predictions
| All 105 Exons | Inside the 21 Case- Enriched Exons |
Outside those Identified Exons (N=84 exons) |
||||
|---|---|---|---|---|---|---|
| Algorithm | Case | Control | Case | Control | Case | Control |
| CADD |
105/153 (68.6%) |
334/1040 (32.1%) |
84/117 (71.8%) |
83/259 (32.0%) |
21/36 (58.3%) |
251/781 (32.1%) |
| Grantham | 39/153 (25.5%) |
215/1040 (20.7%) |
33/117 (28.2%) |
53/259 (20.5%) |
6/36 (16.7%) | 162/781 (20.7%) |
| Mass |
112/153 (73.2%) |
457/1040 (43.9%) |
90/117 (76.9%) |
118/259 (45.6%) |
22/36 (61.1%) |
339/781 (43.4%) |
| Phylogenetic |
86/153 (56.2%) |
275/1040 (26.4%) |
74/117 (63.2%) |
79/259 (30.5%) |
12/36 (33.3%) |
196/781 (25.1%) |
| Polyphen2 |
133/153 (86.9%) |
680/1040 (65.4%) |
105/117 (89.7%) |
179/259 (69.1%) |
28/36 (77.8%) |
501/781 (64.1%) |
| SIFT |
111/153 (72.5%) |
464/1040 (44.6%) |
90/117 (76.9%) |
122/259 (47.1%) |
21/36 (58.3%) |
342/781 (43.8%) |
Number of case-derived or control-derived rare RYR2 variants predicted pathogenic by each in silico algorithm (percentage indicated in parenthesis). The “All Exons” column indicates values for all variants identified throughout RYR2’s 105 translated exons. Bold indicates statistically significant (p<0.05) values comparing case vs. control. All cases variants were combined for this analysis as no difference in predictions were identified between case cohorts (Supplemental Table 7).
Given evidence of localization of case-derived variants to particular exons, we examined whether the in silico algorithms were able to enhance the interpretation within or outside of these 21 identified exons. Five in silico tools demonstrated the ability to distinguish rare case-derived from control-derived variants in the 21 case-enriched exons. Interestingly, only the CADD, MAss, and SIFT algorithms were able to distinguish the variants localizing to the other 84 exons. Despite the ability to statistically distinguish case-derived from control-derived variants, the in silico tools did not provide enhanced interpretation largely due to the high rate of pathogenicity predictions for variants identified in the ExAC exomes. For the strong cases within the identified 21 exons, the EPV rose to 99 (98–99) when the CADD algorithm predicted pathogenic, but was still 95 (90–98) when the CADD algorithm predicted non-pathogenic. Similarly, outside these 21 exons, the EPVs were 79 (37–92) and 57 (0–86) in the strong cases when CADD predicted pathogenic or non-pathogenic, respectively. Sensitivities and specificities for each tool are shown in Supplemental Figure 4.
Discussion
CPVT is often considered the most lethal of the cardiac channelopathies and as such has been shown to be responsible for a portion of SCD.2 Tragically, syncope or SCD is the sentinel event in many CPVT cases and this often occurs in the young.2,15 This high lethality demands the early identification of at-risk individuals. However, in consideration of the normal ECG and echocardiograms, the rarity of the disorder, and the presenting symptom of syncope (a symptom with many etiologies16), the diagnosis of CPVT can be difficult. These mounting challenges towards the diagnosis of CPVT are indicated by a detrimental delay in the diagnosis for this highly lethal disorder.17,18
In 2001, the identification of mutations in RYR2 as a pathogenic cause for CPVT provided physicians with a much needed tool for the diagnosis of at-risk individuals.19,20 Subsequent studies identified ~60% of CPVT cases host a putative pathogenic variant.21 Given the critical role of the cardiac ryanodine receptor in cardiomyocytes, early testing assumed all rare variants in RYR2 would be pathogenic. While early testing defined rarity as absence in 50–400 controls,8 the release of large genetic repositories such as the 1000 Genome Project and the NHLBI Exome Sequencing Project revealed a larger than expected burden of rare, and likely benign, variants in many of the genes associated with cardiac channelopathies. Despite this identification in the other cardiac disease-susceptibility genes, RYR2 continued to be considered largely intolerant to rare benign variation. This idea was supported by RYR2’s high z-score and a pLI of 1 from ExAC, suggesting a low tolerance to change.22 Thus, despite an identified 3% background rate, the HRS/EHRA Expert Consensus Statement recommended genetic testing “for any patient in whom a cardiologist has established a clinical index of suspicion for CPVT”7 and declared that “CPVT is diagnosed in patients (index case or family member) who have a pathogenic mutation.”23 Further highlighting the presumed pathogenicity of rare RYR2 variants, the American College of Medical Genetics and Genomics (ACMG) included RYR2 in their list for recommended reporting of secondary findings regardless of pretest clinical presentation.24
In this setting, this study examined the results among patients referred for commercial RYR2 genetic testing. Given the diagnostic potential for genetic testing, it is expected that the genetic test among referrals may not reach yields identified in irrefutable cases due to varying phenotypic certainty among submitted samples. To this end, previous reports have shown a ~50% reduction in yield for patients referred for LQTS and HCM genetic testing compared to definitive cases.25,26 The yield among referrals for the CPVT genetic test in this study was found to be only 18.2%, representing a 70% reduction from the 60% yield expected among definitive CPVT cases. We additionally found that RYR2 referral yield has decreased over the life of the test, with the latest cases having only a 9.7% yield, and the age at genetic testing correspondingly has increased, which likely represents an increased utilization of the RYR2 genetic test among cases with weaker and weaker phenotypes. The increased use in patients with low pretest probability likely reflects the clinical diagnostic difficulties of CPVT and the perpetuated strength of the RYR2 genetic test, as highlighted in the most recent guidelines. While the 3% background rate was largely inconsequential compared to a 60% yield in robust cases, the increasing use of the test in weak cases makes the 3% background rate become a major issue that must be taken into account.
As incorrect interpretation can lead to overzealous treatment, undue stress, and risk for the patient,8 the correct interpretation is of the utmost importance. While the 60% yield, cited in the literature for the RYR2 test, would suggest a 1:20 false discovery rate when compared against the 3% background rate and would warrant the strong diagnostic interpretation suggested by the consensus statement, it is clear that this yield and its accompanying signal-to-noise characteristics is only achieved when the diagnosis of CPVT clinically is definite. In the cases without CPVT’s hallmark arrhythmias, the yield of the genetic test is nearly halved resulting in a ~1:10 false discovery rate. The yield is further reduced when considering the case yield due to the inclusion of the 36 ORVs. Removal of these ORVs results in a 1:3–5 false discovery rate (20 – 33% chance) for the next “novel” rare variant in a case with only a clinical suspicion of CPVT. This issue of ORVs is likely present in most of the cardiac disease-susceptibility genes as it was shown recently in hypertrophic cardiomyopathy (HCM) that ORVs account for only a small percentage of the variants identified but contribute to nearly 50% of genetically-positive cases.12 Therefore, the 1:3–5 false discovery rate challenges the strong guidelines statement that suggests “CPVT is diagnosed in patients (index case or family member) who have a pathogenic mutation.”23 Given the lacking definition of “pathogenic” and the presumed pathogenicity of rareRYR2 variants, the two consensus statements become in direct contrast as the present study clearly shows that the presence of a rare variant (excepting one of the 36 ORVs) is NOT self-sufficiently diagnostic of CPVT.
In order to improve the false discovery rate, one could limit RYR2 genetic testing to only those patients presenting with the characteristic stress induced bidirectional or polymorphic tachycardia. Unfortunately, this would severely limit the potential diagnostic utility of the test, especially when considering the heterogeneity found in RYR2 variant-positive patients.27,28 Furthermore, RYR2 has been implicated in atrial fibrillation, arrhythmogenic right ventricular dysplasia/cardiomyopathy, and idiopathic ventricular fibrillation suggesting that RYR2 genetic testing could be utilized across a broader clinical phenotype than classical CPVT. However, the interpretability in these disorders is nearly impossible due to the low yield of variants in each disorder. This suggests that rather than restricting the genetic test, it is important for physicians to be trained in genetic test interpretation and the vital role that clinical phenotype plays in this process, as highlighted by a recent editorial,29 especially when considering the increasing utilization of genetics in the clinic and the push towards precision medicine. This phenotypic consideration becomes even more important considering the inclusion of RYR2 on molecular autopsy gene lists30 and the American College of Medical Genetics and Genomics’ (ACMG) recommendations for reporting of incidental findings24 in RYR2 even when there is a non-existent or a very low pre-test probability. While the RYR2 genetic test has been considered one of the most robust cardiac genetic tests, the insights from this study clearly show these assumptions have resulted in a potential over-reliance on the genetic test for a difficult disease to diagnose and these assumptions may in fact not hold true.
Recent advances in sequencing technology have enabled an expansion of the RYR2 genetic test from a targeted test to now including the entire coding region. However, this expansion has not enhanced the yield in cases, but rather has inflated profoundly the confounding background noise. Similarly, this issue has also been shown in HCM and Brugada syndrome where the expansion of the test panel to include all of the minor disease-susceptibility genes has largely led to an increase in the number of uninterpretable variants.30,31
Here, we leveraged population-based data to complement prior work on RYR2 hotspots by conducting exon-specific enrichment analyses, identifying 21 specific exons of RYR2 (exons 3, 8, 14, 43, 47–49, 81, 83, 88–90, 93, 95, 97–101, 103, 105) that host an overrepresentation of patient-derived variants. Given the data calling into question the evidence for some of the “minor” exons in RYR2, the pathogenic role of variants localizing to one of these 84 exons must be approached with extreme caution and would need substantial additional evidence to be considered clinically pathogenic especially without definitive clinical evidence of CPVT.
While molecular biology approaches remain the gold standard for the elevation or demotion of a putative pathogenic variant, the plausibility of testing the gamut of mutations present in a gene as large as RYR2 is quite low. Currently, <15% of the nearly 200 identified case-derived variants have been characterized functionally.28 Due to their quick analysis capabilities and the low costs associated with bioinformatics analyses, in silico phenotype prediction tools represent an attractive solution to this problem. Recent studies have suggested that these in silico tools could be used to improve the interpretation of rare RYR2 variants in CPVT.32,33 While promising, neither of these studies accounted for the clustering of case-derived variants to particular regions of the protein. Therefore, one has to question whether the tools could accurately predict pathogenicity within and outside of the critical regions.
Unfortunately, while in silico tools were able to identify many of the case-derived variants as pathogenic; approximately 50% of rare control variants were also declared as likely pathogenic. Ultimately, it was noted that the burden of false positives identified by in silico tools made it unfit to elevate the EPV for “novel” case variants, but had potential value in demoting certain variants. Thus, with appropriate clinical correlation such a variant could be considered benign. This is an important recognition that allows interpretation of genetic testing to be more sensitive and specific while preserving patients and their families from the burden of under- and over-treatment. Importantly, the recent recommendation from the American College of Medical Genetics suggests the use of multiple in silico tools.34
Limitations
There are several limitations in this case-control study. Our study relies on the assumption that the variants originating from controls are benign and the case-derived variants are pathogenic. Unfortunately, due to the complex nature of CPVT diagnosis and the lack of cardiac evaluation prior to enrollment in any of the control cohorts, it is possible that a small number of pathogenic variants may have been classified as background noise incorrectly. However, based on the very low prevalence of RYR2-mediated CPVT, it is expected that there are at most 6–7 CPVT-causing RYR2mutations in the over 60,000 “control” individuals included in this study. While we chose to use a MAF threshold of 0.01% to be inclusive of all potentially pathogenic variants, an even more stringent MAF threshold could be used.
While the referral cohort patients were sent for genetic testing by a physician based on some level of suspicion for the disease, no phenotypic requirements were made for inclusion in the study. Therefore, it is likely that a portion of the referral group in fact did not have CPVT. Again, this would result in the EPVs being conservative underestimates of pathogenicity. For the topology estimates, the inclusion of the referral group is warranted as it should be more difficult to find overrepresentation within this cohort but any region rising above the noise in this cohort can be considered valid and would likely be recapitulated by a similar sized cohort of cases exhibiting compelling evidence to support their CPVT diagnosis. Similarly, this would apply to the inclusion of the referral cohort variants in the in silico analysis. While significant findings utilizing the referral cohort are likely valid, there is a real chance of missing relevant associations, however, the utilization of the phenotyped cohorts attempts to alleviate some of these potential misses.
Conclusions
With increased availability of genetic testing, there has been increased utilization of genetic testing in cases of questionable clinical strength, potentially leading to incorrect diagnoses and overzealous treatment, undue stress, and risk for the patient. As genetic testing is further integrated into clinical practice, it is imperative that we are fully informed when interpreting the results of genetic tests. It is clear that, despite recommended testing for suspected CPVT cases, a rare RYR2 variant is not pathognomonic for CPVT, especially when the rare RYR2 variant resides outside of the RYR2’s 21 exons that are enriched with CPVT-susceptibility variants. By ensuring appropriate clinical work-up and considering disease appropriate factors, we can eliminate a significant amount of the uncertainty associated with the results. With increasingly evident background variation in many disease-susceptibility genes, these approaches have a significant impact on improving yield and reducing false discovery rates of genetic testing. Furthermore, for those patients who are referred for genetic testing, the localization of a variant to one of the 21 higher probability exons (exons 3, 8, 14, 43, 47–49, 81, 83, 88–90, 93, 95, 97–101, 103, 105) can be extremely informative as to whether it is disease causing. Additionally, in silico tools must be used with extreme caution taking into account the extremely high level of false positives.
Clinical Perspective
Tragically, catecholaminergic polymorphic ventricular tachycardia (CPVT) is a recognized cause of sudden cardiac death in the young, making its timely and accurate diagnosis of the utmost importance. As CPVT patients have a normal electrocardiogram (ECG) at rest, unless clinical suspicion prompts a stress test, CPVT often eludes discovery. The advent of the RYR2 genetic test and the recognition that ~60% of definite CPVT cases host a pathogenic variant in RYR2 resulted in the strongest genetic testing recommendations from the most recent consensus statement. Unfortunately, as suggested by this study, there has been increased utilization of CPVT genetic testing among weaker and weaker cases. Furthermore, despite the RYR2 genetic test having one of the highest signal-to-noise characteristics among cardiac genetic tests, a number of factors have been identified, compelling a word of caution. The identification that a handful of rare variants account for nearly 50% of the genetically identified CPVT cases suggests that the next new variant does not warrant the diagnostic stringency suggested by the consensus statement. While targeted testing of hotspots has long been recognized, the expansion of the test to include all RYR2 exons has not resulted in an enhancement of the test but rather has increased the background genetic noise further, hampering test interpretation. This study suggests that RYR2 genetic test results must be scrutinized carefully, especially when (1) the test is performed in cases with weaker diagnostic certainty and (2) a novel RYR2 variant is identified, especially if it localizes outside of the refined hotspot regions.
Supplementary Material
Acknowledgments
Sources of Funding: This work was supported by the Windland Smith Rice Comprehensive Sudden Cardiac Death Program (MJA). We acknowledge the support from the Netherlands CardioVascular Research Initiative: the Dutch Heart Foundation, Dutch Federation of University Medical Centres, the Netherlands Organisation for Health Research and Development and the Royal Netherlands Academy of Sciences (AAMW). JDK is supported by the NIH grant GM72474-08. JDK thanks the Mayo Clinic Medical Scientist Training Program for fostering an outstanding environment for physician-scientist training.
Footnotes
Disclosures: TEC is a former employee of Transgenomic, Inc. MJA is a consultant for Audentes Therapeutics, Boston Scientific, Gilead Sciences, Invitae, Medtronic, MyoKardia, and St. Jude Medical. Until spring 2016, MJA, DJT, and Mayo Clinic received royalties from Transgenomic for their FAMILION-LQTS and FAMILION-CPVT genetic tests. None of these entities provided financial support for this study.
References:
- 1.Hayashi M, Denjoy I, Extramiana F, Maltret A, Buisson NR, Lupoglazoff JM, et al. Incidence and risk factors of arrhythmic events in catecholaminergic polymorphic ventricular tachycardia. Circulation 2009;119:2426–2434. [DOI] [PubMed] [Google Scholar]
- 2.Leenhardt A, Lucet V, Denjoy I, Grau F, Ngoc DD, Coumel P. Catecholaminergic polymorphic ventricular tachycardia in children. A 7-year follow-up of 21 patients. Circulation 1995;91:1512–1519. [DOI] [PubMed] [Google Scholar]
- 3.Liu N, Ruan Y, Priori SG. Catecholaminergic polymorphic ventricular tachycardia. Prog Cardiovasc Dis 2008;51:23–30. [DOI] [PubMed] [Google Scholar]
- 4.Medeiros-Domingo A, Bhuiyan ZA, Tester DJ, Hofman N, Bikker H, van Tintelen JP, et al. The RYR2-encoded ryanodine receptor/calcium release channel in patients diagnosed previously with either catecholaminergic polymorphic ventricular tachycardia or genotype negative, exercise-induced long QT syndrome: a comprehensive open reading frame mutational analysis. J Am Coll Cardiol 2009;54:2065–2074. [DOI] [PMC free article] [PubMed] [Google Scholar]
- 5.George CH, Jundi H, Thomas NL, Fry DL, Lai FA. Ryanodine receptors and ventricular arrhythmias: emerging trends in mutations, mechanisms and therapies. J Mol Cell Cardiol 2007;42:34–50. [DOI] [PubMed] [Google Scholar]
- 6.Napolitano C, Priori SG, Bloise R. Catecholaminergic polymorphic ventricular tachycardia. In: Pagon RA, Adam MP, Ardinger HH, et al. , eds. GeneReviews(R) Seattle (WA)2014. [Google Scholar]
- 7.Ackerman MJ, Priori SG, Willems S, Berul C, Brugada R, Calkins H, et al. HRS/EHRA expert consensus statement on the state of genetic testing for the channelopathies and cardiomyopathies this document was developed as a partnership between the Heart Rhythm Society (HRS) and the European Heart Rhythm Association (EHRA). Heart Rhythm 2011;8:1308–1339. [DOI] [PubMed] [Google Scholar]
- 8.Ackerman MJ. Genetic purgatory and the cardiac channelopathies: Exposing the variants of uncertain/unknown significance (VUS) issue. Heart Rhythm 2015;12:2325–31. [DOI] [PubMed] [Google Scholar]
- 9.Hunter DJ, Khoury MJ, Drazen JM. Letting the genome out of the bottle--will we get our wish? N Engl J Med 2008;358:105–107. [DOI] [PubMed] [Google Scholar]
- 10.Giudicessi JR, Kapplinger JD, Tester DJ, Alders M, Salisbury BA, Wilde AA, et al. Phylogenetic and physicochemical analyses enhance the classification of rare nonsynonymous single nucleotide variants in type 1 and 2 long-QT syndrome. Circ Cardiovasc Genet 2012;5:519–528. [DOI] [PMC free article] [PubMed] [Google Scholar]
- 11.Kapa S, Tester DJ, Salisbury BA, Harris-Kerr C, Pungliya MS, Alders M, et al. Genetic testing for long-QT syndrome: distinguishing pathogenic mutations from benign variants. Circulation 2009;120:1752–1760. [DOI] [PMC free article] [PubMed] [Google Scholar]
- 12.Kapplinger JD, Giudicessi JR, Ye D, Tester DJ, Callis TE, Valdivia CR, et al. Enhanced classification of Brugada syndrome- and long QT syndrome-associated genetic variants in the SCN5A-encoded Nav1.5 cardiac sodium channel. Circ Cardiovasc Genet 2015;8:582–95. [DOI] [PMC free article] [PubMed] [Google Scholar]
- 13.Sun L, Craiu RV, Paterson AD, Bull SB. Stratified false discovery control for large-scale hypothesis testing with application to genome-wide association studies. Genet Epidemiol 2006;30:519–530. [DOI] [PubMed] [Google Scholar]
- 14.Benjamini Y, Hochberg Y. Controlling the false discovery rate: A practical and powerful approach to multiple testing. J. R. Stat. Soc. B 1995;57:289–300. [Google Scholar]
- 15.Roston TM, Vinocur JM, Maginot KR, Mohammed S, Salerno JC, Etheridge SP, et al. Catecholaminergic polymorphic ventricular tachycardia in children: analysis of therapeutic strategies and outcomes from an international multicenter registry. Circ Arrhythm Electrophysiol 2015;8:633–642. [DOI] [PMC free article] [PubMed] [Google Scholar]
- 16.Moya A, Sutton R, Ammirati F, Blanc JJ, Brignole M, Dahm JB, et al. Guidelines for the diagnosis and management of syncope (version 2009). Eur Heart J 2009;30:2631–2671. [DOI] [PMC free article] [PubMed] [Google Scholar]
- 17.Kozlovski J, Ingles J, Connell V, Hunt L, McGaughran J, Turner C, et al. Delay to diagnosis amongst patients with catecholaminergic polymorphic ventricular tachycardia. Int J Cardiol 2014;176:1402–1404. [DOI] [PubMed] [Google Scholar]
- 18.Siegers CE, Visser M, Loh P, van der Heijden JF, Hassink RJ. Catecholaminergic polymorphic ventricular tachycardia (CPVT) initially diagnosed as idiopathic ventricular fibrillation: the importance of thorough diagnostic work-up and follow-up. Int J Cardiol 2014;177:e81–83. [DOI] [PubMed] [Google Scholar]
- 19.Priori SG, Napolitano C, Tiso N, Memmi M, Vignati G, Bloise R, et al. Mutations in the cardiac ryanodine receptor gene (hRyR2) underlie catecholaminergic polymorphic ventricular tachycardia. Circulation 2001;103:196–200. [DOI] [PubMed] [Google Scholar]
- 20.Laitinen PJ, Brown KM, Piippo K, Swan H, Devaney JM, Brahmbhatt B, et al. Mutations of the cardiac ryanodine receptor (RyR2) gene in familial polymorphic ventricular tachycardia. Circulation 2001;103:485–490. [DOI] [PubMed] [Google Scholar]
- 21.Napolitano C, Bloise R, Memmi M, Priori SG. Clinical utility gene card for: Catecholaminergic polymorphic ventricular tachycardia (CPVT). Eur J Hum Genet 2014;22. [DOI] [PMC free article] [PubMed]
- 22.Lek M, Karczewski KJ, Minikel EV, Samocha KE, Banks E, Fennell T, et al. Analysis of protein-coding genetic variation in 60,706 humans. Nature 2016;536:285–291. [DOI] [PMC free article] [PubMed] [Google Scholar]
- 23.Priori SG, Wilde AA, Horie M, Cho Y, Behr ER, Berul C, et al. HRS/EHRA/APHRS expert consensus statement on the diagnosis and management of patients with inherited primary arrhythmia syndromes: document endorsed by HRS, EHRA, and APHRS in May 2013 and by ACCF, AHA, PACES, and AEPC in June 2013. Eur J Hum Genet 2013;10:1932–1963. [DOI] [PubMed] [Google Scholar]
- 24.Green RC, Berg JS, Grody WW, Kalia SS, Korf BR, Martin CL, et al. ACMG recommendations for reporting of incidental findings in clinical exome and genome sequencing. Genet Med 2013;15:565–574. [DOI] [PMC free article] [PubMed] [Google Scholar]
- 25.Kapplinger JD, Landstrom AP, Bos JM, Salisbury BA, Callis TE, Ackerman MJ. Distinguishing hypertrophic cardiomyopathy-associated mutations from background genetic noise. J Cardiovasc Transl Res 2014;7:347–361. [DOI] [PMC free article] [PubMed] [Google Scholar]
- 26.Kapplinger JD, Tester DJ, Salisbury BA, Carr JL, Harris-Kerr C, Pollevick GD, et al. Spectrum and prevalence of mutations from the first 2,500 consecutive unrelated patients referred for the FAMILION long QT syndrome genetic test. Heart Rhythm 2009;6:1297–1303. [DOI] [PMC free article] [PubMed] [Google Scholar]
- 27.van der Werf C, Nederend I, Hofman N, van Geloven N, Ebink C, Frohn-Mulder IM, et al. Familial evaluation in catecholaminergic polymorphic ventricular tachycardia: disease penetrance and expression in cardiac ryanodine receptor mutation-carrying relatives. Circ 2012;5:748–756. [DOI] [PubMed] [Google Scholar]
- 28.Wangüemert F, Bosch Calero C, Pérez C, Campuzano O, Beltran-Alvarez P, Scornik FS, et al. Clinical and molecular characterization of a cardiac ryanodine receptor founder mutation causing catecholaminergic polymorphic ventricular tachycardia. Heart Rhythm 2015;12:1636–1643. [DOI] [PubMed] [Google Scholar]
- 29.Beausejour Ladouceur V Training in cardiovascular genetics. J Am Coll Cardiol 2015;65:856–858. [DOI] [PubMed] [Google Scholar]
- 30.Alfares AA, Kelly MA, McDermott G, Funke BH, Lebo MS, Baxter SB, et al. Results of clinical genetic testing of 2,912 probands with hypertrophic cardiomyopathy: expanded panels offer limited additional sensitivity. Genet Med 2015;17:880–8. [DOI] [PubMed] [Google Scholar]
- 31.Le Scouarnec S, Karakachoff M, Gourraud JB, Lindenbaum P, Bonnaud S, Portero V, et al. Testing the burden of rare variation in arrhythmia-susceptibility genes provides new insights into molecular diagnosis for Brugada syndrome. Hum Mol Genet 2015;24:2757–63. [DOI] [PubMed] [Google Scholar]
- 32.Jabbari J, Jabbari R, Nielsen MW, Holst AG, Nielsen JB, Haunsø S, et al. New exome data question the pathogenicity of genetic variants previously associated with catecholaminergic polymorphic ventricular tachycardia. Circ Cardiovasc Genet 2013;6:481–489. [DOI] [PubMed] [Google Scholar]
- 33.Walsh R, Peters NS, Cook SA, Ware JS. Paralogue annotation identifies novel pathogenic variants in patients with Brugada syndrome and catecholaminergic polymorphic ventricular tachycardia. J Med Genet 2014;51:35–44. [DOI] [PMC free article] [PubMed] [Google Scholar]
- 34.Richards S, Aziz N, Bale S, Bick D, Das S, Gastier-Foster J, et al. Standards and guidelines for the interpretation of sequence variants: a joint consensus recommendation of the American College of Medical Genetics and Genomics and the Association for Molecular Pathology. Genet Med 2015;17:405–24. [DOI] [PMC free article] [PubMed] [Google Scholar]
Associated Data
This section collects any data citations, data availability statements, or supplementary materials included in this article.