Abstract
Speckle tracking based on block matching is the most common method for multi-dimensional motion estimation in ultrasound elasticity imaging. Extension of two-dimensional (2-D) methods to three dimensions (3-D) has been problematic because of the large computational load of 3-D tracking, as well as performance issues related to the low frame (volume) rates of 3-D images. To address both of these problems, we have developed an efficient two-pass tracking method suited to cardiac elasticity imaging. PatchMatch, originally developed for image editing, has been adapted for ultrasound to provide first-pass displacement estimates. Second-pass estimation uses conventional block matching within a much smaller search region. 3-D displacements are then obtained using correlation filtering previously shown to be effective against speckle decorrelation. Both simulated and in vivo canine cardiac results demonstrate that the proposed two-pass method reduces computational cost compared to conventional 3-D exhaustive search by a factor of 10. Moreover, it outperforms one-pass tracking by a factor of about 3 in terms of root-mean-square error relative to available ground-truth displacements.
Index Terms: 3-D speckle tracking, ultrasound imaging, ultrasound elasticity imaging, PatchMatch, multi-pass tracking, strain imaging, speckle decorrelation, correlation filter
I. INTRODUCTION
Medical ultrasound not only provides anatomical information using B-mode (i.e., brightness mode), but also quantitative tissue motion such as blood flow imaging (e.g., color Doppler) [1]–[2] and ultrasound elasticity (e.g., strain (rate) imaging and shear wave imaging) [3]–[8]. Tissue motion can be detected with a wide range of techniques developed for image processing and computer vision [9]–[18]. However, the two most common exploit phase-sensitive image formation: Doppler processing and speckle tracking [19]. Doppler-based methods are preferred for blood flow and 1-D tissue motion estimation [20]–[21] because of their simplicity for real-time implementation [1]–[2]. In contrast, speckle tracking methods are extensively used in ultrasound elasticity to characterize multi-dimensional motion [22]–[25]. Unlike Doppler, speckle tracking calculates all spatial components of tissue displacements from the speckle similarity between the original image frame and the frame after a deformation is induced [26]–[29]. It is a specific form of block matching, which can be realized with cross correlation or sum of absolute differences (SAD) processing using either envelope-detected signals (phase-insensitive tracking) or complex signals (phase-sensitive tracking) [29]. Therefore, speckle tracking is not subject to the angle dependency of Doppler processing and enables quantification of local tissue deformation [30]–[33].
Speckle tracking is particularly valuable in assessing myocardial dysfunction such as infarction and ischemia [34]–[35]. Two-dimensional (2-D) tracking has been used routinely for cardiac strain imaging [36]. However, deformation-induced displacement is inherently three dimensional (3-D), requiring 3-D methods to estimate the full displacement vector and derive associated components of the strain tensor capturing changes in regional cardiac mechanics due to disease processes [37]–[45]. While extending conventional 1-D/2-D speckle tracking to 3-D is straightforward, processing massive, fully-sampled volumetric data is time consuming, making it challenging for routine clinical use.
Computational reduction of 1-D and 2-D correlation-based block matching was previously considered in [46]. Although a variety of 3-D speckle tracking approaches have been proposed [9]–[18], [37]–[45], computational load was not considered for 3-D block matching [47]. Indeed, alternate tracking methods with greatly reduced computations have been proposed even though the spatial resolution of derived displacement fields is generally much lower than that of block matching approaches [14]. The basic arithmetic operations used in block matching scale with the size of the block and the size and density of the searched field [37]. Consequently, arithmetic operations increase quadratically with spatial dimension, limiting the clinical applicability of 3-D block matching even given the continued growth in computational capabilities.
In addition, 3-D tracking performance is an issue primarily because of the reduced frame (volume) rates compared to conventional 2-D rates. This can induce significant speckle decorrelation (i.e., speckles are dissimilar between two frames used for tracking) due to low signal-to-noise ratio, limited depth-of-field, motion gradients within the sample volume, and tissue deformation [37], [48]. Speckle decorrelation is the primary cause of displacement estimation error [37], [49]. It increases the possibility of peak hopping artifacts (i.e., false estimation) in which a secondary false correlation peak is chosen as the highest correlation value, resulting in significant error in the displacement estimate [48], [50].
An effective approach to minimize these artifacts is short-time (i.e., small kernel size) normalized cross-correlation (NCC) followed by a correlation filter applied to adjacent pixels [28], [51]–[52]. The small kernel reduces most causes of decorrelation, whereas the correlation filter spanning multiple kernels can suppress peak hopping at the slight expense of spatial resolution [28]. This scheme works effectively for small strain-induced speckle decorrelation [51]. However, peak hopping artifacts are still present in low frame rate 3-D speckle tracking of cardiac images due to large interframe displacements and strains [48].
Multi-pass methods splitting the search into an initial coarse guess over a large search region followed by a high resolution search over a limited region can help increase computational efficiency and reduce peak hopping artifacts for 3-D tracking [37], [53]–[55]. The method presented in [54] estimates the displacement at central scan lines on the first pass, and then propagates outward to estimate displacements in the lateral direction. It assumes spatially correlated motion continuity, a reasonable notion for quasi-static applications such as breast and thyroid elasticity imaging [54]. Applying it to cardiac imaging is unclear, however, because local strain variation is significant and this assumption may not hold.
Other methods [37], [55] use a large correlation kernel and search region in the first pass for coarse-to-fine two-pass tracking. Low-resolution displacement estimates are first obtained and then used to guide a higher-resolution search with a much smaller correlation kernel. Because no assumptions are made about the motion pattern, it can be applied to cardiac imaging but presumably some initial estimates are required to guarantee good overall performance.
Recently, an algorithm based on randomized search called PatchMatch was developed for image editing and computer vision to speed up finding correspondence between two different images or videos [56]–[57]. It has also been applied to medical imaging [58]–[60]. Based on ultrasound simulation data, PatchMatch performance is comparable to that of an extensive search [60], though more clinical data are required to further test feasibility. Beyond reducing computational load, PatchMatch implicitly imposes smoothness of displacement estimates in adjacent voxels (as explained in Section II-D), which reduces peak hopping artifacts [60]. Hence, incorporating PatchMatch into multi-pass tracking has the potential to improve coarse-to-fine tracking where reliable initial displacement estimation is crucial.
The purpose of this paper is to directly address the primary challenges limiting routine clinical application of 3-D speckle tracking: computational load and peak hopping artifacts associated with large interframe displacements. We propose efficient two-pass tracking, where in the first pass PatchMatch is employed for initial displacement estimates. The second pass uses conventional block matching with smaller search regions, followed by 3-D correlation filtering applied to NCCs at adjacent voxels.
This paper is organized as follows. Our specific two-pass tracking approach is presented in Section II. Simulation and in vivo canine cardiac data are also described. In Section III, displacement estimation results and error analyses are provided. We conclude with a discussion of computational efficiency in Section IV.
II. METHODS
A. SIMULATED CARDIAC DATA
To quantify the performance of different displacement estimation approaches, simulated 4-D cardiac data developed in [61] are used with available ground-truth motion vectors. A detailed description of this simulation model can be found in [47]. In brief, synthetic cardiac data are based on a specific electro/mechanical (E/M) model of the heart [62] that drives the positions of a collection of ultrasound scatterers input to the COLE ultrasound simulator [63]. By varying several parameters of the E/M model, different pathophysiological conditions were simulated to produce a loop of 3-D ultrasound images over one heart cycle. In this study, dyssynchronous heart disease due to left bundle branch block (LBBB), characterized by a progressively longer delay in the activation of the septum and lateral wall, is used as a representative example to verify the proposed method.
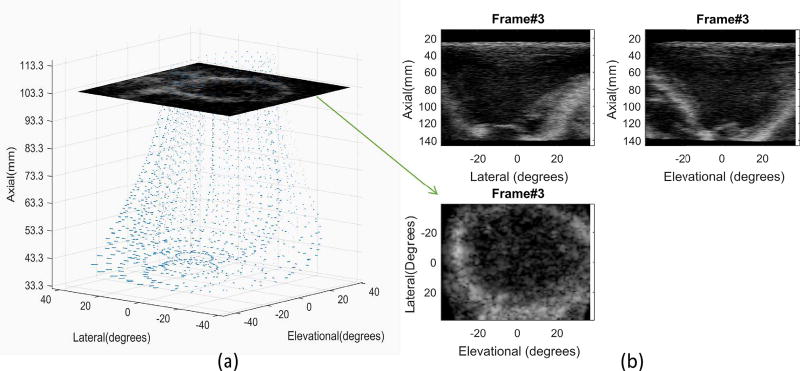
Figure 1a shows the simulated model of the left ventricle with LBBB where 2250 mesh nodes (30 longitudinal points, 25 circumferential points, and 3 radial points) are distributed within the myocardium. These images are displayed in spherical coordinates. Figure 1b shows the simulated ultrasound array with a center frequency of 3.3 MHz and a −6 dB fractional bandwidth of 65% was assumed. The volumetric image contained 107 and 80 beams in lateral and elevational directions, respectively, spanning an angle of 76° in both directions. Therefore, the beam interval in lateral and elevational directions was 0.72° and 0.96°, respectively. For each beam, radio frequency (RF) signals were sampled at a rate of 50 MHz yielding 13,637 samples in the axial direction. To reduce the number of samples while satisfying the Nyquist sampling criterion, RF data were further downsampled to a 13.2 MHz rate. The resulting signals were then demodulated to baseband prior to speckle tracking.
| (1) |
Fig. 1.
Simulated cardiac ultrasound imaging with LBBB (left branch bundle block) disease obtained from [61]. (a) The simulation uses 2250 nodes (30 longitudinal points, 25 circumferential points, and 3 radial points) distributed within the whole myocardium of the left ventricle. Note that the images are displayed in spherical coordinates. (b) Volumetric image is shown using 3-D projections. The frame rate is 34 Hz where 40 frames are simulated over one heart cycle. In this study, 3-D displacement estimates are obtained for the short-axis image (i.e., the lateral-elevational image plane).
A total of 40 frames was simulated within a complete heart cycle at a frame/volume rate of 34 Hz. In this study, 3-D displacement estimates were evaluated for the cardiac short-axis (i.e., the lateral-elevational image plane indicated in Fig. 1a). Due to limited mesh nodes in the original model, ground-truth displacements in this image plane were obtained by dense linear interpolation between nodes. It should be noted that all displacement results reported here are interframe displacements. Therefore, spatial derivatives of these results represent strain rate imaging in Eulerian format rather than strain imaging in Lagrangian format [22].
B. IN VIVO CANINE CARDIAC DATA
A well-defined animal protocol was also used to test the performance of different displacement estimation approaches [45], [64]. Myocardial infarction was induced in a male mongrel canine by percutaneous balloon angioplasty occlusion of the left anterior descending coronary artery for six hours. At six weeks post-MI, the canine was anesthetized and an open-chest 4DE imaging study of the left ventricle was performed. Both RF and B-mode data were acquired using a Philips iE33 ultrasound machine (Philips Medical Systems, Andover, MA, USA) with a matrix X7-2 phased array operating at a center frequency of 3.8 MHz.
The volumetric image was acquired using ECG gating, where the whole image was reconstructed from seven cardiac cycles. The frame (volume) rate was 51 Hz. The volumetric image contained 62 and 56 beams covering 91.5° and 82.5° in lateral and elevational directions, respectively. Each beam contained 2360 samples in the axial direction at a sampling rate of 16 MHz. After euthanasia, postmortem tissue visualization of LV cross-sections was performed to confirm the extent of myocardial infarction. The study was performed with approval of the Institutional Animal Care and Use Committee at the Yale University School of Medicine. Studies were performed in compliance with the National Institutes of Health Guide for the Care and Use of Laboratory Animals (1996) [45].
C. 3-D SPECKLE TRACKING
The basic block matching algorithm used here computes the phase-sensitive normalized cross correlation between two volumetric frames (volumes) [28], [37]. Define (x, y, z) as the coordinates in lateral, elevational, and axial directions, respectively, as integer multiples of the spatial sampling interval in these directions. For each voxel (x, y, z) in the first volumetric frame, a baseband-demodulated kernel u(x, y, z) centered at that voxel with a size of (K+1, L+1, M+1) points in three dimensions is defined. This kernel is then compared to equivalent ones υ(x, y, z) in the second frame using the 3-D normalized cross-correlation coefficient (NCC) , as given by (1) (See the top) [37], where (lx, ly, lz) denotes the lag (i.e., the voxel displacement between two frames) in the search region; * represents complex conjugation; |•| represents the absolute value. Wi j h is a 3-D weighting function with unity gain. A Hamming window was used in this paper.
Typically, the size of u(x, y, z) equals one speckle spot to minimize decorrelation induced by significant local strains [28]. The 3-D displacement at voxel (x, y, z) is estimated from the position of the maximum NCC in lag space. This computation is not restricted to integer displacements and sub-voxel accuracy is typically obtained with proper estimation of the peak position.
Prior to displacement estimation, a 3-D correlation filter is applied over a group of neighboring NCCs centered at the NCC corresponding to the voxel under investigation. The filtered NCC ρxyz is then expressed as [37]
| (2) |
where Fi j h is the 3-D correlation filter with a size of (Sx+1, Sy+1, Sz+1) in three dimensions. Here, a Hanning window was used. Note that the correlation filter is applied to the spatial extent of the image region rather than the lag direction [37]. As mentioned in Section I, correlation filtering can effectively reduce tracking errors for small deformations at the slight expense of spatial resolution [28], [51].
D. APPLYING PATCHMATCH TO SPECKLE TRACKING
Originally, PatchMatch was developed for computer vision [56]. For each kernel (called patch) in the original image, the algorithm searches for its nearest neighbor (i.e., the most similar kernel) in the target image. Dissimilarity is typically based on a generalized distance metric including terms such as the sum of squared differences between pixel values in different patches. The most similar kernel minimizes the general distance metric for all kernels tested [56]. The resulting nearest neighbor field (NNF) contains the map indicating each pixel index corresponding to its nearest neighbor. Then, image editing can be done based on NNF [56]. Figure 2 shows how PatchMatch is applied to ultrasound speckle tracking [60].
Fig. 2.
Schematic flow chart of PatchMatch for displacement estimation. Taking a kernel (indicated as a blue cube) in the reference image as an example, (a) six closest neighbors surrounding this kernel (only three are displayed) are indicated with different colors. (b) The positions of the kernel and its neighbors in the target image are randomly assigned. The similarity between individual pairs in the reference and target images (i.e., identical color cubes) is measured. (c) The kernel propagates to the neighborhood having the maximum similarity. (d) Other random positions are chosen to avoid a local maximum. (e) Determine the final position by comparing the similarity of all candidates in (d). (f) Iteration is performed between (c)–(e) to find the positions of all kernels.
There are three major steps in PatchMatch: initialization, propagation, and random search [56]. Take a kernel (indicated as a blue cube) in the reference volumetric image as an example. It and its six spatially closest neighbors (indicated with different colors, Fig. 2a) are assigned to the uniformly-distributed random positions in the target volumetric image (Fig. 2b). In practice, such random assignment is confined to a pre-defined search region according to a priori knowledge of the maximum tissue motion. The similarity between the individual pair in the reference and target images is measured using an NCC approach (defined in (1)). By comparing the NCC values of all seven neighbors, the kernel propagates to the neighbor with the maximum NCC value (Fig. 2c).
To avoid falling into a local maximum, additional search is performed by randomly selecting other positions (Fig. 2d), confined to a pre-defined search region. In this study, six random positions are empirically determined. Last, the final position in the target image is determined by calculating the maximum NCC among all seven positions (Fig. 2e).
By iterating between propagation and random search, the final positions for all kernels converges efficiently (Fig. 2f). In practice, iteration is performed in windshield-wiper order, i.e., from left/top/front to right/down/end and then scanned backward. Thus, two iterations complete one scan cycle. Accordingly, 3-D displacements between two volumetric images are estimated, which serve as first-pass estimates in two-pass tracking. The required number of iterations will be evaluated in Section III-A.
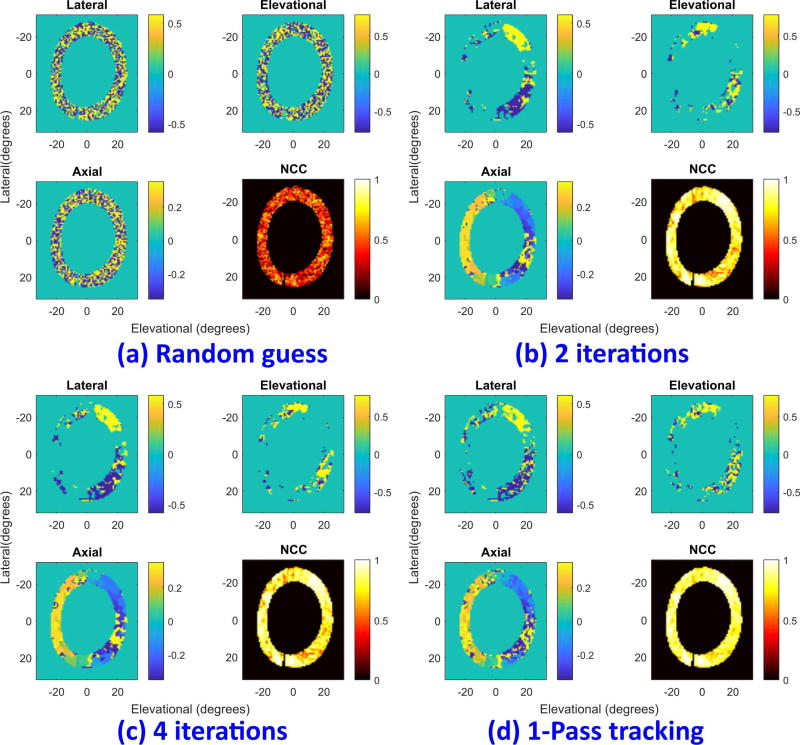
To show how PatchMatch works in ultrasound imaging, Fig. 3 presents displacement estimates for the simulated cardiac data mentioned in Section II-A at end-systole (ES), i.e., at the end of heart contraction. Simulated cardiac deformations at this point are expected to be the largest over the cardiac cycle. A kernel size of 5×17×5 (lateral × axial × elevational) was used. Figure 3a shows initial displacements, where the random position is assigned for each individual kernel. The three displacement components (lateral-upper left, elevational-upper right, and axial-lower left) components of displacement along with the maximum NCC map (lower right) are displayed in the four panels. Lateral and vertical axes represent the elevational and lateral directions in degrees, respectively. Axial displacements are in units of mm whereas lateral and elevational ones are in degrees.
Fig. 3.
Displacement estimate at end-systole (ES) using PatchMatch. For each panel, lateral (upper left), elevational (upper right), and axial (lower left) components are displayed along with the NCC (lower right): (a) first random assignment, (b) 2 iterations, and (c) 4 iterations. For comparison, the results of conventional speckle tracking (referred to as one-pass tracking) (d) are also shown. Lateral and vertical axes represent the elevational and lateral directions in degrees, respectively. Axial displacements are in units of mm whereas lateral and elevational ones are in degrees.
After two iterations, as shown in Fig. 3b, displacement estimates converge. Note that since the lateral and elevational displacements are much smaller than the axial one, displacements less than one voxel size become zero inside the myocardium. Applying four iterations further improves the results until final convergence (Fig. 3c).
For comparison, the result of conventional one-pass tracking with the same kernel size is shown in Fig. 3d. After four iterations PatchMatch produces displacement results very similar to those from the exhaustive search. Peak hopping reduction by PatchMatch can be observed at 5 and 8 o’clock in the myocardium where smoother estimates are obtained even though the corresponding maximum NCCs are smaller than those of one-pass tracking (comparing the lower right panels in Figs. 3c and 3d). However, both methods fail to find good estimates where there is significant strain, such as at 4 o’clock. As demonstrated in the next section, these results can be improved using correlation filtering in two-pass tracking.
E. PROPOSED TWO-PASS SPECKLE TRACKING
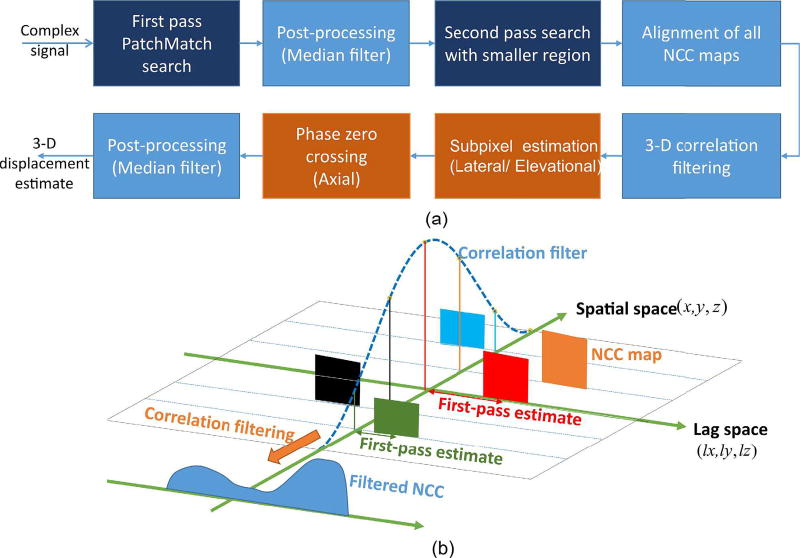
As shown in Fig. 3, PatchMatch can efficiently obtain displacement estimates within a few iterations. However, for large deformations, these estimates must be improved. Therefore, we propose the two-pass scheme illustrated in Fig. 4.
Fig. 4.
(a) Block diagram of the proposed 3-D two-pass speckle tracking method, where NCC stands for normalized cross-correlation coefficient. (b) Illustration of NCC alignment and correlation filtering. For simplicity, 3-D block matching is represented as the lag space (i.e., (lx, ly, lz)) and the spatial space (i.e., (x, y, z)). After second-pass search, each NCC has its extent in lag space (indicated as boxes) and is then shifted to its PatchMatch estimate. Correlation filtering is performed by multiplying different weightings on all relevant NCCs (The same color represents applying the same weighting), and summing them in spatial space. The resulting filtered NCC is indicated in the lower left of the figure.
PatchMatch is used on the first-pass with a kernel size slightly larger than a speckle spot (less than two speckle spots – see Table I). One speckle spot was determined based on the full-width at half maximum (FWHM) of the auto-correlation function of the baseband volumetric image [48]. Using a slightly larger kernel is a tradeoff between ensemble averaging and speckle decorrelation because no correlation filtering is applied at this stage. To remove inconsistent estimates, resulting estimates are further processed by filtering, such as a median filter.
TABLE I.
Tracking Parameters Associated With One-Pass and Two-Pass Tracking Used in the Simulation and Experiment.
| Parameter | Simulation | Experiment | ||
|---|---|---|---|---|
| One-pass tracing | Kernel | 3×17×3 | ||
| Search region | 7×55×7 | 7×63×7 | ||
| Correlation filter | 5×7×5 | |||
| Two-pass tracking | PatchMatch | Kernel | 5×17×5 | |
| Search region | 7×55×7 | 7×63×7 | ||
| Second pass | Kernel | 3×17×3 | ||
| Search region | 2×11×2 | |||
| Correlation filter | 5×7×5 | |||
All sizes are indicated in format of (lateral × axial × elevational) and in units of voxels. The measured speckle spot was 4×14×3.
In the second pass, a smaller kernel (around one speckle spot – see Table I) is then used to perform the full search within a smaller search region. Prior to applying 3-D correlation filtering, alignment between all relevant NCCs is needed, as illustrated in Fig. 4b. This is because the zero lag (i.e., (lx, ly, lz) = (0, 0, 0) in (2)) for each NCC varies with the estimate of PatchMatch. Hence, to ensure all NCCs have the same zero-lag reference, every NCC is shifted to its PatchMatch estimate in lag space. Correlation filtering is then performed by applying different weightings on the aligned NCCs (indicated in different colors in Fig. 4b), and then summing all NCCs in the spatial extent.
After correlation filtering, subpixel interpolation using second-order polynomial fitting on 27 closest neighbors is then applied to the magnitude of the filtered NCC. Once the peak of the interpolated NCC is determined, the corresponding lag provides finer resolution estimates in lateral and elevational directions [37].
The axial displacement component is estimated using the phase zero crossing technique. It exploits the fact that the phase of the analytic representation of the NCC is precisely zero at the peak location along the axial direction [28]. Its main advantage is that the axial displacement can be accurately estimated without having to densely interpolate the NCC in the axial direction to find the peak position [28]. For this purpose, the baseband NCC is first modulated to form the analytic signal. The phase zero crossing is then estimated by least-squares linear fitting of the phases at the lags surrounding the NCC peak [28]. Finally, a median filter is again used to remove inconsistent estimates.
III. RESULTS
Both simulation and in vivo canine cardiac data sets were evaluated to demonstrate the performance of the two-pass tracking approach presented in Fig. 4. Table I lists tracking parameters associated with one-pass and two-pass tracking used in the simulation and experiment. Note that due to oversampling in the axial direction (i.e., 4 times the center frequency), the correlation filter was applied every 4 voxels axially. By doing so, compared to our previous results [37], [48], arithmetic operations are reduced by a factor of 4 while keeping filtered results acceptable.
In the simulation, both tracking methods measured the short-axis cardiac image in the lateral-elevational image plane using a 5×5 (lateral × elevational) 2-D median filter for post-processing. In contrast, experimental measurements were conducted in the axial-lateral image plane using a 20×5 (axial × lateral) median filter. No thresholding (e.g., NCC-based) and regularization were used to produce final displacement estimates.
To quantify the displacement error between estimates and ground truth results, both bias and root-mean-square error (RMSE) were measured according to
| (3) |
and (3)
| (4) |
where N is the number of points inside the myocardium, and xi and are the true and estimated i -th displacement components for these N points, respectively.
A. SIMULATED CARDIAC DATA
1) STATISTICAL EVALUATION OF TWO-PASS TRACKING
The robustness of PatchMatch’s random initialization for ultrasound imaging and the number of iterations required for stable results was first investigated.
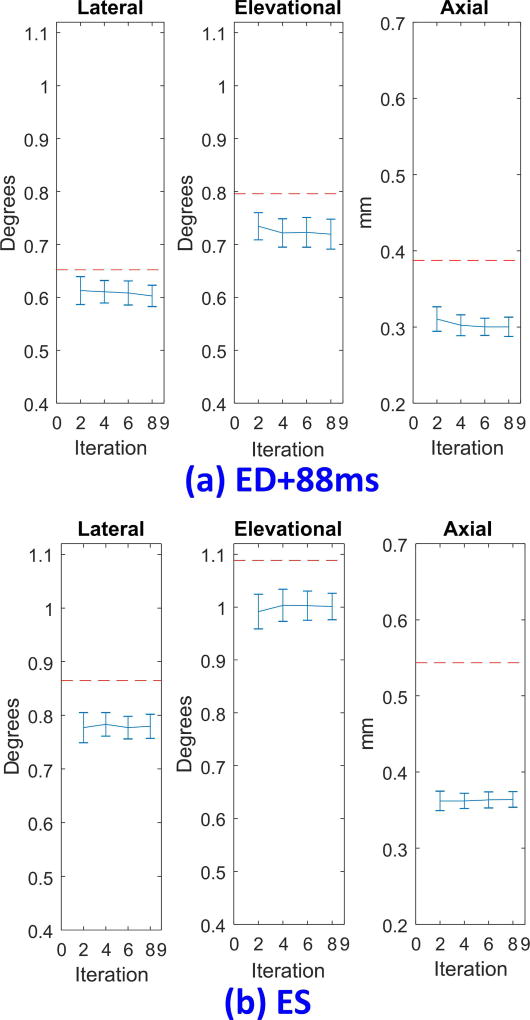
With sixty independent realizations (i.e., different random assignment for the initial displacement), Fig. 5 shows the RMSE of the three displacement components (expressed as mean ± standard deviation) as a function of iteration estimated with two-pass tracking in the early systolic period (Fig. 5a, approximately 88 ms from end-diastole (ED)) and at ES (Fig. 5b). The former represents the point where average interframe deformations are not significant compared to peak deformations at ES. To solely identify the effects of random initialization on estimation errors, both 3-D correlation filtering and the second median filter in Fig. 4 are not included. In comparison, the dashed line indicates the RMSE of conventional one-pass tracking. Clearly, two-pass tracking is insensitive to the random initialization of PatchMatch. Moreover, errors are even smaller than those of one-pass tracking without correlation filtering.
Fig. 5.
Root mean square error (RMSE) of displacements using two-pass tracking as a function of iteration with 60 independent realizations. The error bar spans two times the standard deviation. (a) RMSE in the early systolic period (approximately 88 ms from end-diastole (ED)). (b) RMSE at end-systole (ES). Lateral (left), elevational (middle), and axial (right) displacement estimates are shown in each figure. Dashed lines show the RMSE of one-pass tracking. For the results presented here, both approaches do not use correlation and median filtering.
Figure 5 also demonstrates that two-pass tracking can rapidly converge after two iterations (i.e., one complete scan cycle). Moreover, errors do not strictly decrease with the number of iterations, where residual errors are hardly improved due to speckle decorrelation. However, they are still smaller than those of one-pass tracking. This suggests PatchMatch is an efficient and reliable first-pass displacement estimator. In the following evaluations, we chose four iterations as a compromise between convergence and computational load.
2) DISPLACEMENT ESTIMATION EVALUATION
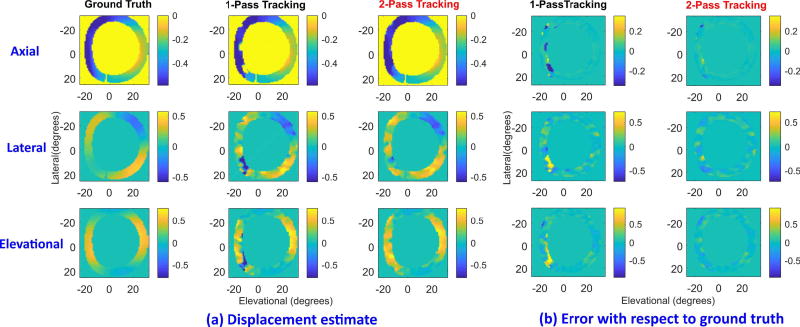
Figure 6 shows displacement estimates from simulated cardiac images at 88 ms after ED. Ground truth displacements (first column) are compared with those using one-pass tracking (second column) and two-pass tracking (third column). All three components, axial (first row), lateral (middle row), and elevational (bottom row), are shown. Errors in one-pass tracking (fourth column) and two-pass tracking (fifth column) with respect to ground truth are also shown. The axes and units are identical to those in Fig. 3. Clearly, larger errors are present in one-pass tracking than two-pass tracking at 7 and 8 o’clock. They are mainly caused by significant cardiac deformations (i.e., spatial gradients of the displacements) in these regions. Two-pass tracking can effectively reduce estimation error and outperform one-pass tracking for this case.
Fig. 6.
Displacement estimation of simulated cardiac data in early systolic period (approximately 88 ms from ED). (a) Ground truth displacements (first column) are compared with one-pass tracking (second column) and two-pass tracking (third column) estimates. The axial (first row), lateral (middle), and elevational (last) components are shown. (b) Errors in one-pass tracking (fourth column) and two-pass tracking (fifth column) with respect to ground truth. All images are shown with horizontal and vertical axis representing elevational and lateral directions (in degrees), respectively. Axial displacements are in units of mm whereas lateral and elevational ones are in degrees.
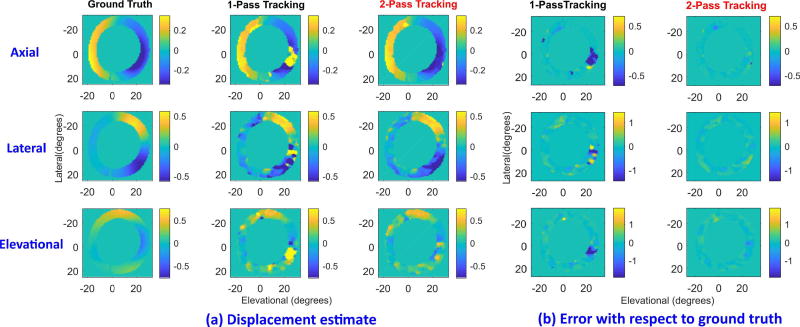
The effectiveness of two-pass tracking is further demonstrated in Fig. 7, where the simulated myocardial deformation at ES is the largest. All image formats are identical to those in Fig. 6. Specifically, the deformations at 4 and 5 o’clock are more significant than those in Fig. 6 where one-pass tracking exhibits larger errors. Two-pass tracking can still obtain displacements close to ground truth. Moreover, comparing Fig. 3 with Fig. 7 where both are evaluated at ES, correlation filtering is clearly effective in reducing peak hopping artifacts. Axial estimation after PatchMatch (Fig. 3c) is improved by the correlation filter. Additionally, lateral and elevational displacement components are improved as well not only by subpixel interpolation, but also by correlation filtering.
Fig. 7.
Displacement estimation of simulated cardiac data at ES. All image formats are identical to those in FIGURE 6. Due to the significant strain present in the lower right myocardial region, one-pass tracking is subject to larger estimation errors than two-pass tracking.
Using the same format, we have included a supplementary file presenting two videos of interframe displacement estimates and errors over a complete heart cycle. Results for ground truth (left column), one-pass tracking (middle), and two-pass tracking (right) are compared. Here, the display frame rate is reduced to 1 Hz for easy side-by-side comparison. The videos will be available at http://ieeexplore.ieee.org.
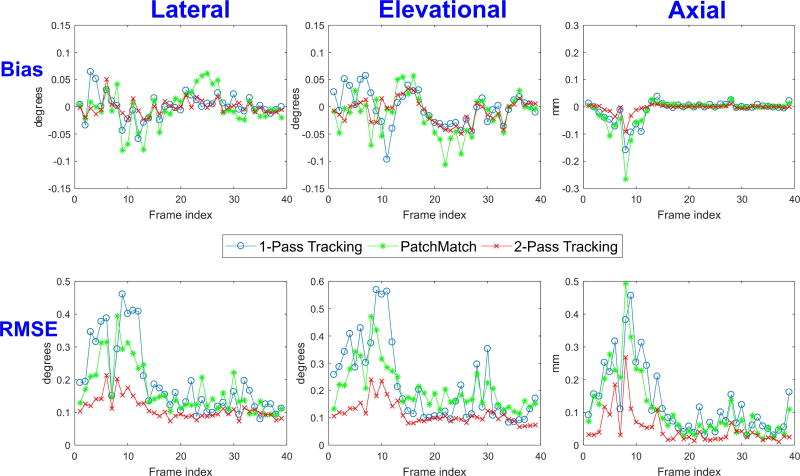
A quantitative comparison between one-pass (blue line) and two-pass (red line) tracking over a complete heart cycle is shown in Fig. 8. To understand the individual contributions of PatchMatch and correlation filtering in reducing peak hopping artifacts, the results of PatchMatch are also compared (green line), where the first median filter, the second pass search, and correlation filtering (as shown in Fig. 4) were bypassed. Therefore, the results shown here can be regarded as one-pass tracking with PatchMatch.
Fig. 8.
Comparison of displacement errors over a heart cycle using simulated cardiac data between one-pass tracking (blue line), two-pass tracking (red line), and PatchMatch (green line). Here, the results of PatchMatch are obtained by bypassing the first median filter, the second-pass search and correlation filtering indicated in Fig. 4. The bias (top row) and RMSE (bottom row) of lateral (first column), elevational (second column), and axial (third column) estimates are presented as a function of frame index. Axial displacements are in units of mm whereas lateral and elevational ones are in degrees.
The bias (top row) and RMSE (bottom row) of lateral (first column), elevational (second column), and axial (third column) estimates are presented as a function of frame index. Clearly, two-pass tracking consistently outperforms one-pass tracking for all displacement components in all frames. One-pass tracking has significant bias and RMSE from the first to the eleventh frame index (representing the period between ED and ES) where the heart exhibits larger deformation than other periods. Errors are maximal around ES.
Also, this figure clearly shows that the performance of PatchMatch tracking alone is comparable to that of one-pass tracking, consistent with the results reported in [60]. However, applying the second-pass search with correlation filtering significantly reduces the errors of all three components, as is evident by comparing green lines with red ones. Quantitatively, the maximum RMSE of the axial component in two-pass tracking is 0.27 mm compared to 0.47 mm for one-pass tracking, which is close to one ultrasound wavelength (i.e., 0.23 mm). On the other hand, the maximum RMSE of lateral and elevational components are improved from 0.46° and 0.57° to 0.21° and 0.24°, respectively. Note that an angle of 1° in the lateral and elevation direction is a displacement of 1.3 mm and 1.7 mm at a depth of 10.33 cm (indicated in Fig. 1), respectively.
It should also be noted that lateral and elevational displacement errors are larger than axial ones because of the characteristics of the ultrasound beam pattern [37]. In general, the beamwidth in the lateral and elevational directions is larger than the pulse width in the axial direction [37]. Moreover, axial RF signals provide even finer sensitivity by estimating displacement using signal phase [37]. Overall, by averaging the ratio of RMSE between one-pass and two-pass tracking over all frames, improvements by a factor of 1.7, 1.8, and 3 for lateral, elevational, and axial displacement components are clearly demonstrated, respectively.
B. IN VIVO CANINE CARDIAC RESULTS
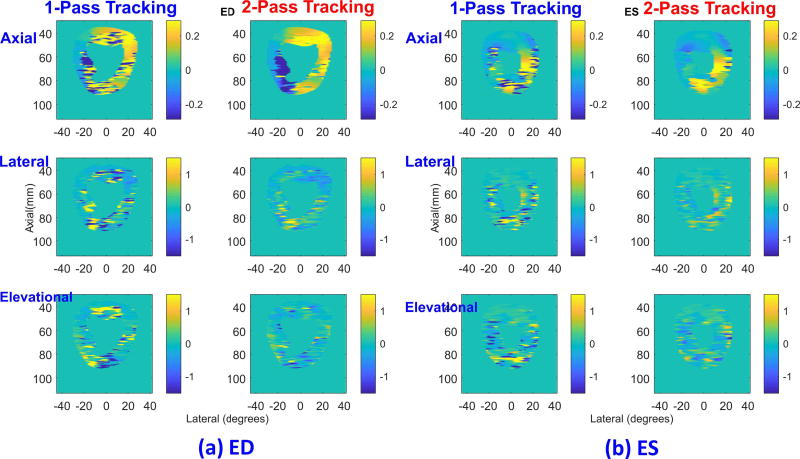
In vivo demonstration of two-pass tracking at ED ((a)) and ES ((b)) is shown in Fig. 9, where results of one-pass tracking (first and third columns) are compared with the results from two-pass tracking (second and fourth columns). The axial (top row), lateral (middle), and elevational (bottom) components are shown with horizontal and vertical axis representing lateral and axial directions, respectively.
Fig. 9.
Comparison of displacement estimates using canine data between one-pass tracking (first column in each figure) and two-pass tracking (second column) at (a) ED and (b) ES. The axial (top row), lateral (middle row), and elevational (bottom row) components are shown. All images have horizontal and vertical axis representing lateral (in degrees) and axial (in mm) directions, respectively. Axial displacements are in units of mm whereas lateral and elevational ones are in degrees.
Even though ground-truth displacements are not available, it is evident that two-pass tracking provides more consistent estimates than those from one-pass tracking. Extensive peak hopping artifacts can be observed at 4, 6, 7, 8, and 12 o’clock for ED and at 3 to 9 o’clock for ES. Two-pass tracking improves all three displacement components. A video is also included in the supplementary file presenting interframe displacement estimates over a complete heart cycle (This will be available at http://ieeexplore.ieee.org). Clearly, two-pass displacement estimates are generally more consistent than one-pass results.
IV. DISCUSSION AND CONCLUSION
The performance of both one-pass and two-pass tracking methods were tested in MATLAB on a Linux computer with a 2.6-GHz CPU and 252.4-GB RAM. The relative computational times of different processing components, including PatchMatch, block search (representing either full search for one-pass tracking or second-pass search for two-pass tracking), correlation filter, subpixel interpolation, and phase zero crossing (the last two are indicated as “others”) are summarized in Table II. The individual processing times are expressed in percentage normalized to the total processing time of one-pass tracking. In addition, the computational load of both tracking methods is evaluated in terms of arithmetic operations, as detailed in Appendix A and summarized in Table III.
TABLE II.
Comparison of Processing Time Between One-Pass and Two-Pass Tracking. Individual Processing Times Including Patchmatch, Block Search, Correlation Filtering, and Others (Subpixel Interpolation and Phase Zero Crossing), Are Expressed in Percentage Relative to Total Processing Time of One-Pass Tracking. Measurements Were Performed With Two Heart Periods at ED + 88 MS (Top, Black) and Es (Bottom, Green).
| PatchMatch | Block search |
Correlation filter |
Others | |
|---|---|---|---|---|
| One-pass tracking | N/A | 82.0 % | 17.1 % | 0.9 % |
| 80.7 % | 18.3 % | 1.0 % | ||
|
| ||||
| Two-pass tracking | 2.3 % | 3.0 % | 4.6 % | 1.8 % |
| 2.2 % | 3.0 % | 4.5 % | 1.8 % | |
TABLE III.
Comparison of Number of Arithmetic Operations (AO) Per Voxel Between One-Pass and Two-Pass Tracking Associated With Patchmatch, Block Search, and Correlation Filtering. Arithmetic Operations of Individual Processing Are Expressed in Percentage Relative to Total Arithmetic Operations of One-Pass Tracking.
| PatchMatch | Block search | Correlation filter |
||
|---|---|---|---|---|
| One-pass tracking | AO | N/A | BlBaBe (9KlKaKe + 3) | 2BlBaBeClCaCe |
| % | N/A | 79.8% | 20.2% | |
| Two-pass tracking | AO | (1 + Ni (1 + Ns)) (9rkKlKaKe + 3) | blbabe (9KlKaKe + 3) | 2blbabeClCaCe |
| % | 2.4% | 2.9% | 0.7% |
Ni is the number of iterations in PatchMatch;
Ns is the number of random searches indicated in Fig. 2d;
KlKaKe are the lateral, axial, and elevational kernel size of one-pass tracking (as well as the second-pass kernel of two-pass tracking), respectively;
rk denotes the ratio of kernel size accounting for a slightly larger one in PatchMatch than in the second pass;
BlBaBe and blbabe are the lateral, axial, and elevational search region size for block matching in one-pass and two-pass tracking, respectively;
ClCaCe are the lateral, axial, and elevational correlation filter size, respectively.
Several observations can be made in comparing Table II with Table III. First, when only search processing (i.e., PatchMatch + block search) is considered, two-pass tracking can improve the processing time by a factor of 15 to 16, in good agreement with a 15-fold reduction in arithmetic operations (presented in Appendix A). Second, two-pass tracking improves not only the search time but the processing time for correlation filtering.
As shown in Table III, the number of arithmetic operations for correlation filtering is reduced from 20.2% to 0.7% due to the smaller search region. The practical improvement in processing time is, however, only a factor of 4 (see Table II) because two-pass tracking involves NCC alignment before correlation filtering, which is image dependent and increases arithmetic operations not considered in Table III. Nonetheless, a 4-fold improvement in the processing time of correlation filtering is still significant.
Third, the computational time of “other” processing, as defined above, is doubled with two-pass tracking. This is mainly due to the increased processing time of subpixel interpolation. As mentioned in Section II-D, subpixel interpolation is based on 3-D second-order polynomial fitting on 27 closest neighbors. In one-pass tracking, however, the possibility of detecting outlier peaks caused by either limited search regions or peak hopping artifacts is much higher than that in two-pass tracking. Consequently, interpolation used 2-D fitting with 9 neighbors and the processing time is reduced. In any event, the measured total computational load with two-pass tracking is 10 times less than that with one-pass tracking. Computations associated with NCC calculations are greatly reduced and comparable to those of correlation filtering. Hence, correlation filtering becomes the time limiting step rather than block matching.
Both simulation and animal results in the heart have demonstrated that the proposed two-pass tracking outperforms traditional one-pass, exhaustive-search 3-D speckle tracking in terms of bias and RMSE. As shown in Fig. 5, even with random initialization, PatchMatch is statistically robust and can improve displacement estimation over exhaustive search without correlation filtering. It should be noted that the results of PatchMatch do not necessarily correspond to the maximum NCC, as is evident in Fig. 3. The propagation step in PatchMatch aligns the motion of adjacent kernels when the underlying kernel cannot find the best match. This step can reduce peak hopping artifacts in the presence of speckle decorrelation.
Further reduction of peak hopping artifacts using correlation filtering has also been demonstrated in Fig. 8. While PatchMatch alone is comparable to one-way tracking with correlation filtering, applying correlation filtering in two-pass tracking can greatly improve estimation. Note that without correlation filtering, block matching in the second pass is inefficient to suppress peak hopping artifacts. Therefore, the main purpose of second-pass block matching is to generate all NCCs required for filtering. Peak hopping suppression is then realized by correlation filtering.
When myocardial deformations are significant, such as at 4 o’clock in Fig. 7, displacement estimates from two pass tracking still must be improved. Since strain rate imaging is based on spatial derivatives of interframe displacements, small displacement errors can lead to large strain misestimates. Our previous work has shown that correlation filtering performs poorly for high strain regions, or regions of high rotational motion, where the true peaks of the NCCs along the axial direction are not aligned at constant lag [48], [50]. Such misalignment may cause phase cancellation between NCCs when applying a constant-lag correlation filter, thus increasing peak hopping artifacts.
Since misalignment is simply related to spatial gradients in the axial displacement, a “tilt” filter following the true peaks can potentially reduce phase cancellation between NCCs within the spatial extent of the correlation filter [48]. We previously proposed an efficient approach using phase rotation to ensure phase alignment at constant lag prior to correlation filtering [48]. The resulting filtered NCC is greatly improved and produces more accurate displacement estimates provided that the axial displacement gradient is known in advance. Using iteration of the initial gradient guess, this algorithm is effective in 2-D motion estimation associated with quasi-static elasticity [48]. In future work, we will show how tilt filtering can be extended to 3-D cardiac imaging using an iteration-free approach to further reduce displacement errors over the methods presented here. Moreover, studies using data from the human heart are required to demonstrate clinically feasibility.
In summary, we have presented an efficient two-pass speckle tracking approach that can improve both computational load and displacement estimation compared to traditional one-pass speckle tracking with exhaustive search. Simulation and in vivo canine results have demonstrated that PatchMatch can efficiently obtain consistent estimates in the first pass. The performance is further improved in the second pass with correlation filtering, producing displacement estimates with a factor of three lower errors. In addition, overall computational load is reduced by a factor of 10 for the parameters used in this study.
With the availability of 2-D transducer arrays and real-time 3-D imaging, there are many potential applications of 3-D motion estimation for clinical problems [65]. In addition to cardiac imaging, it is expected that the 3-D speckle tracking method presented here can also be used for quasi-static elasticity and vector blood flow velocity studies.
Supplementary Material
Acknowledgments
We would like to thank Dr. M. Alessandrini for sharing his synthetic datasets. This work was supported in part by NIH grant RO1 HL121226.
Biographies

Geng-Shi Jeng was born in Tainan, Taiwan. He received the B.S. degree in electronics engineering from National Chiao Tung University in 1996, and the M.S. and Ph.D. degrees from National Taiwan University in 1998 and 2005, respectively, both in electrical engineering. After graduation, he joined the Industrial Technology Research Institute (ITRI) and Coretronic Display Solution Corporation as the Director. In 2011, he joined S-Sharp Corporation and then served as the CTO, where he has developed high-frequency preclinical ultrasound imaging systems, research purposed array imaging systems, and ultrasound reflection tomography. Since 2017, he has become the Visiting Scientist in bioengineering, University of Washington. His interests include designs of real-time ultrasound systems, beamforming, and motion estimation.

Maria Zontak graduated summa cum laude from the Technion - Israeli Institute of Technology with a B.Sc. in Electrical Engineering and a B.A. in Physics (2004). She received a M.Sc. in Electrical Engineering from the Technion in 2008 and Ph.D. in Computer Science from the Weizmann Institute, Israel in 2014.
Her research interests include image processing, low and mid-level computer vision with application to various image modalities, including medical ultrasound images. From 2014 to 2017, she was as a post-doctoral fellow at the Medical Imaging lab in the Bioengineer Department, University of Washington, Seattle, USA. Together with Prof. Matthew O’Donnell, she worked on developing image-processing algorithms for automatic cardio - vascular assessment.
Dr. Zontak received an Israel Council for Higher Education Scholarship “Excellent Female Post-Docs”. She is a member of ACM and currently holds a teaching appointment at the College of Computer and Information Science in the Northeastern University, Seattle Campus.

Nripesh Parajuli received his B.S. in Electrical and Computer Engineering from Lafayette College, Easton, PA. He is a Ph.D. candidate in Electrical Engineering at the Image Processing and Analysis Group (IPAG) at Yale University. He applies graph theoretic and machine learning techniques to cardiac motion tracking and regularization in echocardiography.

Allen Lu received his B.S. in electrical engineering from Rice University, Houston, TX. He is currently a PhD candidate in biomedical engineering at the Image Processing and Analysis Group (IPAG) at Yale University. His research is focused on intelligent regularization of cardiac motion tracking in 3D+time echocardiography.

Kevinminh Ta received his B.S in biomedical engineering from the University of Connecticut, Storrs, CT in 2016. He is currently a PhD student at Yale University and is a member of the Image Processing and Analysis Group under Dr. James Duncan. His research focuses on developing machine learning methods for tracking cardiac motion in 3D+time electrocardiography.

Dr. Sinusas received his undergraduate degree at Rensselaer Polytechnic Institute, and MD degree at University of Vermont, College of Medicine, and trained in internal medicine at University of Oklahoma, and cardiovascular medicine at University of Virginia. He joined the faculty at Yale University in 1990, rising through the ranks to his current position as Professor of Medicine, Radiology and Biomedical Imaging. He currently is Director of Advanced Cardiovascular Imaging, and Director of Yale Translational Research Imaging Center. He directs an NIH training grant in multi-modality molecular and translational cardiovascular imaging, and is principal or key investigator on several NIH grants focused on cardiovascular molecular imaging. At the national level, he is current Chair of the NIH Medical Imaging (MEDI) Study Section. He is on Board of Directors of Intersocietal Accreditation Commission (IAC) Nuclear/PET, and Center for Molecular Imaging Innovation and Translation (CMIIT) of the Society of Nuclear Medicine and Molecular Imaging. His research is directed at development, validation and application of non-invasive cardiovascular imaging approaches for the assessment of cardiovascular pathophysiology, and targeted molecular imaging. He has co-edited a textbook on Cardiovascular Molecular Imaging and Hybrid Imaging in Cardiovascular Medicine.

Dr. James Duncan is the Ebenezer K. Hunt Professor of Biomedical Engineering and a Professor of Radiology & Biomedical Engineering and Electrical Engineering at Yale University. Dr. Duncan received his B.S.E.E. with honors from Lafayette College (1973), and his M.S. (1975) and Ph.D. (1982) both in Electrical Engineering from the University of California, Los Angeles. Dr. Duncan has been a Professor of Diagnostics Radiology and Electrical Engineering at Yale University since 1983. He has been a Professor of Biomedical Engineering at Yale University since 2003, and the Ebenezer K. Hunt Professor of Biomedical Engineering at Yale University since 2007. He has served as the Acting Chair and is currently Director of Undergraduate Studies for Biomedical Engineering. Dr. Duncan’s research efforts have been in the areas of computer vision, image processing, and medical imaging, with an emphasis on biomedical image analysis. He has published over 250 peer-reviewed articles in these areas and has been the principal investigator on a number of peer-reviewed grants from both the National Institutes of Health and the National Science Foundation over the past 30 years. He is a Fellow of the Institute of Electrical and Electronic Engineers (IEEE), of the American Institute for Medical and Biological Engineering (AIMBE) and of the Medical Image Computing and Computer Assisted Intervention (MICCAI) Society. In 2014 he was elected to the Connecticut Academy of Science & Engineering. He has served as co-Editor-in-Chief of Medical Image Analysis, as an Associate Editor of IEEE Transactions on Medical Imaging, and on the editorial board of Pattern Analysis and Applications, Journal of Mathematical Imaging and Vision, and “Modeling in Physiology” The American Physiological Society. He is a past President of the MICCAI Society. In 2012, he was elected to the Council of Distinguished Investigators, Academy of Radiology Research and in 2017 received the “Enduring Impact Award” from the MICCAI Society.

Matthew O’Donnell, Ph.D. Following undergraduate, graduate, and post-doctoral training at Notre Dame and Washington University in St. Louis, Dr. O’Donnell joined General Electric Corporate Research and Development Center in Schenectady, NY in 1980, where he worked on medical electronics, including MRI and ultrasound imaging systems. In 1990, he moved to University of Michigan in Ann Arbor, MI where he held appointments in Electrical Engineering & Computer Science and in Biomedical Engineering. In 1998, he was named the Jerry W. and Carol L. Levin Professor of Engineering. From 1999–2006 he also served as Chair of the Biomedical Engineering Department. In 2006 he moved to the University of Washington in Seattle, WA where he was the Frank and Julie Jungers Dean of Engineering from 2006–2012. He is now Frank and Julie Jungers Dean Emeritus and a Professor of Bioengineering at the University of Washington. His most recent research has explored new imaging modalities, including elasticity imaging, in vivo microscopy, optoacoustic devices, photoacoustic contrast agents for molecular imaging and therapy, laser ultrasound systems, and catheter-based devices. He has won numerous awards, including the Distinguished Alumni Award from the University of Notre Dame, the Achievement and Rayleigh Awards from the IEEE-UFFC Society and the William J. Morlock Award for Excellence in Biomedical Technology from the IEEE-EMBS Society. He is a fellow of the IEEE and AIMBE and is a member of the Washington State Academy of Sciences and the National Academy of Engineering.
APPENDIX A
The reduced computational load of two-pass tracking can be evaluated in terms of arithmetic operations, where summation, subtraction, multiplication, division, and square root operations involved in PatchMatch, block search (representing either full search for one-pass tracking or second-pass search for two-pass tracking), and correlation filtering are considered. Table III compares the number of arithmetic operations per voxel between one-pass and two-pass tracking. Just as in Table I, they are expressed in percentage relative to the total arithmetic operations of one-pass tracking.
References
- 1.Kasai C, Namekawa K, Koyano A, Omoto R. Real-time two-dimensional blood flow imaging using an autocorrelation technique. IEEE Trans. Sonics Ultrason. 1985;SU-32:458–464. [Google Scholar]
- 2.Loupas T, Powers JT, Gill RW. An axial velocity estimator for ultrasound blood flow imaging, based on a full evaluation of the Doppler equation by means of a two-dimensional autocorrelation approach. IEEE Trans. Ultrason., Ferroelect., Freq. Contr. 1995;42(4):672–688. [Google Scholar]
- 3.Ophir J, Cespedes I, Ponnekanti H, Yazdi Y, Li X. Elastography: A quantitative method for imaging the elasticity of biological tissues. Ultrason. Imaging. 1991;13(2):111–134. doi: 10.1177/016173469101300201. [DOI] [PubMed] [Google Scholar]
- 4.Gao L, Parker KJ, Lerner RM, Levinson SF. Imaging of the elastic properties of tissue–A review. Ultrasound Med. Biol. 1996;22(8):959–977. doi: 10.1016/s0301-5629(96)00120-2. [DOI] [PubMed] [Google Scholar]
- 5.O’Donnell M, Skovoroda AR, Shapo BM, Emelianov SY. Internal displacement and strain imaging using ultrasonic speckle tracking. IEEE Trans. Ultrason. Ferroelectr. Freq. Control. 1994;41(3):314–325. [Google Scholar]
- 6.Sarvazyan AP, Redenko OV, Swanson SD, Fowlkers JB, Emelianov EY. Shear wave elasticity imaging: A new ultrasonic technology of medical diagnostics. Ultrasound Med. Biol. 1998;24:1419–1435. doi: 10.1016/s0301-5629(98)00110-0. [DOI] [PubMed] [Google Scholar]
- 7.Bercoff J, Tanter M, Fink M. Supersonic shear imaging: A new technique for soft tissues elasticity mapping. IEEE Trans. Ultrason, Ferroelectr. Freq. Control. 2004;51(4):396–409. doi: 10.1109/tuffc.2004.1295425. [DOI] [PubMed] [Google Scholar]
- 8.Tanter M, Bercoff J, Athanasiou A, Deffieux T, Gennisson J-L, Montaldo G, Muller1 M, Tardivon A, Fink M. Quantitative assessment of breast lesion elasticity: Initial clinical results using supersonic shear imaging. Ultrasound Med. Biol. 2008;34(9):1373–1386. doi: 10.1016/j.ultrasmedbio.2008.02.002. [DOI] [PubMed] [Google Scholar]
- 9.Ledesma-Carbayo MJ, Kybic J, Desco M, Santos A, Suhling M, Hunziker P, Unser M. Spatio-temporal nonrigid registration for ultrasound cardiac motion estimation. IEEE Trans. Med. Imag. 2005;24(9):1113–1126. doi: 10.1109/TMI.2005.852050. [DOI] [PubMed] [Google Scholar]
- 10.Lin N, Duncan J. Generalized robust point matching using an extended free-form deformation model: Application to cardiac images; Proc. 2004 IEEE Int. Symp. Biomed. Imag.: From Nano to Macro; 2004. pp. 320–323. [Google Scholar]
- 11.Mukherjee R, Sprouse C, Pinheiro A, Abraham T, Burlina P. Computing myocardial motion in 4-dimensional echocardiography. Ultrasound Med. Biol. 2012;38(7):1284–1297. doi: 10.1016/j.ultrasmedbio.2012.03.007. [DOI] [PMC free article] [PubMed] [Google Scholar]
- 12.Queir’os S, Vilaca JL, Morais P, Fonseca JC, D’hooge J, Barbosa D. Fast left ventricle tracking in CMR images using localized anatomical affine optical flow. Proc. SPIE Medical Imaging. 2015;9413:941, 306–941, 306–7. [Google Scholar]
- 13.Barbosa D, Dietenbeck T, Heyde B, Houle H, Friboulet D, D’hooge J, Bernard O. Fast and fully automatic 3-d echocardiographic segmentation using b-spline explicit active surfaces: Feasibility study and validation in a clinical setting. Ultrasound Med. Biol. 2013;39(1):89–101. doi: 10.1016/j.ultrasmedbio.2012.08.008. [DOI] [PubMed] [Google Scholar]
- 14.Somphone O, De Craene M, Ardon R, Mory B, Allain P, Gao H, D’hooge J, Marchesseau S, Sermesant M, Delingette H, Saloux E. Fast myocardial motion and strain estimation in 3D cardiac ultrasound with sparse demons. Biomedical Imaging (ISBI) 2013 [Google Scholar]
- 15.Heyde B, Alessandrini M, Hermans J, Barbosa D, Claus P, D’hooge J. Anatomical image registration using volume conservation to assess cardiac deformation from 3d ultrasound recordings. IEEE Trans. Med. Imaging. 2016;35(2):501–511. doi: 10.1109/TMI.2015.2479556. [DOI] [PubMed] [Google Scholar]
- 16.Elen A, Choi HF, Loeckx D, Gao H, Claus P, Suetens P, Maes F, D’hooge J. Three dimensional cardiac strain estimation using spatiotemporal elastic registration of ultrasound images: a feasibility study. IEEE Trans. Med. Imaging. 2008;27(11):1580–1591. doi: 10.1109/TMI.2008.2004420. [DOI] [PubMed] [Google Scholar]
- 17.Leung KY, van Stralen M, Nemes A, Voormolen MM, van Burken G, Geleijnse ML, Ten Cate FJ, Reiber JH, de Jong N, van der Steen AF, Bosch JG. Sparse registration for three-dimensional stress echocardiography. IEEE Trans. Med. Imaging. 2008;27(11):1568–1579. doi: 10.1109/TMI.2008.922685. [DOI] [PubMed] [Google Scholar]
- 18.Heyde B, Bouchez S, Thieren S, Vandenheuvel M, Jasaityte R, Barbosa D, Claus P, Maes F, Wouters P, D’Hooge J. Elastic image registration to quantify 3-D regional myocardial deformation from volumetric ultrasound: experimental validation in an animal model. Ultrasound Med. Biol. 2013;39(9):1688–1697. doi: 10.1016/j.ultrasmedbio.2013.02.463. [DOI] [PubMed] [Google Scholar]
- 19.Jensen JA. Estimation of Blood Velocities Using Ultrasound: A Signal Processing Approach. New York: Cambridge Univ. Press; 1996. [Google Scholar]
- 20.Sutherland GR, Stewart MJ, Groundstroem KWE. Color Doppler myocardial imaging: A new technique for assessment of myocardial function. J. Am. Soc. Echocardiogr. 1994 Sep-Oct;7:441–458. doi: 10.1016/s0894-7317(14)80001-1. [DOI] [PubMed] [Google Scholar]
- 21.Kanai H, Koiwa Y, Zhang JP. Real-time measurements of local myocardium motion and arterial wall thickening. IEEE Trans. Ultrason. Ferroelectr. Freq. Control. 1999 Sep.46(5):1229–1241. doi: 10.1109/58.796128. [DOI] [PubMed] [Google Scholar]
- 22.Kaluzynski K, Chen X, Emelianov SY, Skovoroda AR, O’Donnell M. Strain rate imaging using two-dimensional speckle tracking. IEEE Trans. Ultrason. Ferroelectr. Freq. Control. 2001;48(4):1111–1123. doi: 10.1109/58.935730. [DOI] [PubMed] [Google Scholar]
- 23.Serri K, Reant P, Lafitte M, Berhouet M, Le Bouffos V, Roudaut R, Lafitte S. Global and regional myocardial function quantification by two-dimensional strain: application in hypertrophic cardiomyopathy. J. Am. Coll. Cardiol. 2006;47:1175–81. doi: 10.1016/j.jacc.2005.10.061. [DOI] [PubMed] [Google Scholar]
- 24.D’hooge J, Konofagou E, Jamal F, Heimdal A, Barrios L, Bijnens B, Thoen J, Van de Werf F, Sutherland G, Suetens P. Two dimensional ultrasonic strain rate measurement of the human heart in vivo. IEEE Trans. Ultrason., Ferroelec, Freq. Contr. 2002;49(2):281–286. doi: 10.1109/58.985712. [DOI] [PubMed] [Google Scholar]
- 25.Jia C, Olafsson R, Huang SW, Kolias TJ, Kim K, Rubin JM, Xie H, O’Donnell M. Comparison of 2-D speckle tracking and tissue Doppler imaging in an isolated rabbit heart model. IEEE Trans. Ultrason. Ferroelectr. Freq. Control. 2010;57(11):2491–2502. doi: 10.1109/TUFFC.2010.1715. [DOI] [PubMed] [Google Scholar]
- 26.Trahey GE, Allison JW, Ramm OTV. Angle independent ultrasonic flow detection of blood flow. IEEE Trans. Biomed. Eng. 1987;BME-34(12):965–967. doi: 10.1109/tbme.1987.325938. [DOI] [PubMed] [Google Scholar]
- 27.Bohs LN, Geiman BJ, Anderson ME, Breit SM, Trahey GE. Ensemble tracking for 2d vector velocity measurement: Experimental and initial clinical results. IEEE Trans. Ultrason. Ferroelectr. Freq. Control. 1998;45(4):912–924. doi: 10.1109/58.710557. [DOI] [PubMed] [Google Scholar]
- 28.Lubinski MA, Emelianov SY, O’Donnell M. Speckle tracking methods for ultrasonic elasticity imaging using short-time correlation. IEEE Trans. Ultrason. Ferroelectr. Freq. Control. 1999;46(1):82–96. doi: 10.1109/58.741427. [DOI] [PubMed] [Google Scholar]
- 29.Viola F, Walker WF. A comparison of the performance of time-delay estimators in medical ultrasound. IEEE Trans. Ultrason. Ferroelectr. Freq. Control. 2003;50:392–401. doi: 10.1109/tuffc.2003.1197962. [DOI] [PubMed] [Google Scholar]
- 30.Konofagou EE, D’hooge J, Ophir J. Myocardial elastography—A feasibility study in vivo. Ultrasound Med. Biol. 2002;28(4):475–482. doi: 10.1016/s0301-5629(02)00488-x. [DOI] [PubMed] [Google Scholar]
- 31.D’hooge J, Bijnens B, Thoen J, Van de Werf F, Sutherland GR, Suetens P. Echocardiographic strain and strain-rate imaging: a new tool to study regional myocardial function. IEEE Trans. Med. Imaging. 2002;21(9):1022–30. doi: 10.1109/TMI.2002.804440. [DOI] [PubMed] [Google Scholar]
- 32.Mofid Y, Ossant F, Imberdis C, Josse G, Patat F. In-vivo imaging of skin under stress: Potential of high-frequency (20 MHz) static 2-D elastography. IEEE Trans. Ultrason. Ferroelectr. Freq. Control. 2006;53(5):925–935. doi: 10.1109/tuffc.2006.1632683. [DOI] [PubMed] [Google Scholar]
- 33.Hanekom L, Jenkins C, Jeffries L, Case C, Mundy J, Hawley C, Marwick TH. Incremental value of strain rate analysis as an adjunct to wall-motion scoring for assessment of myocardial viability by dobutamine echocardiography: a follow-up study after revascularization. Circulation. 2005;112(25):3892–900. doi: 10.1161/CIRCULATIONAHA.104.489310. [DOI] [PubMed] [Google Scholar]
- 34.Weidemann F, Dommke C, Bijnens B, Claus P, D’hooge J, Mertens P, Verbeken E, Maes A, Van de Werf F, De Scheerder I, Sutherland GR. Defining the transmurality of a chronic myocardial infarction by ultrasonic strain-rate imaging: implications for identifying intramural viability: an experimental study. Circulation. 2003;107(6):883–888. doi: 10.1161/01.cir.0000050146.66577.4b. [DOI] [PubMed] [Google Scholar]
- 35.Hung CL, Verma A, Uno H, Shin SH, Bourgoun M, Hassanein AH, McMurray JJ, Velazquez EJ, Kober L, Pfeffer MA, Solomon SD VALIANT investigators. Longitudinal and circumferential strain rate, left ventricular remodeling, and prognosis after myocardial infarction. J. Am. Coll. Cardiol. 2010;56(22):1812–22. doi: 10.1016/j.jacc.2010.06.044. [DOI] [PubMed] [Google Scholar]
- 36.Farsalinos KE, Daraban AM, Ünlü S, Thomas JD, Badano LP, Voigt J-U. Head-to-head comparison of global longitudinal strain measurements among nine different vendors: The EACVI/ASE intervendor comparison study. J. Amer. Soc. Echocardiogr. 2015;28(10):1171–1181. doi: 10.1016/j.echo.2015.06.011. [DOI] [PubMed] [Google Scholar]
- 37.Chen X, Xie H, Erkamp R, Kim K, Jia C, Rubin JM, O’Donnell M. 3-D correlation based speckle tracking. Ultrason. Imaging. 2005;27(1):21–36. doi: 10.1177/016173460502700102. [DOI] [PubMed] [Google Scholar]
- 38.Jasaityte R, Heyde B, D’hooge J. Current state of three dimensional myocardial strain estimation using echocardiography. J Am Soc Echocardiogr. 2013;26(1):15–28. doi: 10.1016/j.echo.2012.10.005. [DOI] [PubMed] [Google Scholar]
- 39.Seo Y, Ishizu T, Enomoto Y, Sugimori H, Yamamoto M, Machino T, Kawamura R, Aonuma K. Validation of 3-dimensional speckle tracking imaging to quantify regional myocardial deformation. Circ. Cardiovasc. Imaging. 2009;2(6):451–459. doi: 10.1161/CIRCIMAGING.109.858480. [DOI] [PubMed] [Google Scholar]
- 40.Andrade J, Cortez LD, Campos O, Arruda AL, Pinheiro J, Vulcanis L, Shiratsuchi TS, Kalil-Filho R, Cerri GG. Left ventricular twist: comparison between two and three-dimensional speckle-tracking echocardiography in healthy volunteers. Eur. J. Echocardiogr. 2011;12(1):76–79. doi: 10.1093/ejechocard/jeq111. [DOI] [PubMed] [Google Scholar]
- 41.Jia C, Kim K, Kolias TJ, Rubin JM, Weitzel WF, Yan P, Dione D, Sinusas AJ, Duncan J, O’Donnell M. 4D Elasticity imaging of PVA LV phantom integrated with pulsatile circulation system using 2D phased array; Proc. IEEE Ultrason. Symp; 2007. pp. 876–879. [Google Scholar]
- 42.Duan Q, Angelini ED, Herz SL, Ingrassia CM, Costa KD, Holmes JW, Homma S, Laine AF. Region-based endocardium tracking on real-time three-dimensional ultrasound. Ultrasound in Medicine & Biology. 2009;35(2):256–265. doi: 10.1016/j.ultrasmedbio.2008.08.012. [DOI] [PMC free article] [PubMed] [Google Scholar]
- 43.Crosby J, Amundsen BH, Hergum T, Remme EW, Langeland S, Torp H. 3-D speckle tracking for assessment of regional left ventricular function. Ultrasound in Medicine & Biology. 2009;35(3):458–471. doi: 10.1016/j.ultrasmedbio.2008.09.011. [DOI] [PubMed] [Google Scholar]
- 44.Lopata RG, Nillesen MM, Thijssen JM, Kapusta L, de Korte CL. Three-dimensional cardiac strain imaging in healthy children using RF-data. Ultrasound in Medicine & Biology. 2011;37(9):1399–1408. doi: 10.1016/j.ultrasmedbio.2011.05.845. [DOI] [PubMed] [Google Scholar]
- 45.Compas CB, Wong EY, Huang X, Sampath S, Lin BA, Pal P, Papademetris X, Thiele K, Dione DP, Stacy M, Staib LH, Sinusas AJ, O’Donnell M, Duncan JS. Radial Basis Functions for Combining Shape and Speckle Tracking in 4D Echocardiography. IEEE Trans. Med. Imaging. 2014;33(6):1275–1289. doi: 10.1109/TMI.2014.2308894. [DOI] [PMC free article] [PubMed] [Google Scholar]
- 46.Luo J, Konofagou EE. A fast normalized cross-correlation calculation method for motion estimation. IEEE Trans. Ultrason. Ferroelectr. Freq. Control. 2010;57(6):1347–1357. doi: 10.1109/TUFFC.2010.1554. [DOI] [PMC free article] [PubMed] [Google Scholar]
- 47.Alessandrini M, Heyde B, Queirós S, Cygan S, Zontak M, Somphone O, De Craene M, O’Donnell M, D’hooge J. Detailed Evaluation of Five 3D Speckle Tracking Algorithms using Synthetic Echocardiographic Recordings. IEEE Trans. Med. Imaging. 2016;35(2):1915–1926. doi: 10.1109/TMI.2016.2537848. [DOI] [PubMed] [Google Scholar]
- 48.Huang L, Petrank Y, Huang SW, Jia C, O’Donnell M. Phase rotation methods in filtering correlation coefficients for ultrasound speckle tracking. IEEE Trans. Ultrason. Ferroelectr. Freq. Control. 2009;56(7):1368–1382. doi: 10.1109/TUFFC.2009.1193. [DOI] [PMC free article] [PubMed] [Google Scholar]
- 49.Friemel BH, Bohs LN, Nightingale KR, Trahey GE. Speckle decorrelation due to two-dimensional flow gradients. IEEE Trans. Ultrason. Ferroelectr. Freq. Control. 1998;45(2):317–327. doi: 10.1109/58.660142. [DOI] [PubMed] [Google Scholar]
- 50.Petrank Y, Huang L, O’Donnell M. Reduced peak-hopping artifacts in ultrasonic strain estimation using the Viterbi algorithm. IEEE Trans. Ultrason. Ferroelectr. Freq. Control. 2009;56(7):1359–1367. doi: 10.1109/TUFFC.2009.1192. [DOI] [PubMed] [Google Scholar]
- 51.Huang SW, Rubin JM, Xie H, Witte RS, Jia C, Olafsson R, O’Donnell M. Analysis of Correlation Coefficient Filtering in Elasticity Imaging. IEEE Trans. Ultrason. Ferroelectr. Freq. Control. 2008;55(11):2426–2441. doi: 10.1109/TUFFC.950. [DOI] [PubMed] [Google Scholar]
- 52.Skovoroda AR, Lubinski LA, Emelianov SY, O’Donnell M. Reconstructive elasticity imaging for large deformations. IEEE Trans. Ultrason. Ferroelectr. Freq. Control. 1999;46(3):523–535. doi: 10.1109/58.764839. [DOI] [PubMed] [Google Scholar]
- 53.Zhu Y, Hall TJ. A modified block matching method for real-time freehand strain imaging. Ultrason. Imaging. 2002;24(3):161–176. doi: 10.1177/016173460202400303. [DOI] [PubMed] [Google Scholar]
- 54.Jiang J, Hall TJ. A parallelizable real-time motion tracking algorithm with applications to ultrasonic strain imaging. Phys. Med. Biol. 2007;52(13):3773–3790. doi: 10.1088/0031-9155/52/13/008. [DOI] [PubMed] [Google Scholar]
- 55.Pellot-Barakat C, Frouin F, Insana MF, Herment A. Ultrasound elastography based on multiscale estimations of regularized displacement fields. IEEE Trans. Med. Imaging. 2004;23(2):153–163. doi: 10.1109/TMI.2003.822825. [DOI] [PMC free article] [PubMed] [Google Scholar]
- 56.Barnes C, Shechtman E, Finkelstein A, Goldman D. PatchMatch: A randomized correspondence algorithm for structural image editing. ACM Trans. Graph. 2009;28(3):24. [Google Scholar]
- 57.Barnes C, Shechtman E, Goldman DB, Finkelstein A. The generalized PatchMatch correspondence algorithm. Proc. ECCV. 2010:29–43.111. [Google Scholar]
- 58.Shi W, et al. Cardiac image super-resolution with global correspondence using multi-atlas PatchMatch. Proc. MICCAI. 2013:9–16. doi: 10.1007/978-3-642-40760-4_2. [DOI] [PubMed] [Google Scholar]
- 59.Coupé P, Manjón JV, Fonov V, Pruessner J, Robles M, Collins DL. Patch-based segmentation using expert priors: Application to hippocampus and ventricle segmentation. NeuroImage. 2011;54(2):940–954. doi: 10.1016/j.neuroimage.2010.09.018. [DOI] [PubMed] [Google Scholar]
- 60.Zontak M, O’Donnell M. Speeding up 3D speckle tracking using PatchMatch. Proc. SPIE Medical Imaging: Image Processing. 2016:97843W. [Google Scholar]
- 61.Alessandrini M, De Craene M, Bernard O, Giffard-Roisin S, Allain P, Waechter-Stehle I, Weese J, Saloux E, Delingette H, Sermesant M, D’hooge J. A pipeline for the generation of realistic 3D synthetic echocardiographic sequences: Methodology and open-access database. IEEE Trans. Med. Imaging. 2015;34(7):1436–1451. doi: 10.1109/TMI.2015.2396632. [DOI] [PubMed] [Google Scholar]
- 62.Marchesseau S, Delingette H, Sermesant M, Sorine M, Rhode K, Duckett S, Rinaldi C, Razavi R, Ayache N. Preliminary specificity study of the Bestel-Clement-Sorine electromechanical model of the heart using parameter calibration from medical images. J. Mech. Behav. Biomed. Mater. 2013;20:259–271. doi: 10.1016/j.jmbbm.2012.11.021. [DOI] [PubMed] [Google Scholar]
- 63.Gao H, Choi HF, Claus P, Boonen S, Jaecques S, Van Lenthe G, Van der Perre G, Lauriks W, D’hooge J. A fast convolution based methodology to simulate 2D/3D cardiac ultrasound images. IEEE Trans. Ultrason. Ferroelectr. Freq. Control. 2009;56(2):404–409. doi: 10.1109/TUFFC.2009.1051. [DOI] [PubMed] [Google Scholar]
- 64.Huang X, Dione DP, Compas CB, Papademetris X, Lin BA, Bregasi A, Sinusas AJ, Staib LH, Duncan JS. Contour tracking in echocardiographic sequences via sparse representation and dictionary learning. Med. Image. Anal. 2014;18(2):253–71. doi: 10.1016/j.media.2013.10.012. [DOI] [PMC free article] [PubMed] [Google Scholar]
- 65.Bo Peng, Wang Yuqi, Hall Timothy J, Jiang Jingfeng. A GPU-Accelerated 3-D Coupled Subsample Estimation Algorithm for Volumetric Breast Strain Elastography. IEEE Trans. Ultrason. Ferroelectr. Freq. Control. 2017;64(4):694–705. doi: 10.1109/TUFFC.2017.2661821. [DOI] [PMC free article] [PubMed] [Google Scholar]
Associated Data
This section collects any data citations, data availability statements, or supplementary materials included in this article.


