

Abstract
Transporter-mediated drug-drug interactions (DDIs) are a major cause of drug toxicities. Using published genomewide association studies (GWAS) of the human metabolome, we identified 20 metabolites associated with genetic variants in OATP1B1 (p<5×10⁻⁸). Of these, 12 metabolites were significantly higher in plasma samples from volunteers dosed with the OATP1B1 inhibitor, cyclosporine, CSA, versus placebo (q-value<0.2). Conjugated bile acids and fatty acid dicarboxylates were among the metabolites discovered using both GWAS and CSA administration. In vitro studies confirmed tetradecanedioate (TDA) and hexadecanedioate (HDA) were novel substrates of OATP1B1 as well as OAT1 and OAT3. This study highlights the use of multiple datasets for the discovery of endogenous metabolites that represent potential in vivo biomarkers for transporter-mediated DDIs. Future studies are needed to determine whether these metabolites can serve as qualified biomarkers for organic anion transporters. Quantitative relationships between metabolite levels and modulation of transporters should be established.
Introduction
Inhibition or induction of transporters in the liver, kidney, and intestine can result in clinical drug-drug interactions (DDIs). To predict whether a DDI is likely to occur and whether a specific clinical study is warranted, the U.S. Food and Drug Administration (FDA), the European Medical Agency (EMA) andf Japan Pharmaceuticals and Medical Devices Agency (PMDA) have issued guidances that include a set of criteria based on cellular assays of drug transporter interactions1-3. Though in general, in vitro cellular assays are good predictors of clinical DDIs, they are fairly conservative, erring on the side of excess false positives over false negatives. Endogenous metabolites that are selective substrates for one or a few drug transporters could be used during early clinical trials as biomarkers for potential clinical DDIs. These biomarkers could supplement in vitro studies, and may reduce false positives from in vitro studies, as well as the costs and time required for clinical development.
For example, creatinine is a substrate of several organic cation and anion transporters in the kidney including Organic Cation Transporter 2, OCT2 (SLC22A2), Multi-drug and Toxin Extrusion protein 1, MATE1 (SLC47A1) and Organic Anion Transporter 2 (OAT2, SLC22A7)4,5. A pharmaceutical agent that inhibits one or more of these transporters may cause an increase in serum creatinine levels4,6. Thus, though not ideal because it is also a biomarker of kidney dysfunction, creatinine was suggested as a biomarker for renal transporter-mediated DDIs. Several more promising metabolites have been discovered in studies of transporter knockout mice and/or clinical studies of selected transporter-mediated drug-drug interactions. Examples include 6β-hydroxycortisol, N-methylnicotinamide, and bilirubin glucuronide, which are proposed as potential biomarkers of OAT3, MATE1/MATE2 and OATP1B1/OATP1B3/MRP2 respectively7-9. To date, there has been no systematic study to identify endogenous biomarkers of transporter-mediated DDIs.
The goal of this study was to identify endogenous metabolites for OATP1B1, which could serve as biomarkers of potential OATP1B1-mediated DDIs. Such metabolites, could also provide valuable information about the biological function of the transporter. OATP1B1, a liver organic anion transporter, has been recognized by the International Transporter Consortium (ITC) and the FDA and EMA as an important protein in mediating DDIs10. Using data available from genomewide association studies (GWAS) and clinical samples from a DDI study between pravastatin and cyclosporine (CSA), we discovered 12 metabolites that significantly associated with genetic variants in OATP1B1 and exhibited increased plasma levels after administration of CSA, an inhibitor of OATP1B1. Following this multi-tiered approach, several of the 12 metabolites were found to be inhibitors or substrates of OATP1B1 in cell lines overexpressing the transporters (Figure 1). Collectively, our multi-scale approach resulted in the identification of endogenous metabolites, which represent promising candidate biomarkers of DDIs mediated by OATP1B1.
Figure 1.
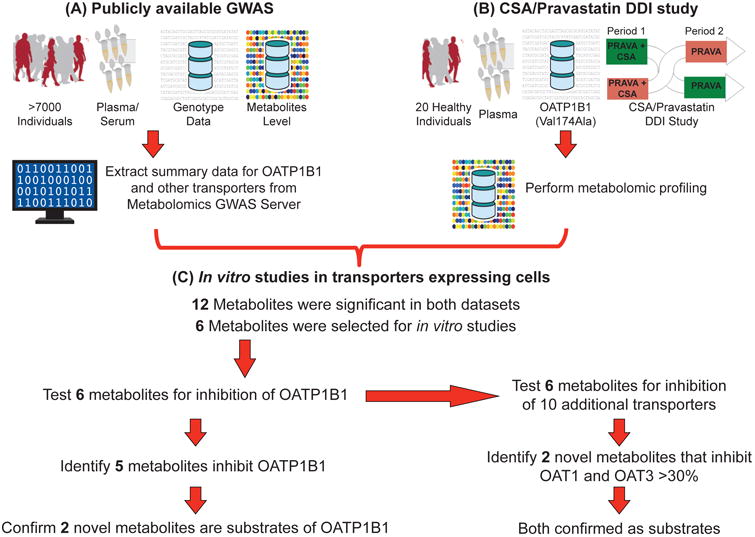
Schematic of the workflow applied to discovery and functional studies for identification of endogenous biomarkers for OATP1B1. This multi-scale approach includes (A) using publicly available genomewide association studies for human metabolites, (B) performing metabolomic profiling of a cyclosporine (CSA)/pravastatin drug-drug interaction (DDI) study, and (C) conducting in vitro studies in transporters expressing cells. SNPs within 25,000 bp up and downstream of 390 SLC transporter genes were associated with 529 metabolites. In addition, plasma samples from 20 healthy volunteers taken from a CSA/pravastatin randomized crossover DDI study were used to profile metabolite levels. Twelve metabolites were significant in both datasets (see Results section). Transporter uptake and inhibition studies were performed to determine whether the selected six metabolites were inhibitors and/or substrates of OATP1B1 and ten other selected transporters.
Results
GWAS from publicly available sources revealed novel endogenous metabolites for SLC transporters
The Metabolomics GWAS Server (http://mips.helmholtz-muenchen.de/proj/GWAS/gwas/index.php) allows access to genomewide summary statistics for explorations of genetic loci influencing 529 human metabolites in up to 7824 adult individuals from 2 European ancestry cohorts11,12. Supplemental Table 1 shows associations, with p-values < 0.0001, for all the metabolites significantly associated with the SNPs in SLC transporters. From the 390 SLC transporters extracted, 312 transporters were associated with at least one metabolite with p-values < 0.0001. Several metabolites, which are known substrates of the SLC transporters, showed significant association with the SNPs within or near transporter genes (Table 1). In addition, the association analyses showed many novel metabolites that have not been previously reported to be associated with particular transporters. For example, SLC2A9, a uric acid transporter13, which also transports fructose14, was strongly associated with plasma histidine levels in addition to uric acid levels. A second example is SLC5A6, a multi-vitamin transporter15, which was strongly associated with plasma mannose levels. Table 1 highlights the 41 SLC transporters that have at least one metabolite associated with it at genomewide significance (p<5×10⁻⁸).
Table 1.
Metabolites that are significantly associated with at least one genetic variant in the 41 SLC or SLCO transporters with p<5×10⁻⁸. The data were extracted from the Metabolome GWAS Server <http://mips.helmholtz-muenchen.de/proj/GWAS/gwas/index.php?task=download> and the data were from two genomewide association studies10,11. Metabolites that are known substrates of the associated transporter or are significantly associated with the transporter in other human metabolome GWAS are underlined. See table footnote for further information.
| Chr | SLC/SLCO Transporters | Metabolites | References (see footnote) |
|---|---|---|---|
| 4 | SLC2A9 | urate, histidine | [1]a |
| 16 | SLC5A11 | myo-inositol, scyllo-inositol | [2,3]a |
| 2 | SLC5A6, SLC30A3 | pantothenate, mannose | [4]b |
| 12 | SLC6A12, SLC6A13 | betaine, pyroglutamine, X-11334 | [5]a [6]b |
| 3 | SLC6A20 | pyroglutamine, X-11315 | |
| 16 | SLC7A5 | kynurenine, X-12100 | [7]b |
| 16 | SLC7A6 | lysine, glutaroyl carnitine | [3,8]a |
| 19 | SLC7A9 | Homocitrulline, X-12092 | |
| 13 | SLC10A2 | X-12850 | |
| 2 | SLC11A1 | carnitine | |
| 17 | SLC13A5 | citrate | [9]b |
| 17 | SLC16A3 | 3-(4-hydroxyphenyl)lactate, malate | |
| 10 | SLC16A9 | acetylcarnitine, butyrylcarnitine, carnitine, hexanolycarnitine, propionylcarnitine, X-11261, X-11381, X-12798, X-12855 | [3,7,8]a |
| 6 | SLC16A10 | gamma-glutamyltyrosine, tryptophan, tyrosine | [7]b |
| 17 | SLC16A13 | X-12441 | |
| 6 | SLC17A1/SLC17A3/SLC17A4 loci | 3-carboxy-4-methyl-5-propyl-2-furanpropanoate (CMPF), 4-androsten-3beta,17beta-diol disulfate 2*, X-02269, X-09789, X-11469, X-12510, X-12798 | |
| 6 | SLC22A1 | isobutyrylcarnitine, 2-methylbutyroylcarnitine, propionylcarnitine, X-12798, X-03056, X-11261 | [8]a |
| 6 | SLC22A2 | N1-methyladenosine, 3-dehydrocarnitine, X-12798 | |
| 6 | SLC22A3 | X-12798 | |
| 5 | SLC22A4, SLC22A5 loci | acetylcarnitine, carnitine, isovalerylcarnitine, 3-dehydrocarnitine, butyrylcarnitine, glutaroyl carnitine, hexanoylcarnitine, hydroxyisovaleroyl carnitine, tryptophan betaine, oleoylcarnitine, palmitoylcarnitine, propionylcarnitine, stearoylcarnitine | [7,8]a |
| 20 | SLC24A3 | X-12712 | |
| 22 | SLC25A1 | citrate | [10]b |
| 17 | SLC25A11 | X-03056 | |
| 2 | SLC30A6 | X-11444 | |
| 5 | SLC34A1 | bradykinin,des-arg(9), ADSGEGDFXAEGGGVR, X-11792 | |
| 12 | SLC38A4 | alanine, carnitine | [11]b |
| 16 | SLC38A7 | Phenyllactate (PLA) | |
| 6 | SLC44A4 | X-11470 | |
| 1 | SLC44A5 | cis-4-decenoyl carnitine, decanoylcarnitine, hexanoylcarnitine, octanoylcarnitine | |
| 3 | SLC51A, SLC51B | X-09789 | |
| 17 | SLC52A1, SLC52A2 | X-03056 | |
| 12 | SLCO1B1, SLCO1A2, SLCO1B3 loci | 1-arachidonoylglycerophosphoethanolamine#, 1-arachidonoylglycerophosphoinositol#, 4-androsten-3beta,17beta-diol-disulfate 2*, 5alpha-androstan-3beta,17beta-diol-disulfate, hexadecanedioate, octadecanedioate, tetradecanedioate, X-02269, X-11445, X-11469, X-11491, X-11529, X-11538, X-11905, X-12063, X-12456, X-13429, X-14626, X-14662, X-18601 | [8]a |
Note:
References referring to genetic association studies with human metabolites levels.
References referring to in vitro studies supporting the metabolite as a substrate of the transporter.
This is not the same metabolite as reported by Rhee et al. [7], however, the study found significant association of a different subspecies of lysolipids.
The sulfated species could be in different site and the exact location may not be known. In this table, the 2* sulfated species are on different parts of the molecule from the 1*.
References
Vitart V, Rudan I, Hayward C, Gray NK, Floyd J, et al. (2008) SLC2A9 is a newly identified urate transporter influencing serum urate concentration, urate excretion and gout. Nat Genet 40: 437-442.
Raffler J, Friedrich N, Arnold M, Kacprowski T, Rueedi R, et al. (2015) Genome-Wide Association Study with Targeted and Non-targeted NMR Metabolomics Identifies 15 Novel Loci of Urinary Human Metabolic Individuality. PLoS Genet 11: e1005487.
Demirkan A, Henneman P, Verhoeven A, Dharuri H, Amin N, et al. (2015) Insight in genome-wide association of metabolite quantitative traits by exome sequence analyses. PLoS Genet 11: e1004835.
de Carvalho FD, Quick M (2011) Surprising substrate versatility in SLC5A6: Na+-coupled I- transport by the human Na+/multivitamin transporter (hSMVT). J Biol Chem 286: 131-137.
Xie W, Wood AR, Lyssenko V, Weedon MN, Knowles JW, et al. (2013) Genetic variants associated with glycine metabolism and their role in insulin sensitivity and type 2 diabetes. Diabetes 62: 2141-2150.
Pramod AB, Foster J, Carvelli L, Henry LK (2013) SLC6 transporters: structure, function, regulation, disease association and therapeutics. Mol Aspects Med 34: 197-219.
Rhee EP, Ho JE, Chen MH, Shen D, Cheng S, et al. (2013) A genome-wide association study of the human metabolome in a community-based cohort. Cell Metab 18: 130-143.
Suhre K, Shin SY, Petersen AK, Mohney RP, Meredith D, et al. (2011) Human metabolic individuality in biomedical and pharmaceutical research. Nature 477: 54-60.
Inoue K, Fei YJ, Zhuang L, Gopal E, Miyauchi S, et al. (2004) Functional features and genomic organization of mouse NaCT, a sodium-coupled transporter for tricarboxylic acid cycle intermediates. Biochem J 378: 949-957.
Palmieri F (2013) The mitochondrial transporter family SLC25: identification, properties and physiopathology. Mol Aspects Med 34: 465-484.
Schioth HB, Roshanbin S, Hagglund MG, Fredriksson R (2013) Evolutionary origin of amino acid transporter families SLC32, SLC36 and SLC38 and physiological, pathological and therapeutic aspects. Mol Aspects Med 34: 571-585.
OATP1B1 non-synonymous variant, Val174Ala (c.521T>C, rs4149056), was associated with higher plasma levels of fatty acid dicarboxylic acids
The functional variant of OATP1B1, OATP1B1-Val174Ala (rs4149056), was significantly associated with 20 endogenous metabolites (Table 1, Supplemental Table 2) in the genomewide human metabolome study (Figure 2a). Among them are bile acids and steroids which have been reported previously to be substrates of OATP1B116. The other metabolites, which showed significantly higher levels in individuals who were carriers of the OATP1B1-Val174Ala variant, were fatty acid dicarboxylates and lysolipids. Examples of fatty acid dicarboxylates were tetradecanedioate, hexadecanedioate and octadecanedioate; examples of lysolipids with altered levels were 1-arachidonoylglycerophosphoethanolamine and 1-arachidonoylglycerophosphoinositol (Table 1, Supplemental Table 2). Furthermore, the genomewide association for some of these metabolites showed that OATP1B1 was the top association locus, for example, for the sulfated and glucuronidated bile acids and fatty acid dicarboxylates (Figure 2a). The levels of other known substrates of OATP1B1, such as bilirubin17, were also significantly associated with the OATP1B1 functional variant, however, at weaker p-values (p=0.0009). Notably, previous GWAS showed significant associations of OATP1B1 polymorphisms with bilirubin elevation18, although not all reached genomewide significance19. In addition, other SNPs in OATP1B1 (r2 <0.8 based on 1000 Genome Project European reference panel) were also associated with these 20 metabolites.
Figure 2.
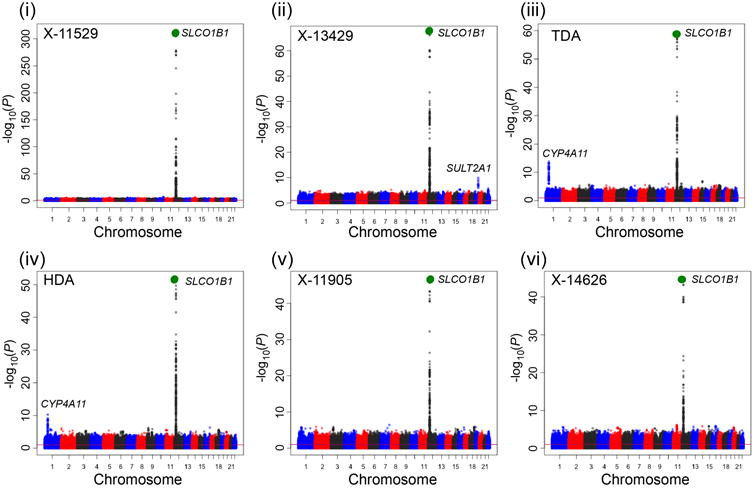

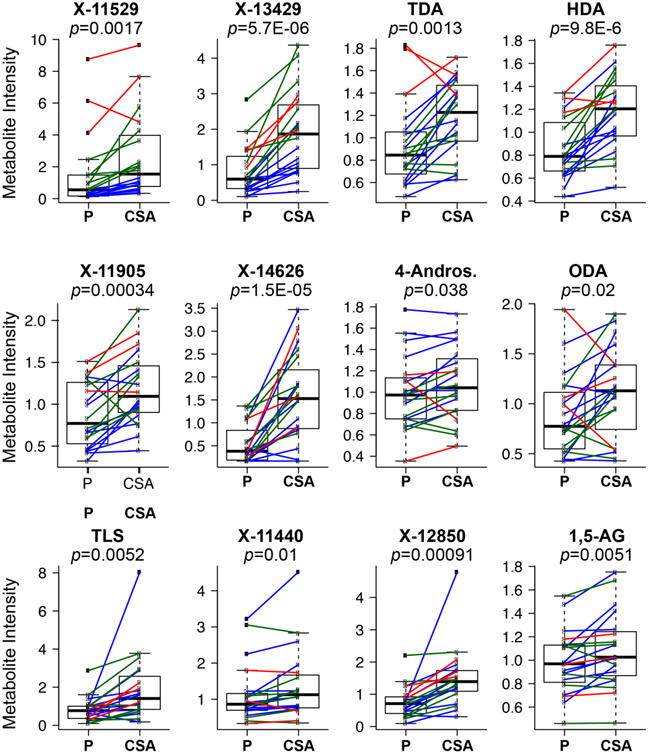
Twelve metabolites (i to xii) significantly associated with OATP1B1-Val174Ala in both a genomewide association study of human metabolites11 and significantly associated in healthy volunteers receiving pravastatin and cyclosporine, an OATP1B1 inhibitor. a. Manhattan plots of the 12 metabolites. Manhattan plots were generated using the publicly available data, which provided the meta-analysis p-values of each SNP (http://mips.helmholtz-muenchen.de/proj/GWAS/gwas/index.php?task=download). The large green circle represents the OATP1B1 functional variant, Val174Ala (rs4149056). Other loci which include genes for transporters or enzymes are labeled. OATP1B1-Val174Ala or its LD variant (r2>0.8) is significantly associated with eight metabolites with the strongest p-values in the GWAS (metabolites (i) - (vii) and (ix)). b. The 12 metabolites significantly higher in healthy volunteers after administration of cyclosporine (CSA) compared to placebo (P). Each dot represents the metabolite intensity in the plasma from an individual after administration of placebo (P) or cyclosporine (CSA) and each line connects the metabolite intensity from the same individual following placebo or CSA administration. The color of the line represents the genotype of OATP1B1-Val174Ala, where blue represents homozygous reference allele, green represents heterozygous reference allele and red represents homozygous reduced function variant. The p-values of the paired t-test between the placebo and CSA treatment group are shown in the figure. Individuals with the variant for OATP1B1-Val174Ala (after placebo administration) had significantly higher metabolites levels of X-11529, X-13429, TDA, HDA and X-11905 (p<0.005). The mean and SD for each of the 12 metabolites in each genotype group are shown in Supplemental Table 5. Note: X-11529: Glycochenodeoxycholate glucuronide; X-13429: glycodeoxycholate sulfate or isomer; TDA: Tetradecanedioate; HDA: Hexadecanedioate; X-11905: Unknown; X-14626: Unknown; 4-Andros.: 4-androsten-3-beta,17-beta-diol disulfate 2*; ODA: Octadecanedioate; TLS: Taurolithocholate 3-sulfate; X-11440: Unknown; X-12850: Glycochenodeoxycholate sulfate or isomer; 1,5-AG: 1,5-anhydroglucitol.
Cyclosporine (CSA), an OATP1B1 inhibitor, increased the plasma levels of 12 metabolites, which were associated with OATP1B1 Val174Ala in the GWAS
Plasma samples from 20 healthy volunteers obtained with and without CSA administration were evaluated for metabolite levels using the DiscoveryHD4™ platform (Metabolon Inc.). The same technology, but with less coverage, was used in the study of Shin et al.11. Among the 20 healthy subjects who are self-reported Caucasians, there were ten volunteers who were homozygous for the reference allele of OATP1B1-Val174Ala, seven volunteers who were heterozygous and three who were homozygous for the Val174Ala variant allele. A total of 956 metabolites were identified, where 613 were metabolites of known structure and 343 were metabolites of unknown structural identity (Supplemental Table 3). Following log transformation and imputation of missing values (See Supplementary Information), we report a summary of 956 metabolites and their statistical significance p-value (paired t-test) and the estimate of the false discovery rate (q-value) (Supplemental Table 3). Several metabolites were significantly higher in the CSA arm compared to placebo arm (p<0.05) and they belong to: primary and secondary bile acids (sulfated and glucuronidated bile acids), eicosanoids, dicarboxylic acids, heme metabolites and steroid sulfate and steroid glucuronide conjugates. Many of these metabolites are known OATP1B1 substrates16. In fact these metabolites were also significant (p<0.05) in The Metabolomics GWAS Server11 (see Table 2). A total of 12 metabolites were significantly associated with variants in OATP1B1 when using both the GWAS data and the CSA inhibition data (Figure 2). That is, the levels of these 12 metabolites were significantly higher in individuals with the OATP1B1-Val174Ala (rs4149056) variant (p<0.05) in The Metabolomics GWAS Server and in healthy volunteers following administration of CSA/pravastatin (FDR q-value <0.2). Five of the 12 metabolites (X-11529, X-13429, TDA, HDA and X-11905) also showed a relationship with the rs4149056 SNP in the 20 healthy volunteers following administration of placebo (p<0.005) (Figure 2b). Other metabolites, including arginine, pro-hydroxy-pro, ergotheinine and unknown metabolites (X-11440, X-14658, X-11438) have weaker associations with SNPs in OATP1B1 (p>10-5) but no significant associations with OATP1B1-Val174Ala (p>0.05). These metabolites were also not modulated upon CSA administration in the DDI study (FDR > 0.2). Among the 12 metabolites, fatty acid dicarboxylates (e.g. tetradecanedioate, hexadecanedioate) and 1,5-anhydroglucitol have not been associated with OATP1B1 previously. OATP1B1 was the top locus associated with 9 of the 12 metabolites. The functional variant OATP1B1-Val174Ala, or its LD SNP (r2>0.8), had the strongest association with 8 of the 9 metabolites (Figure 2a and Supplemental Table 4). In addition to the 12 metabolites that were significantly associated with SLCO1B1 genotype using both methods, other metabolites were associated using one, but not both of the methods. For example, lysolipids (e.g., 1-arachidonoylglycerophosphoinositol (p=3.7×10⁻³¹)) were significantly associated with the SLCO1B1 locus in the GWAS but not the CSA DDI study, perhaps because large samples would be needed in the clinical DDI study to detect differences in these metabolites. In contrast, these lysolipids may not be substrates of OATP1B1, but their metabolic products may be substrates of the transporter. Despite the fact that previous studies have shown that total bilirubin levels (conjugated and unconjugated) were elevated in the presence of an OATP1B1 inhibitor (rifampicin or CSA at higher dose)9,20,21, we did not observe significantly elevated levels of unconjugated bilirubin in our 20 healthy volunteers (p<0.2). Our study may not have been sufficiently powered to detect the increased bilirubin levels due to it's smaller effect size (as shown in Supplemental Table 2) or sample collection times may not have been optimal for observing changes in bilirubin levels.
Table 2.
Twelve candidate metabolites, which are significantly associated with higher levels in subjects with minor allele C for rs4149056 (OATP1B1-Val174Ala) with p<0.05 and also significantly associated with higher levels in healthy volunteers (20 participants) after dosing with cyclosporine (CSA) with q<0.2.
| Genomewide Association Studya | Clinical Drug-Drug Interaction Study | |||||||
|---|---|---|---|---|---|---|---|---|
| Metabolite Name | Pathway | Effectb | Standard Error | p-valuec | Median (Placebo) | Median (CSA) | p-value | q-value |
| X-11529 (likely to be glycochenodeoxycholate glucuronide) | Secondary bile acid metabolism | -0.30 | 0.0078 | 5.5E-315 | 0.55 | 1.54 | 0.0017 | 0.083 |
| X-13429 (likely to be glycodeoxycholate sulfate or isomer) | Secondary bile acid metabolism | -0.14 | 0.0079 | 2.8E-67 | 0.60 | 1.87 | 5.74E-06 | 0.0027 |
| Tetradecanedioate | Fatty Acid, Dicarboxylate | -0.099 | 0.0061 | 3.4E-59 | 0.85 | 1.23 | 0.0013 | 0.067 |
| Hexadecanedioate | Fatty Acid, Dicarboxylate | -0.088 | 0.0058 | 1.7E-51 | 0.79 | 1.20 | 9.75E-06 | 0.0029 |
| X-11905 | Unknown | -0.083 | 0.0057 | 1.1E-47 | 0.77 | 1.09 | 0.00034 | 0.027 |
| X-14626 | Unknown | -0.053 | 0.0038 | 6.9E-44 | 0.38 | 1.53 | 1.53E-05 | 0.0029 |
| 4-Androsten-3beta,17beta-diol disulfate 2* | Steroid | -0.049 | 0.0055 | 1.3E-18 | 0.92d | 1.17d | 0.038d | 0.18d |
| Octadecanedioate | Fatty Acid, Dicarboxylate | -0.029 | 0.005 | 1.0E-08 | 0.74d | 1.10d | 0.0013d | 0.08d |
| Taurolithocholate 3-sulfate | Secondary bile acid metabolism | -0.041 | 0.0078 | 1.5E-07 | 0.77 | 1.41 | 0.0052 | 0.18 |
| X-11440 | Unknown | -0.025 | 0.0064 | 0.00011 | 0.81d | 1.18d | 0.0048d | 0.18d |
| X–12850 (likely to be Glycochenodeoxycholate sulfate) | Secondary bile acid metabolism | -0.019 | 0.0071 | 0.0084 | 0.71 | 1.39 | 0.00091 | 0.055 |
| 1,5-Anhydroglucitol (1,5-AG) | Glycolysis, Gluconeogenesis, and Pyruvate Metabolism | -0.0078 | 0.0035 | 0.024 | 0.97 | 1.03 | 0.0051 | 0.18 |
Genomewide Association Study: Shin SY, Fauman EB, Petersen AK, Krumsiek J, Santos R, et al. (2014) An atlas of genetic influences on human blood metabolites. Nat Genet 46: 543-550.
Effect: A negative effect means that the major reference allele (T) has lower levels of the metabolites. The negative effects were observed in two independent cohorts as described by Shin et al. (2014). The effect for each cohort is available in Supplemental Table 2.
This is the meta-analysis p-value. The meta-analysis was performed using two independent cohorts as described by Shin et al. (2014). The p-value for each cohort is available in Supplemental Table 2.
The reported metabolite levels, p-value and q-value were after removing individuals who are homozygous for reduced function variant of OATP1B1-Val174Ala.
Fatty acid dicarboxylates interacted with OATP1B1, but not OATP1B3, OATP1A2 and OATP2B1
Seven of the 12 metabolites identified from the GWAS and which also showed increased levels following CSA treatment (Figure 1, Table 2), six were tested in the follow-up in vitro studies: two sulfated and one glucuronidated bile acid were not available, so we tested the two parent compounds, glycochenodeoxycholate and glycodeoxycholate, bearing in mind that the results could be different for the conjugated metabolites (Table 3). Among the five metabolites, which were not followed up in vitro, were three unknown metabolites (X-11905, X-14626 and X-11440), and two named biochemical (octanedioic acid and 4-androsten-3beta,17beta-diol disulfate) that were not readily available for purchase.
Table 3.
Inhibitor effect on 11 transporters using transfected cell lines or membrane vesicles from transfected cell lines. Metabolites were tested as inhibitors at 30 μM. The colors indicate the different range of inhibition by the metabolites. Since the publication of Shin et al. 201410, a few previously unknown compounds have been identified by Metablon Inc., X-11529, X-13429 and X-12850, which are likely to be glycochenodeoxycholate glucuronide, glycodeoxycholate sulfate and glycochenodexycholate sulfate, respectively.
| Metabolite Name | Actual Compound Tested | OATP1B1 | OATP1B3 | OATP1A2 | OATP2B1 | OAT1 | OAT2 | OAT3 | NTCP | ABCC2 | ABCG2 | ABCB11 |
|---|---|---|---|---|---|---|---|---|---|---|---|---|
| X-11529 (likely glycochenodeoxycholate glucuronide) | Glycochenodeoxycholate | |||||||||||
| X-12850 (likely glycochenodeoxycholate sulfate or isomer) | ||||||||||||
| X-13429 (likely glycodeoxycholate sulfate or isomer) | Glycodeoxycholate | |||||||||||
| Tetradecanedioic Acid | Tetradecanedioic Acid | |||||||||||
| Hexadecanedioic Acid | Hexadecanedioic Acid | |||||||||||
| Taurolithocholate 3-sulfate | Taurolithocholate 3-sulfate | |||||||||||
| 1,5-Anhydroglucitol (1,5-AG) | 1,5-Anhydroglucitol | |||||||||||
| Cyclosporine (CSA) | Cyclosporine | Ref. 1 | Ref. 2 | Ref. 3 | ||||||||
| ≤30% Inhibition | >30% - 70% Inhibition | >70% Inhibition | ||||||||||
References
Wortelboer, H.M. et al. Interplay between MRP inhibition and metabolism of MRP inhibitors: the case of curcumin. Chem Res Toxicol 16, 1642-51 (2003)
Xia, C.Q., Liu, N., Miwa, G.T. & Gan, L.S. Interactions of cyclosporin a with breast cancer resistance protein. Drug Metab Dispos 35, 576-82 (2007).
Montanari, F. et al. Flagging Drugs That Inhibit the Bile Salt Export Pump. Mol Pharm 13, 163-71 (2016)
We approached the in vitro studies by first testing the metabolites (at 30 μM) as competitive inhibitors of OATP1B1 and other organic anion transporters (Table 3). Any metabolite that inhibited >30% was deemed an inhibitor of that transporter, and was tested as a potential substrate. This method is accurate for identifying true inhibitors and substrates, though low potency inhibitors that may also be substrates of the various transporters would be missed. Among the six metabolites that were tested as inhibitors of OATP1B1 and other organic anion-transporting polypeptides (OATPs), OATP1B3, OATP1A2 and OATP2B1 in transfected cell lines (Table 2, Figure 1), OATP1B1 transporter activity was inhibited >70% at 30 μM by five of the metabolites (Table 3). In addition, we showed that tetradecanedioate (TDA) and hexadecanedioate (HDA) inhibited OATP1B1 potently (IC50 1.6 – 4 μM) (Figure 3a and 3b). Interestingly, substrate uptake by other OATPs, OATP1B3, OATP1A2 and OATP2B1 was not inhibited by TDA and HDA (Table 3). However, the other 3 metabolites (glycochenodeoxycholate, glycodeoxycholate and taurolithocholate-3-sulfate), inhibited OATP1B3 and OATP2B1 >30% at 30 μM (Table 3). CSA inhibited several transporters including OATP1B1, OATP1B3, NTCP, ABCC2, ABCB11 and ABCG2 (Table 3).
Figure 3.

Inhibition (a and b) and uptake (c) studies of tetradecanedioic acid (TDA) and hexadecanedioic acid (HDA) in HEK293 cells stably expressing OATP1B1. Uptake of 3H-TDA (d) or 3H-HDA (e) with or without cyclosporine (CSA, 10 μM) in HEK293 cells stably expressing OATP1B1 reference or OATP1B1-Val174Ala. (a) HEK293 Flp-In cells, stably transfected with a plasmid containing empty vector (EV) or cDNA of OATP1B1 were incubated with a trace amount of 3H-TDA or 3H-HDA with or without 10 μM CSA. Cells were incubated with the HBSS buffer containing the substrate with or without the inhibitor for 4 min. (b and c) Representative curves of the effects of TDA and HDA on the uptake of 3H-estradiol-17β-glucuronide (trace amount) in stably transfected HEK293 cell lines overexpressing OATP1B1. Concentrations of TDA and HDA ranged from 0.1 μM to 100 μM. (d and e) Cells were incubated with the HBSS buffer containing the substrate with or without the inhibitor, CSA, for 4 min. A trace amount of 3H-TDA (specific activity: 1.1 Ci/mmol) or 3H-HDA (specific activity: 89.8 Ci/mmol) were used (1:5000 dilution). Final concentrations of 3H-TDA and 3H-HDA that were used in the uptake studies were 180 nM and 12 nM respectively. Fold changes are normalized to empty vector control uptake (without inhibitor). Results shown are the mean ± SD for a representative experiment, performed in triplicate. The experiments were repeated in three independent experiments with similar trends and results. ***, p≤0.0001, **, p≤0.001 (between EV and OATP1B1); ###, p≤0.0001, ##, p≤0.001 (between OATP1B1 without inhibitor and with inhibitor); %%, p≤0.01 (between OATP1B1 reference (Val174) and OATP1B1 Ala174).
Since TDA and HDA and 1,5-anhydroglucitol represent novel classes of metabolites not known previously to interact with OATP1B1, we tested them as substrates of the OATP1B1 in transfected cells. TDA and HDA showed significantly higher uptake in HEK293 cells overexpressing OATP1B1 compared to cells transfected with empty vector (Figure 3c). Uptake of TDA (180 nM) and HDA (12 nM) was significantly inhibited by CSA (10 μM) (Figure 3c). In addition, cells overexpressing OATP1B1-Val174Ala had intermediate uptake of TDA and HDA compared to cells containing wild type OATP1B1 or empty vector (Figure 3d and 3e). 1,5-Anhydroglucitol (1,5-AG) was not transported by OATP1B1 (Supplemental Figure 1) and also did not inhibit OATP1B1 at 30 μM (Table 3). Since SNPs within the OATP1B1 locus are in linkage disequilibrium with SNPs within or near to the genes encoding OATP1A2 and OATP1B3, and that they share overlapping substrates, thus we evaluated the uptake of TDA and HDA in cells overexpressing these transporters and OATP2B1. We did not observe significant uptake of TDA and HDA in OATP1A2, OATP1B3 and OATP2B1 transfected cells (Supplemental Figure 2).
Fatty acid dicarboxylates interacted with organic anion transporters, OAT1 and OAT3
Primary and secondary bile acids, sulfated and glucuronidated bile acids, steroids, and conjugates of these metabolites are substrates of many transporters, including, organic anion transporters (OAT1, OAT2, OAT3), NTCP, ABCC2, ABCG2 and ABCB1122,23. Nothing has been reported for the dicarboxylic acids TDA and HDA, or 1,5-anhydroglucitol. Accordingly, we first screened the six metabolites as inhibitors of these seven transporters (Table 3). TDA and HDA inhibited OAT3 (>70%) and OAT1 (>30%) but not the other transporters. The other metabolites had different inhibition characteristics, with 1,5-anhydrglucitol not acting as an inhibitor (Table 3).
TDA and HDA were then tested as substrates of OAT1 and OAT3 by quantifying uptake in transfected cells. Both TDA and HDA were significantly taken up in OAT1 and OAT3 transfected cell and this was inhibited by probenecid (Figure 4a and 4b). Notably, SNPs in OAT1 and OAT3 did show weak associations with the fatty acid dicarboxylates (p-values ranged from p=0.007 to 0.02; Supplemental Table 4).
Figure 4.

Uptake of 3H-TDA or 3H-HDA in HEK293 cells stably expressing (a) OAT1 and (b) OAT3. Inhibitor (Inh.) used for each transporter was probenecid (100 μM for OAT1 and OAT3). Cells were incubated with the HBSS buffer containing the tritiated substrate with or without the inhibitor for 2 min. Trace amounts of 3H-TDA (specific activity: 1.1 Ci/mmol) or 3H-HDA (specific activity: 89.8 Ci/mmol) were used (1:5000 dilution). Final concentrations of 3H-TDA and 3H-HDA that were used in the uptake studies were 180 nM and 12 nM respectively. Fold changes are normalized to empty vector control uptake (without inhibitor). Results shown are the mean ± SD for a representative experiment, performed in triplicate. The experiments were repeated in three independent experiments with similar significance and trend. ***, p≤0.0001 (between EV and OAT1 or OAT3), ###, p≤0.0001, ##, p≤0.001 (between OAT1 or OAT3 without inhibitor and with inhibitor).
Discussion
The importance of DDIs mediated by transporters has been well-recognized, and as a result, regulatory agencies from the USA, Europe and Japan have issued guidelines to drug developers that rely primarily on in vitro transporter assays to inform decisions to conduct clinical DDI studies. Transporter assays are mechanistic and provide considerable insight into drug transporter interactions. However, in vitro drug transporter interactions may not be clinically relevant, if the interaction of the compound with the transporter is not sufficiently potent6,24,25. Therefore, other tools are needed to complement these assays to more reliably predict potential clinical DDIs.
Though previous studies have used various methods in isolation such as clinical DDI studies in humans8,26 and studies in animals (e.g., monkeys and knockout mice21,27,28) to discover biomarkers, in this study, we used a multi-tiered approach combining human genetic and metabolomic studies with in vitro methods to discover endogenous metabolites that could serve as biomarkers of the widely studied hepatic organic anion transporter, OATP1B1. The beauty of such biomarkers is that they can be used from as early as first-in-human studies to suggest potential in vivo DDIs before conducting costly DDI studies. As the metabolites are measured from in vivo serum, plasma or urine samples, they may be more accurate in predicting DDIs than in vitro studies of drug-transporter interactions. Ideally, an endogenous biomarker for a drug transporter should be stable in the collected matrix, selective for the transporter of interest, quantitatively associated with clinical DDIs involving the transporter and not be affected by normal or disease conditions. Measurement of the biomarker should be quantitative, accurate, selective, sensitive and reproducible. Our major findings were that (a) many metabolites were significantly associated with genetic variants in various SLC transporters; (b) twelve metabolites were significantly associated with SLCO1B1 (OATP1B1) in both GWAS and the CSA DDI study; (c) among six metabolites tested in vitro, we identified 2 novel substrates of OATP1B1; and (d) the six metabolites also interacted with other xenobiotic enzymes and transporters.
Many metabolites were associated with genetic variants in various SLC transporters
Data collected from The Metabolomics GWAS Server revealed that many serum metabolites were strongly associated with SLC transporter variants at genomewide significance (p<5×10⁻⁸). Some of these metabolites were documented substrates of the transporters and replicated in other genomewide association studies of human metabolites (Table 1). Importantly, several potential new substrates were identified such as histidine, which was associated with the uric acid transporter, SLC2A9. Further studies are clearly needed to determine whether these metabolites are substrates of the transporters. In addition, future studies are needed to validate if these metabolites (Table 1, Supplemental Table 1) can be candidate probes for used clinically to identify drugs likely to cause a potential transporter-mediated DDI. This would be of particular importance for transporters playing a role in the pharmacokinetics of many prescription drugs, e.g. OATP1B1, OAT1, OCT2 and MATE1. Such biomarkers could also be useful to investigate variation in pharmacokinetics due to genetic variants in drug transporters.
Twelve metabolites were significantly associated with SLCO1B1 (OATP1B1) in both the GWAS and the cyclosporine (CSA) DDI study
OATP1B1, a highly expressed transporter in human liver, is known to transport a variety of endogenous metabolites, including bile acids, steroids, bilirubin, eicosanoids and thyroid hormones (see reviews16,29). In this study, several of the known endogenous metabolites of OATP1B1 were found to significantly associate with the reduced function variant of OATP1B1 (rs4149056; see Supplemental Table 2). Notably, the most significant association among all SLC transporters was the association of X-11529 (glycochenodeoxycholate glucuronide) levels with OATP1B1-Val174Ala (p=5.5×10-315). In fact, conjugates of bile acids represented 4 of the 12 metabolites significantly associated with OATP1B1 genetic variants. These conjugates also increased following administration of CSA. Consistent with our results, a previous study has shown that genetic variants in SLCO1B1 associated with plasma levels of glycochenodeoxycholate30 as well as bilirubin glucuronide conjugates19. However, in the GWAS there were significant associations of genetic variants in genes encoding other transporters (OATP1B3, OATP1A2, MRP2 and BSEP) in addition to OATP1B1 with conjugated bile acids (Supplemental Table 4) consistent with multiple interactions between hepatic and intestinal transporters and sulfate and glucuronide conjugates of bile acids31. Because CSA is a non-specific OATP1B1 inhibitor with potent inhibitory effects on transporters such as OATP1B3, MRP2, NTCP and BSEP32 (Table 3), observed effects in the clinical study could be a result of inhibition of other transporters as well. Even with this complexity, use of these methods helped to identify potential selective metabolites as substrates of OATP and OAT. It is worth mentioning that the metabolomic platform that was used in our study did not detect some metabolites that have previously been reported as potential OATP1B1 biomarkers, e.g. coproporphyrins I and III28,33. This may be due to differences in the methodologies used for metabolite quantification.
Fatty acid dicarboxylates are novel substrates of OATP1B1
Among the six metabolites, which were selected for in vitro studies as inhibitors, the bile acids inhibited other OATPs and other bile acid transporters, BSEP, NTCP and MRP2 (Table 3). Although not evaluated in this study, the conjugated bile acids and steroids are likely to interact with OATP1B1 and other transporters, e.g. OATP1B3, OAT3, NTCP, ABCC2, ABCG2 or ABCB11, due to evidence in the literature indicating that glucuronide and sulfated conjugates interact with these transporters34,35. To our knowledge, this study for the first time demonstrates that fatty acid dicarboxylates, such as tetra- and hexadecanedioic acid (TDA and HDA respectively), are substrates of OATP1B1 (Figure 3, Table 2). The results suggest that these may be useful biomarkers of OATP1B1. Interestingly, we noted that TDA (Supplemental Figure 3) as well as HDA and 8 of the 10 other metabolites significantly correlated with pravastatin AUC (Supplemental Table 5) in 16 individuals with genotype TT and TC genotypes for rs4149056 (OATP1B1-Val174Ala). TDA and HDA had a small dynamic range whereas other metabolites, e.g., X-11529, had larger dynamic ranges; however, TDA, HDA as well as X-11529 correlated with pravastatin AUC. These data suggest that the metabolites may potentially serve as quantitative biomarkers of OATP1B1 activity, although further work is clearly needed.
The metabolites were found to also associate with other xenobiotic enzymes and transporters
Many drugs are known to interact with several metabolizing enzymes and transporters36. Similarly, in these studies, we noticed that several of the metabolites that were associated at genomewide level significance with SLCO1B1 were significantly associated with metabolizing enzymes. These enzymes included CYP4A11, which was associated with TDA and HDA levels; and SULT2A1, which was associated with X-13429, X-12850, and X-11440 levels (Figure 2a). This reflects the complexity of endogenous metabolites disposition and metabolism, and shows the difficulty in identifying biomarkers for a single enzyme or transporter.
In order to eliminate the possibility that TDA and HDA levels were elevated upon CSA administration in the clinical DDI study, we evaluated whether CSA inhibit CYP4A11. In our study, we showed that CSA did not inhibit CYP4A11 (Supplemental Figure 4). However, the CYP4A11 assay shown in Supplemental Figure 3 may suggest that fatty acid dicarboxylic acids are substrates or products of CYP4A11. This is consistent with the information from literature that CYP4A11 has been implicated in the production of dicarboxylic acid37.
Notably, metabolites may interact with multiple transporters. In our study, we showed that TDA and HDA, which are substrates of OATP1B1, are also substrates of the renal organic anion transporters, OAT1 and OAT3. Although the results suggest these two fatty acid metabolites may be potential biomarkers of these transporters, there is currently no information about the affinity of the metabolites for OATP1B1, OAT1 and OAT3. To our knowledge, there is no published information about the plasma concentrations of these metabolites, which together with kinetic information is needed to validate the in vivo relevance of organic anion transporters as determinants of the disposition of these metabolites. Relative blood or urine concentrations of DCA or conjugates, and factors that modulate them (e.g., disease, nutritional status, drug intake) are not well defined, with the exception that DCA levels are elevated in patients with Reye's Syndrome38. Use of TDA or HDA as endogenous biomarkers of OATP1B1 alone, or in combination with the OAT1 and OAT3 is intriguing and calls for further evaluation.
Future Directions
Overall, from our multi-tiered approach, we identified endogenous metabolites that interact with OATP1B1, including previously unknown substrates of the transporter. These biomarkers may potentially be used as probes to determine whether new drugs under development are likely perpetrators of OATP1B1-mediated DDIs. The use of sensitive and specific endogenous biomarkers may help drug developers avoid unnecessary clinical DDI studies (predicted from current in vitro methods1, and focus their efforts on drugs that are more likely to cause clinical DDIs. However, additional clinical studies are needed to validate these metabolites (conjugated bile acids, TDA, HDA, conjugated steroids) and the specificity of the biomarkers needs to be ascertained. In particular, are the biomarkers specific for OATP1B1 or do they also serve as biomarkers for other organic anion transporters such as OAT1 and OAT3. Other factors, such as disease, diet and ethnicity, which may affect the levels of these biomarkers, should be characterized. Finally, the sensitivity of the biomarkers (e.g., the magnitude of change in the biomarker levels that can be detected in the presence of strong, moderate or weak inhibitors) and their quantitative relationship with changes in the levels of known OATP1B1 model substrates (e.g., pravastatin, rosuvastatin), need to be established.
Materials and Methods
Genomewide Approach to Identify Endogenous Metabolites for SLC Transporters
Several genomewide studies have been published to identify the genetic factors that associate with human metabolites levels11,12,39-42. In general, samples from these studies were collected from fasting healthy volunteers and the metabolites were measured using different approaches. Shin et al.11 has published a meta-analysis, which includes 7824 adult individuals, from two European populations, and the associations of their genetic variants with over 400 metabolites in blood samples. The complete datasets are available from this link, http://mips.helmholtz-muenchen.de/proj/GWAS/gwas/gwas_server/shin_et_al.metal.out.tar.gz. These datasets were used as our primary discovery of endogenous metabolites for SLC transporters. The single nucleotide polymorphisms (SNPs) for all 52 family members of the SLC transporters (total number 390), including 25,000 bp up and downstream of the transcription start and stop sites and the levels for all 529 metabolites were extracted from the datasets. Metabolites and SLC transporters with associations (p-values<10-5) were extracted for exploration and hypothesis generation.
Clinical Samples for Cyclosporine/Pravastatin Coadministration in Healthy Subjects
For the clinical metabolomic study, we used plasma obtained from a DDI study of CSA and pravastatin43, In particular, plasma samples in 20 healthy volunteers collected 30 minutes after the second dose of CSA (100 mg) or placebo were used for metabolite measurements. Volunteers were genotyped for rs4149056 (Val174Ala), and included ten who were homozygous for the reference allele, seven who were heterozygous and three who were homozygous for the variant allele. For the correlative analysis, we included nine and seven homozygous for the reference allele and heterozygous for the variant allele of rs4149056 respectively, as one subject (who is homozygous for the reference allele) did not achieve measureable pravastatin levels and therefore was omitted from the analysis. Further information is available in Supplementary Information.
Quantification of Metabolites in the Clinical Samples for Cyclosporine/Pravastatin Coadministration
Metabolites were measured in the plasma samples using the Metabolon platform (The DiscoveryHD4™ Platform), which represents a comprehensive and unbiased way of identifying and quantifying metabolites. Plasma metabolite levels in the same individuals in both cyclosporine and placebo were determined using the platform. Extracted plasma samples were processed via three ultra high-performance liquid chromatography/tandem accurate mass spectrometry (UHPLC/MS/MS) methods and an additional gas chromatography/mass spectrometry method (GC/MS). Further information is available in Supplementary Information.
Chemicals and Reagents
Tetradecanedioic acid, hexadecanedioic acid, taurolitocholate-3-sulfate, glycochenodeoxycholate, glycodeoxycholate and 1,5-anhydroglucitol were purchased from Sigma-Aldrich (St. Louis, MO). [3H]-Tetradecanedioic acid was custom synthesized by Moravek Biochemicals (Brea, CA). The following radiolabeled compounds were used as model substrates for specific transporters: [3H]-esterone sulfate (Perkin Elmer), [3H]-para-aminohippurate (American Radiolabeled Chemicals), [3H]- guanosine 3′,5′-cyclic phosphate (Moravek), [3H]-cholecystokinin octapeptide (Perkin Elmer), [3H]-taurocholic acid (Perkin Elmer) and [3H]-estradiol-17β-D-glucuronide (Perkin Elmer). In addition, [3H]-hexadecanedioic acid and [3H]-1,5-anhydroglucitol were customized synthesized by Sanofi-Aventis (Frankfurt, Germany). See Supplementary Information.
Cell Culture and In Vitro Transport and Inhibition Studies
Cells stably expressing empty vector (EV), OATP1B144, OATP1B345, OAT146, OAT247, OAT348 were cultured in the following conditions. Stably transfected HEK-293 Flp-In cells were maintained in Dulbecco's Modified Eagle Medium (DMEM) H-21 medium supplemented with 10% fetal bovine serum, 100 units/mL penicillin, 100 units/mL streptomycin and 150 μg/mL hygromycin B. In some transporter studies (OATP1A2, OATP1B1 and NTCP), HEK293T/17 (ATCC) were used for transient transfection and were cultured in the above medium but without the hygromycin B (selection antibiotic). See Supplementary Information for more information about the radiolabeled compounds used as substrates for specific transporters in the inhibition studies.
Statistical Analysis
P-values were determined using paired nonparametric Student's t-tests to analyze the differences in metabolite levels in plasma from placebo-treated versus CSA-treated healthy volunteers. An estimated false discovery rate (q-value) is calculated to take into account the multiple comparisons that normally occur in metabolomic-based studies. False discovery rate adjustment is an acceptable and alternative multiple test adjustments and particularly relevant for exploratory and data-driven testing. For exploratory analysis of our clinical DDI study with CSA, q-value <0.2 was considered significant. Unless specified, data are expressed as mean ± standard deviation (SD). For in vitro transporter studies, statistical analyses were performed by unpaired Student's t-tests to determine significant differences between: (i) cells transfected with empty vector or transfected with vector containing transporter cDNA and; (ii) cells treated with no inhibitor or with inhibitor of specific transporter. The data were analyzed using GraphPad Prism 6.0 (La Jolla, CA). A p-value <0.05 was considered statistically significant.
Supplementary Material
Study Highlights.
What is the current knowledge on the topic?
Currently, regulatory agencies recommend the use of in vitro studies coupled with particular criteria to predict transporter-mediated clinical drug-drug interactions (DDIs), and to trigger the conduct of expensive clinical DDI studies. Use of these assays and criteria results in many false positives49,50. Thus endogenous biomarkers for membrane transporters are needed to better predict transporter-mediated clinical DDIs.
What question did this study address?
Can novel biomarkers for transporters be identified through multi-scale approaches including analysis of published genomewide association studies of endogenous metabolites, metabolomic profiling of samples from clinical DDI studies, and uptake studies in transporter expressing cell lines?
What this study adds to our knowledge?
Using multi-scale approaches, we identified potential biomarkers of OATP1B1, which, if validated, may be used as probes for clinical DDIs. This is the first study showing that OATP1B1 interacts with fatty acid dicarboxylates.
How this might change clinical pharmacology or translational science?
Endogenous biomarkers such as those identified in this study can be used during drug development to better predict clinical DDIs.
Acknowledgments
We would like to acknowledge the funding sources from Sanofi-Aventis and NIH grants for: K.M.G., D.L.K, S.W.Y, A.Z. (U19GM061390), C-H. H (U01FD004979), X.M.L and S.G (T32 GM007175) and M.M.G (T32 GM07546). In addition, we would like to acknowledge the following collaborators for their contributions to: computational and laboratory experiments in Sanofi-Aventis Deutchland GmbH (Dr. Hans Matter, Dr. Christian Buning, Thomas Koose, Marion Schmidt, Alexandra Kautz), synthesis of radioligands in Sanofi-Aventis Deutchland GmbH (Volker Derdau, Jens Atzrodt); metabolomics profiling in Metabolon Inc. (Jeff Buckthal and Robert P. Mohney); protocol preparation and volunteer recruitment (Dr. Richard A. Castro from UCSF); facilities for clinical studies (UCSF Clinical & Translational Science Institute (CTSI) (Grant UL1 RR024131); and computational code writing (Doug Stryke and Danny S. Park from UCSF).
Footnotes
Supplementary Information: See attached
Author Contributions: K.M.G., S.W.Y., M.G., J.M.K., W.B., and D.L.K. wrote the manuscript; K.M.G., S.W.Y., M.G., M.G., C-H.H., D.W., X.L., S.G., J.M.K., A.Z., K.M., W.B., and D.L.K. designed the research; S.W.Y., M.G., C-H.H., D.W., X.L., S.G., A.C., A.Z., W.B., and D.L.K. performed the research; K.M.G., S.W.Y., M.G., D.W., X.L., S.G., J.M.K., A.Z., K.M., W.B., and D.L.K. analyzed the data; K.M.G., K.M., W.B., and D.L.K. contributed new reagents/analytical tools.
References
- 1.Food and Drug Administration. Drug Interaction Studies — Study Design, Data Analysis, Implications for Dosing, and Labeling Recommendations. Rockville, MD: Feb 1, 2012. Guidance for Industry. 2012. [Google Scholar]
- 2.European Medicines Agency. Guideline on the investigation of drug interactions. London, United Kingdom: Jun 21, 2012. 2012. [Google Scholar]
- 3.Maeda K, Hisaka A, Saito Y, Nagai N, Kume T. Brief Guide for “Drug Interaction Guideline for Drug Development and Labeling Recommendations (Final Draft)”. Journal of Pharmaceutical Science and Technology, Japan. 2014;74:406–413. [Google Scholar]
- 4.Lepist EI, et al. Contribution of the organic anion transporter OAT2 to the renal active tubular secretion of creatinine and mechanism for serum creatinine elevations caused by cobicistat. Kidney Int. 2014;86:350–7. doi: 10.1038/ki.2014.66. [DOI] [PMC free article] [PubMed] [Google Scholar]
- 5.Matsushima S, et al. The inhibition of human multidrug and toxin extrusion 1 is involved in the drug-drug interaction caused by cimetidine. Drug Metab Dispos. 2009;37:555–9. doi: 10.1124/dmd.108.023911. [DOI] [PubMed] [Google Scholar]
- 6.Hibma JE, et al. The Effect of Famotidine, a MATE1-Selective Inhibitor, on the Pharmacokinetics and Pharmacodynamics of Metformin. Clin Pharmacokinet. 2015 doi: 10.1007/s40262-015-0346-3. [DOI] [PMC free article] [PubMed] [Google Scholar]
- 7.Imamura Y, et al. 6beta-Hydroxycortisol is an endogenous probe for evaluation of drug-drug interactions involving a multispecific renal organic anion transporter, OAT3/SLC22A8, in healthy subjects. Drug Metab Dispos. 2014;42:685–94. doi: 10.1124/dmd.113.055475. [DOI] [PubMed] [Google Scholar]
- 8.Ito S, et al. N-methylnicotinamide is an endogenous probe for evaluation of drug-drug interactions involving multidrug and toxin extrusions (MATE1 and MATE2-K) Clin Pharmacol Ther. 2012;92:635–41. doi: 10.1038/clpt.2012.138. [DOI] [PubMed] [Google Scholar]
- 9.Watanabe T, et al. Utility of bilirubins and bile acids as endogenous biomarkers for the inhibition of hepatic transporters. Drug Metab Dispos. 2015;43:459–66. doi: 10.1124/dmd.114.061051. [DOI] [PubMed] [Google Scholar]
- 10.International Transporter, C et al. Membrane transporters in drug development. Nat Rev Drug Discov. 2010;9:215–36. doi: 10.1038/nrd3028. [DOI] [PMC free article] [PubMed] [Google Scholar]
- 11.Shin SY, et al. An atlas of genetic influences on human blood metabolites. Nat Genet. 2014;46:543–50. doi: 10.1038/ng.2982. [DOI] [PMC free article] [PubMed] [Google Scholar]
- 12.Suhre K, et al. Human metabolic individuality in biomedical and pharmaceutical research. Nature. 2011;477:54–60. doi: 10.1038/nature10354. [DOI] [PMC free article] [PubMed] [Google Scholar]
- 13.Vitart V, et al. SLC2A9 is a newly identified urate transporter influencing serum urate concentration, urate excretion and gout. Nat Genet. 2008;40:437–42. doi: 10.1038/ng.106. [DOI] [PubMed] [Google Scholar]
- 14.Manolescu AR, Augustin R, Moley K, Cheeseman C. A highly conserved hydrophobic motif in the exofacial vestibule of fructose transporting SLC2A proteins acts as a critical determinant of their substrate selectivity. Mol Membr Biol. 2007;24:455–63. doi: 10.1080/09687680701298143. [DOI] [PubMed] [Google Scholar]
- 15.Ghosal A, Lambrecht N, Subramanya SB, Kapadia R, Said HM. Conditional knockout of the Slc5a6 gene in mouse intestine impairs biotin absorption. Am J Physiol Gastrointest Liver Physiol. 2013;304:G64–71. doi: 10.1152/ajpgi.00379.2012. [DOI] [PMC free article] [PubMed] [Google Scholar]
- 16.Niemi M, Pasanen MK, Neuvonen PJ. Organic anion transporting polypeptide 1B1: a genetically polymorphic transporter of major importance for hepatic drug uptake. Pharmacol Rev. 2011;63:157–81. doi: 10.1124/pr.110.002857. [DOI] [PubMed] [Google Scholar]
- 17.Cui Y, Konig J, Leier I, Buchholz U, Keppler D. Hepatic uptake of bilirubin and its conjugates by the human organic anion transporter SLC21A6. J Biol Chem. 2001;276:9626–30. doi: 10.1074/jbc.M004968200. [DOI] [PubMed] [Google Scholar]
- 18.Johnson AD, et al. Genome-wide association meta-analysis for total serum bilirubin levels. Hum Mol Genet. 2009;18:2700–10. doi: 10.1093/hmg/ddp202. [DOI] [PMC free article] [PubMed] [Google Scholar]
- 19.Sanna S, et al. Common variants in the SLCO1B3 locus are associated with bilirubin levels and unconjugated hyperbilirubinemia. Hum Mol Genet. 2009;18:2711–8. doi: 10.1093/hmg/ddp203. [DOI] [PMC free article] [PubMed] [Google Scholar]
- 20.Zhang W, et al. OATP1B1 polymorphism is a major determinant of serum bilirubin level but not associated with rifampicin-mediated bilirubin elevation. Clin Exp Pharmacol Physiol. 2007;34:1240–4. doi: 10.1111/j.1440-1681.2007.04798.x. [DOI] [PubMed] [Google Scholar]
- 21.Chu X, et al. Evaluation of cynomolgus monkeys for the identification of endogenous biomarkers for hepatic transporter inhibition and as a translatable model to predict pharmacokinetic interactions with statins in humans. Drug Metab Dispos. 2015;43:851–63. doi: 10.1124/dmd.115.063347. [DOI] [PubMed] [Google Scholar]
- 22.Brandoni A, Hazelhoff MH, Bulacio RP, Torres AM. Expression and function of renal and hepatic organic anion transporters in extrahepatic cholestasis. World J Gastroenterol. 2012;18:6387–97. doi: 10.3748/wjg.v18.i44.6387. [DOI] [PMC free article] [PubMed] [Google Scholar]
- 23.Nigam SK, et al. The organic anion transporter (OAT) family: a systems biology perspective. Physiol Rev. 2015;95:83–123. doi: 10.1152/physrev.00025.2013. [DOI] [PMC free article] [PubMed] [Google Scholar]
- 24.Itkonen MK, et al. Clopidogrel Has No Clinically Meaningful Effect on the Pharmacokinetics of the Organic Anion Transporting Polypeptide 1B1 and Cytochrome P450 3A4 Substrate Simvastatin. Drug Metab Dispos. 2015;43:1655–60. doi: 10.1124/dmd.115.065938. [DOI] [PubMed] [Google Scholar]
- 25.Morrissey KM, et al. The Effect of Nizatidine, a MATE2K Selective Inhibitor, on the Pharmacokinetics and Pharmacodynamics of Metformin in Healthy Volunteers. Clin Pharmacokinet. 2016;55:495–506. doi: 10.1007/s40262-015-0332-9. [DOI] [PMC free article] [PubMed] [Google Scholar]
- 26.Kato K, et al. Investigation of endogenous compounds for assessing the drug interactions in the urinary excretion involving multidrug and toxin extrusion proteins. Pharm Res. 2014;31:136–47. doi: 10.1007/s11095-013-1144-y. [DOI] [PubMed] [Google Scholar]
- 27.Chen L, et al. OCT1 is a high-capacity thiamine transporter that regulates hepatic steatosis and is a target of metformin. Proc Natl Acad Sci U S A. 2014;111:9983–8. doi: 10.1073/pnas.1314939111. [DOI] [PMC free article] [PubMed] [Google Scholar]
- 28.Shen H, et al. Coproporphyrins I and III as Functional Markers of OATP1B Activity: In Vitro and In Vivo Evaluation in Preclinical Species. J Pharmacol Exp Ther. 2016 doi: 10.1124/jpet.116.232066. [DOI] [PubMed] [Google Scholar]
- 29.Hagenbuch B, Stieger B. The SLCO (former SLC21) superfamily of transporters. Mol Aspects Med. 2013;34:396–412. doi: 10.1016/j.mam.2012.10.009. [DOI] [PMC free article] [PubMed] [Google Scholar]
- 30.Xiang X, et al. Effect of SLCO1B1 polymorphism on the plasma concentrations of bile acids and bile acid synthesis marker in humans. Pharmacogenet Genomics. 2009;19:447–57. doi: 10.1097/FPC.0b013e32832bcf7b. [DOI] [PubMed] [Google Scholar]
- 31.Keppler D. The roles of MRP2, MRP3, OATP1B1, and OATP1B3 in conjugated hyperbilirubinemia. Drug Metab Dispos. 2014;42:561–5. doi: 10.1124/dmd.113.055772. [DOI] [PubMed] [Google Scholar]
- 32.Morrissey KM, et al. The UCSF-FDA TransPortal: a public drug transporter database. Clin Pharmacol Ther. 2012;92:545–6. doi: 10.1038/clpt.2012.44. [DOI] [PMC free article] [PubMed] [Google Scholar]
- 33.Lai Y, et al. Coproporphyrins in plasma and urine can be appropriate clinical biomarkers to recapitulate drug-drug interactions mediated by OATP inhibition. J Pharmacol Exp Ther. 2016 doi: 10.1124/jpet.116.234914. [DOI] [PubMed] [Google Scholar]
- 34.Rodrigues AD, et al. Drug-induced perturbations of the bile acid pool, cholestasis, and hepatotoxicity: mechanistic considerations beyond the direct inhibition of the bile salt export pump. Drug Metab Dispos. 2014;42:566–74. doi: 10.1124/dmd.113.054205. [DOI] [PubMed] [Google Scholar]
- 35.Han YH, et al. Transporter studies with the 3-O-sulfate conjugate of 17alpha-ethinylestradiol: assessment of human kidney drug transporters. Drug Metab Dispos. 2010;38:1064–71. doi: 10.1124/dmd.109.031526. [DOI] [PubMed] [Google Scholar]
- 36.Shi S, Li Y. Interplay of Drug-Metabolizing Enzymes and Transporters in Drug Absorption and Disposition. Curr Drug Metab. 2014;15:915–41. doi: 10.2174/1389200216666150401110610. [DOI] [PubMed] [Google Scholar]
- 37.Wanders RJ, Komen J, Kemp S. Fatty acid omega-oxidation as a rescue pathway for fatty acid oxidation disorders in humans. FEBS J. 2011;278:182–94. doi: 10.1111/j.1742-4658.2010.07947.x. [DOI] [PubMed] [Google Scholar]
- 38.Tonsgard JH. Serum dicarboxylic acids in patients with Reye syndrome. J Pediatr. 1986;109:440–5. doi: 10.1016/s0022-3476(86)80114-7. [DOI] [PubMed] [Google Scholar]
- 39.Kettunen J, et al. Genome-wide association study identifies multiple loci influencing human serum metabolite levels. Nat Genet. 2012;44:269–76. doi: 10.1038/ng.1073. [DOI] [PMC free article] [PubMed] [Google Scholar]
- 40.Rhee EP, et al. A genome-wide association study of the human metabolome in a community-based cohort. Cell Metab. 2013;18:130–43. doi: 10.1016/j.cmet.2013.06.013. [DOI] [PMC free article] [PubMed] [Google Scholar]
- 41.Tukiainen T, et al. Detailed metabolic and genetic characterization reveals new associations for 30 known lipid loci. Hum Mol Genet. 2012;21:1444–55. doi: 10.1093/hmg/ddr581. [DOI] [PubMed] [Google Scholar]
- 42.Ried JS, et al. Novel genetic associations with serum level metabolites identified by phenotype set enrichment analyses. Hum Mol Genet. 2014;23:5847–57. doi: 10.1093/hmg/ddu301. [DOI] [PMC free article] [PubMed] [Google Scholar]
- 43.Giacomini MM, et al. SLCO1B1 521T > C Genotype affects the cyclosporine-pravastatin interaction. Clin Pharmacol Ther. 2013;93:S27–S27. [Google Scholar]
- 44.Tamraz B, et al. OATP1B1-related drug-drug and drug-gene interactions as potential risk factors for cerivastatin-induced rhabdomyolysis. Pharmacogenet Genomics. 2013;23:355–64. doi: 10.1097/FPC.0b013e3283620c3b. [DOI] [PMC free article] [PubMed] [Google Scholar]
- 45.Picard N, et al. The role of organic anion-transporting polypeptides and their common genetic variants in mycophenolic acid pharmacokinetics. Clin Pharmacol Ther. 2010;87:100–8. doi: 10.1038/clpt.2009.205. [DOI] [PMC free article] [PubMed] [Google Scholar]
- 46.Fujita T, et al. Functional analysis of polymorphisms in the organic anion transporter, SLC22A6 (OAT1) Pharmacogenet Genomics. 2005;15:201–9. doi: 10.1097/01213011-200504000-00003. [DOI] [PubMed] [Google Scholar]
- 47.Dahlin A, et al. Gene expression profiling of transporters in the solute carrier and ATP-binding cassette superfamilies in human eye substructures. Mol Pharm. 2013;10:650–63. doi: 10.1021/mp300429e. [DOI] [PMC free article] [PubMed] [Google Scholar]
- 48.Yee SW, et al. Reduced renal clearance of cefotaxime in asians with a low-frequency polymorphism of OAT3 (SLC22A8) J Pharm Sci. 2013;102:3451–7. doi: 10.1002/jps.23581. [DOI] [PMC free article] [PubMed] [Google Scholar]
- 49.Dong Z, Yang X, Arya V, Zhang L. Comparing various in vitro prediction criteria to assess the potential of a new molecular entity (NME) to inhibit OCT2 and MATE transporters in vivo. Clin Pharmacol Ther. 2016;99:S94–S96. doi: 10.1002/jcph.723. [DOI] [PubMed] [Google Scholar]
- 50.Dong Z, Yang X, Arya V, Zhang L. Comparing various in vitro prediction criteria to assess the potential of a new molecular entity (NME) to inhibit organic anion transporter 1 and 3 (OAT1 and OAT3) in vivo. Clin Pharmacol Ther. 2016;99:S94–S95. doi: 10.1002/jcph.723. [DOI] [PubMed] [Google Scholar]
Associated Data
This section collects any data citations, data availability statements, or supplementary materials included in this article.