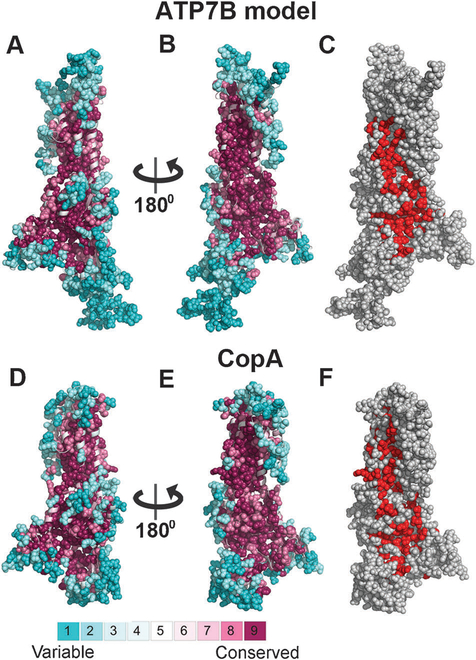
Fig. 1. Conservation analysis of ATP7B and LCopA.
Panels A–B and D–E show side-views of the LCopA structure and ATP7B model in cartoon representation, with the cytoplasm below. The structures are colored according to the ConSurf38 color bar (http://consurf.tau.ac.il), with cyan-to-maroon indicating variable-to-conserved. Positions assigned with the highest or lowest conservation grades (8–9 or 1–2, respectively) are displayed as full atoms spheres, demonstrating the high conservation of the core as opposed to the variability of the peripheral and loop regions. In panels C and F, the LCopA structure and ATP7B model are shown as in panels B and E, respectively, and colored gray, with the functional patches detected by PatchFinder40 in red. Overall, the conservation patterns of the LCopA and ATP7B are remarkably similar, including the location of a highly conserved patch at the proteins’ surface.

