

Abstract
Geometric topographies are known to influence cellular differentiation towards specific phenotypes, but to date the range of features and type of substrates than can be easily fabricated to study these interactions is somewhat limited. In our study, we use an emerging technology, two-photon polymerization, to print topological patterns with varying feature size and thereby study their effect on cellular differentiation. This technique offers rapid manufacturing of topographical surfaces with good feature resolution for shapes smaller than 3 μm. Human induced pluripotent stem cells, when attached to these substrates or a non-patterned control for one week, express an array of genetic markers that suggest their differentiation towards a heterogeneous population of multipotent progenitors from all three germ layers. Compared to the topographically smooth control, small features (1.6 μm) encourage differentiation towards ectoderm while large features (8 μm) inhibit self-renewal. This study demonstrates the potential of using two-photon polymerization to study and control stem cell fate as a function of substrate interactions. The ability to tailor and strategically design biomaterials in this way could enable more precise and efficient generation or maintenance of desired phenotypes in vitro and in vivo.
Keywords: two-photon polymerization, substrate topography, iPSCs, differentiation, 3D printing
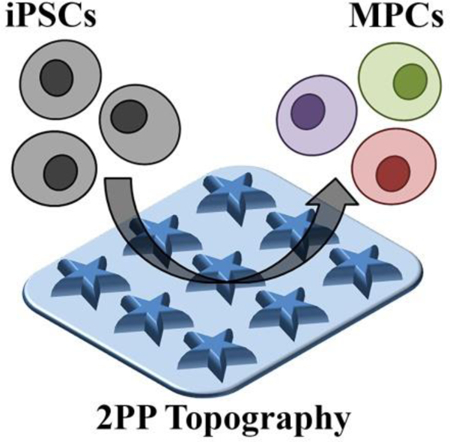
Graphical Abstract
Two-Photon Polymerization of Topological Cues for Human iPSC Differentiation
A growing cohort of studies suggest that surface topography can be used to direct the differentiation of mammalian stem cells to desired phenotypes, even independent of chemical and biological cues.[1–5][6][7][8][9] However, the majority of these works center on mesenchymal stem cells, which are multipotent and thus can only produce a limited subset of cells and tissues. Furthermore, the effects of feature size at the micro- and nano-scale on cellular differentiation are not well understood. Both knowledge gaps are due in part to historical technological limitations [10] that have recently been overcome by advancements in biomaterial fabrication and in stem cell technologies. In this study, we show that two emerging technologies (two-photon polymerization (2PP) and induced pluripotent stem cells (iPSCs)) can be leveraged to better understand the effects of topographical feature size on stem cell differentiation. Two-photon polymerized arrays of five-pointed stars were fabricated with varying subcellular feature sizes to determine the relationship between these surfaces and down-stream gene expression. The use of 2PP enabled rapid fabrication of defined topographies at the subcellular scale, with the desired fabrication speed demanding a decrease in feature resolution, particularly for structures less than 3 μm wide. Compared to a feature-less control, small features encouraged upregulation in genes associated with ectodermal tissues, while large features caused down-regulation of self-renewal markers. These findings suggest that using two-photon polymerization to control topographical feature sizes on the subcellular scale may be a useful mechanism for directing stem cell fate in vitro.
Before studying the effect of 2PP-generated topological cues on iPSC differentiation, we validated the biocompatibility of IP-L 780 (Nanoscribe GmbH); a high-resolution, commercially available photoresist that we elected to use in this study. Incubation with media that was conditioned by exposure to polymerized IP-L 780 for up to seven days did not affect the viability of human iPSCs (Figure S1). These results demonstrate that IP-L 780 is an appropriate choice for various tissue engineering applications and further confirms the photoresist’s favorable biocompatibility demonstrated by several other groups.[11, 12] Furthermore, these researchers and others have also achieved high-resolution and often highly complex 2PP fabrication using IP-L 780,[12] solidifying its place as a highly capable and compatible material for biological and medical materials.
Most assessments of topography-induced stem cell differentiation have utilized relatively simple geometric shapes (e.g. circles and rectangles). These shapes can be and have been somewhat easily fabricated using a myriad of conventional techniques such as micro- and nano-fabrication. However, such simple geometric features are unlikely to be accurate representations of naturally occurring structural cues and thus may fail to recapitulate the level of complexity needed to truly understand cell-material interactions in the context of stem cell fate. For example, rounded cell morphology is a well-known omen of apoptosis (in the case of differentiated, adherent cells), while viable cells more closely resemble star-like shapes with varying number of “points” and height to width ratios. Alternatively, some groups have thoroughly demonstrated the effect of cell-adhesive patterns on MSC fate using patterned monolayers with arrays of five-sided shapes. Together, these studies highlight the role of cytoskeletal changes and focal adhesion in cell fate determination, and suggest a level of complexity that exceeds simple geometries.[13] These studies, however, were also limited in their ability to create sub-cellular features in order to broadly examine the effect of feature geometry on stem cell fate. In our study, arrays of three-dimensional stars with various sub-cellular sizes were readily fabricated by 2PP of IP-L 780 (Figure 1). Regardless of star width, the spacing between each feature within the array matched the designed biaxial (“x” and “y”) center-to-center distance of 10 μm (Figure 1). The IP-L 780 star arrays corresponded to the intended design reasonably well at widths of 8 μm and 3 μm (Figure 1A-C and Figure 1D-F, respectively). However, within the constraints of our experiment shape definition began to fail for stars with widths less than 3 μm (Figure 1G-I). Furthermore, the star-shaped features were roughly 7.7, 6.7 or 5.2 μm tall for stars with widths of approximately 8, 3.2, or 1.6 μm, respectively (Figure 1). These heights were much larger than anticipated, since photoresist exposure only occurred in a single layer. Notably, the relatively constant feature height with decreasing feature width corresponded to approximate aspect ratios (W:H) of 1:1, 1:2 and 1:3.
Figure 1: Characterization of topographical arrays of stars with varying size.
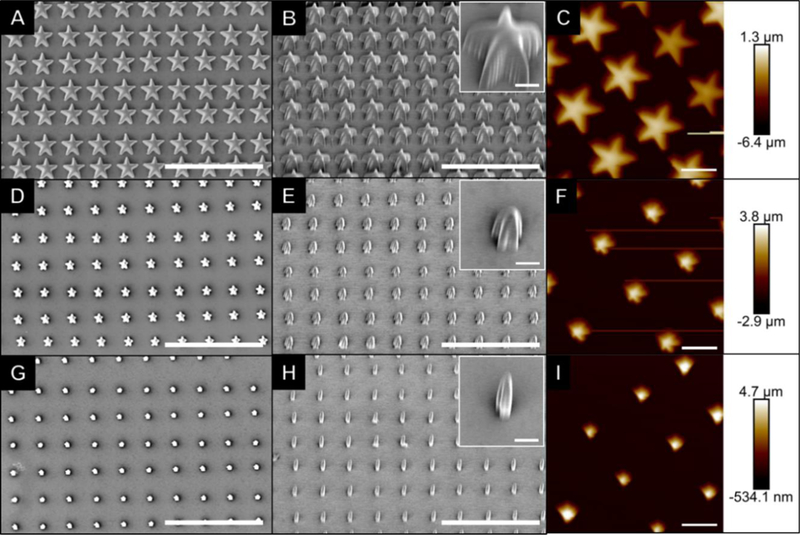
Scale bars in SEM images (A-B, D-E and G-H) represent 30 μm, with inset scale bars representing 2 μm. Scale bars in AFM images (C, F and I) represent 6 μm and the color corresponds to the sample height, as shown in the scale.
In order to study the effects of topological feature size on cellular differentiation, human iPSCs were incubated on these arrays for 7 days and differentiation was analyzed by way of quantitative assessment of gene expression. Because the sample surface area was quite small (~30 mm2), only low quantities of RNA could be extracted from the attached cells and thus, inadequate cDNA prevented the collection of gene expression data under some circumstances (see Table S1 and S2 for a full list of genes analyzed for each sample). In particular, low target quantity hindered satisfactory analysis of cells grown on the 3.2 μm star arrays, so this gene expression dataset has been excluded from further discussion.
No significant differences in expression of self-renewal markers were detected between the remaining 2PP samples and the pluripotent control (Figure 2), indicating that regardless of the topography, these iPSCs retained potency within one week of differentiation. However, the average expression of genes characteristic of ectoderm, mesoderm, and endoderm were upregulated in all cases compared to the pluripotent controls. Specifically, cells grown on arrays of 1.6 μm stars demonstrated statistically significant upregulation for genes characteristic of mesoderm (p < 0.01) and endoderm at (p < 0.05), and those grown on glass alone (no topographical features) also showed significant upregulation of mesoderm-associated genes (p < 0.0001, Figure 2). As expected, these results, paired with the self-renewal findings, suggest that the originally pluripotent cells had differentiated into a heterogeneous mixture of multipotent cells during the first week of culture.
Figure 2. Relative gene expression of cells grown on topographical arrays of stars with varying size compared to a pluripotent population.
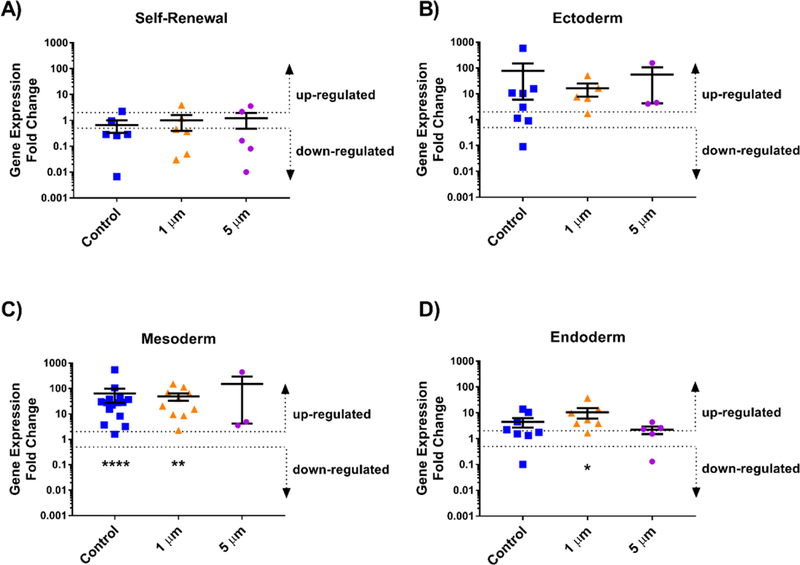
Human iPSCs were incubated with varying size topographies and analyzed using a TaqMan hPSC Scorecard to determine relative expression of genes associated with A) Self-renewal, B) Ectoderm, C) Mesoderm, and D) Endoderm compared to the pluripotent Scorecard control, which was normalized to a value of 1. Average expression above a 2-fold change was considered upregulated while expression below a 0.5-fold change was considered downregulated for each group of genes. Wilcoxon Signed Rank tests were used to statistical significance with * p < 0.05, ** p < 0.01, and ****p< 0.0001. Error bars represent standard deviation.
Normalizing gene expression to the glass control (rather than a population of pluripotent cells) facilitated a closer examination of the effect of feature size on topographically-driven differentiation (Figure 3). Interestingly, 1.6 μm stars seemed to encourage upregulation in genes associated with ectoderm, suggesting that in our study, small star-shaped features promoted differentiation towards multipotent ectodermal lineages (e.g., neuronal progenitors) to a greater extent than a flat surface alone. Conversely, cells grown on 8 μm stars had downregulated expression of genes characteristic of self-renewal, indicating that the larger star-shaped cues stimulated heterogeneous differentiation and loss of potency more than a smooth surface with no features. Although these differences in expression were not statistically significant, the data do suggest that 2PP topographies can be used to direct stem cell fate and that the size, either width or aspect ratio, of these features plays a role in determining ultimate lineage.
Figure 3: Relative gene expression of cells grown on topographical arrays of stars with varying size compared to those grown on a flat control.
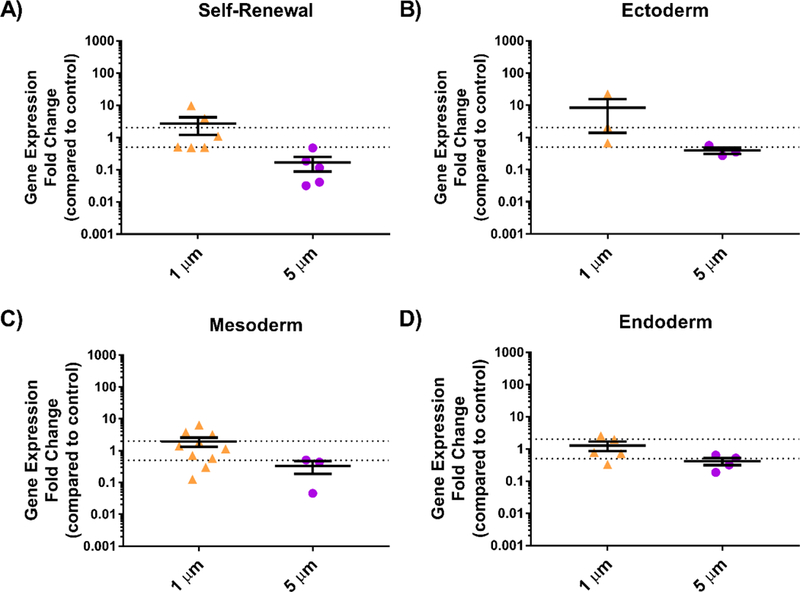
Human iPSCs were incubated with varying sized topographies and analyzed using a TaqMan hPSC Scorecard to determine relative expression of genes associated with A) Self-renewal, B) Ectoderm, C) Mesoderm, and D) Endoderm compared to glass control, which were normalized to a value of 1. Average expression above a 2-fold change was considered upregulated while expression below a 0.5-fold change was considered downregulated for each group of genes. Each data point represents an average for one gene (n = 1, 2, or 3); error bars represent standard deviation.
Ideally, cells would be equally likely to bind to the glass and polymer so as to isolate topographical factors without consideration of biochemical cues. In practice, this is unlikely to be the case for the samples we created here. Poly-D-lysine is a charge enhancer, facilitating adsorption of laminin to glass surfaces and likely boosting adsorption on polymer surfaces. In our experience, coating glass substrates with poly-D-lysine and laminin does enable iPSC adhesion to the surface. However, this adhesion is typically much weaker than for similarly treated polymer surfaces (e.g., tissue-culture plastic). Thus, we suspect that the polymer surfaces had a higher affinity for cell attachment than the glass substrate, a phenomenon likely related to a difference in protein adsorption between the two groups. To alleviate this issue in the future, substrates could be exposed to oxygen plasma after fabrication but prior to protein coating. Theoretically, plasma treatment would expose reactive groups (i.e., hydroxyl moieties) on the glass surface that would facilitate greater adsorption of poly-D-lysine and subsequent laminin and cell adhesion.
In general, our findings agree with those of other studies that suggest that substrate roughness, feature size and height play a role in directing stem cell fate.[14–17] This phenomenon can likely be attributed in part to the density and location of focal adhesion points, the protein complexes responsible for connecting cells to the ECM.[18] In our study, surfaces with smaller features (1.6 μm) had more flat surface area available for cellular attachment and less potential disruptions in cell-cell adhesion than their larger (8 μm) counterparts. Furthermore, the effect of feature aspect ratio should be included as a potential contributor to cell fate determination, as its influence on mesenchymal stem cell fate has been previously described.[19][20] This and a plethora of other topographical variables and their interactions could affect cell fate. While our experiments were designed in an effort to isolate a single variable (feature size), the phenomena we observed cannot be attributed to any one distinct geometric variable since aspect ratio and space between features varied concomitantly with feature width. Thus, future studies should focus on distinguishing the influence of feature aspect ratio, planar size (e.g., width), and spacing in order to clarify which parameter is truly driving differences in pluripotent stem cell differentiation.
Our results clearly demonstrate the ability of 2PP to fabricate complex 2D geometric star arrays that can be used to assess the role of topographical cues in mammalian cell fate. Thus, the level of geometric complexity and dimensional control appropriate for studying topographically-induced stem cell fate is tangible through the use of two-photon polymerization. We, and others who choose to use this approach, are now poised to more deeply explore the effect of many additional variables (e.g. feature curvature and chemistry) on differentiation tendency and to elucidate the mechanisms by which they act to control cell fate. For example, cell size, focal adhesion, cytoskeletal changes, and chromatin remodeling will all be useful analytical targets that will enable true understanding of which geometric factors contribute to stem cell fate and how these cues propagate through cell signaling pathways. This information could then be used to tune cell-material interactions. For example, differentiation tendencies that are driven by topographical cues could be leveraged alone (i.e., without exogenous factors) or synergistically with biochemical cues to precisely control stem cell fate in vitro and in vivo. If achieved, this ability to govern cell specificity using biomaterial surface topography would enable researchers and clinicians to generate sufficient numbers of patient- and tissue-specific cell types in vitro more efficiently and affordably than current techniques allow. Once these behaviors are thoroughly understood, specific topographical features that direct cells towards desired phenotypes could also be incorporated into cell and tissue scaffolds to modulate cell identity before and after in vivo transplantation.
Experimental Section
Topography Design:
To study the effect of size on iPSC differentiation, we selected one shape (a five-pointed star) with surface area equivalent to a circle with diameter of 1 μm and varied its width by a factor of 2 or 5, which yielded widths of 1.6, 3.2 or 8.0 μm, respectively. For each distinct feature size, a series of commands was written in the Nanoscribe command software (DeScribe) such that the shapes, when printed, would occur in a square array with overall dimensions approximating an octagon with a width of 6 mm. Regardless of size, the center of each feature of the array was spaced 10 μm from the center of its nearest neighbor.
Two-photon Polymerization:
A Photonic Professional GT System (Nanoscribe GmbH, Germany) was used to create the high resolution topographical features described above. Glass coverslips (30 mm d.; #1.5; CS-30R, Warner Instrument, Hamden, CT) were used as fabrication substrates. For each array, a coverslip was secured to the sample holder and a drop of oil (Immersol 518 F, Carl Zeiss; Inc Oberkochen, Germany) was applied to the bottom in the center. A droplet of photoresist (IP-L-780, Nanoscribe) was placed on the top, in the center of the coverslip, and the sample holder was inserted into the instrument. Each array was printed at 100% laser power and a scanning speed of 50 mm s−1 using regular 3D direct-laser-writing and a 25X objective (NA = 0.8). Once printing was complete, the substrate was removed from the sample holder, then submerged in 25 mL propylene glycol monomethyl ether acetate (Sigma-Aldrich, St. Louis, MO) for 15 minutes, followed by two five-minute submersions in 25 mL isopropyl alcohol (Sigma-Aldrich). Each sample was then air-dried overnight and stored in the dark at room temperature until use.
Topography Characterization:
The morphology of the printed devices was examined using scanning electron microscopy (SEM). Samples were adhered to a segment of a standard glass slide and mounted on an aluminum stub using double-sided carbon tape. These samples were then dried overnight in ambient air for 24 h prior to being coated with gold-palladium using an argon beam K550 sputter coater (Emitech Ltd., Kent, England) at 35 mA for 1.5 minutes. Once coated, samples were imaged using a Hitachi S-4800 SEM (Hitachi High-Technologies, Tokyo, Japan) at an accelerating voltage of 1 kV. Atomic force micrographs (AFM) were collected using a Bruker BioResolve with Peak Force Tapping (Bruker, location) equipped with a ScanAsyst in Air probe (Bruker) at a peak force amplitude of 350 nm and peak force frequency of 2 kHz.
Cell Culture Preparation:
Each sample was transferred to a 6 well plate and sterilized in 70% ethanol for 15 minutes, followed by three washes with 1X PBS. Samples were then incubated with 1.5 mL of poly-d-lysine hydrobromide solution (0.1 mg mL−1 in sterile water) at 4°C overnight. After overnight incubation, the poly-d-lysine solution was aspirated, and the samples were washed with sterile water. Meanwhile, 6 mm glass cloning cylinders (Sigma-Aldrich) were sterilized by submersion in 70% ethanol overnight followed by three washes with 1X PBS. These were then air-dried in a sterile environment for approximately 15 minutes prior to their use. Vacuum grease was sterilized by exposure to UV light (3 W cm−2 for 90 seconds, Omnicure Series 2000 equipped with 8 mm liquid light guide, Excelitas Technologies, Waltham, MA), then applied to one end of the cloning cylinder, without greasing the interior of the cylinder, and then placed directly over the printed structures. The cylinders were then gently pressed down to ensure adhesion to the glass coverslip. Finally, 50 μL of recombinant human laminin 521 solution (50 μg mL−1 in HBSS +/+) were added to each cylinder and the samples were incubated overnight.
Cell Culture and Seeding:
Prior to being seeded onto the laminin-coated 2PP substrates, human iPSCs (episomally derived, Gibco, Brooklyn, NY) were cultured on laminin-coated 6-well tissue culture plates with Essential 8 (E8) Flex Medium containing 10 ng mL−1 human recombinant fibroblast growth factor (FGF, Gibco) and 1 mg mL−1 Primocin (InvivoGen, San Diego, CA). At the time of seeding, cells were washed twice with 1X PBS, dislodged from the plate via incubation with 1 mL EDTA (0.48 mM) in PBS (Versene, Gibco) at room temperature followed by gentle washing and suspension in differentiation media [10% heat-inactivated FBS (Gibco) and 1 mg mL−1 of Primocin in DMEM medium (Gibco)]. Cells (~75% confluent) were then plated on the 2PP topographical samples at a density of 1:6.
Material Cytotoxicity:
To verify the biocompatibility of IP-L-780, thin (50 μm) discs of this material were created using UV polymerization and subsequently incubated with differentiation media to create conditioned differentiation media. Briefly, one droplet of IP-L-780 was placed between two Rain-X ®-coated 30 mm glass coverslips. This construct was exposed to UV light at an intensity of 1.5 W cm−2 for 15 seconds (Omnicure, at a distance of 2 inches from the end of the light guide intensity measured at the source). The coverslips were then delaminated, the thin film was removed, and discs were created using a 4 mm biopsy punch. The resulting samples were immersed in 70% ethanol, rinsed three times in 1X PBS, and incubated in differentiation media at 37°C and 5% CO2 for 1 – 7 days to create conditioned media. Cells were seeded in a tissue culture treated 96-well plate as described above and fed with the conditioned media after 24 hours. After another 24 hours of incubation, cells were tested for cell viability using an MTS assay (CellTiter 96®, Promega, Madison, WI) and a SpectraMax plus 384 Microplate spectrophotometer (Molecular Devices, Sunnyvale, CA).
Gene Expression:
RNA was extracted from iPSCs after 7 days of incubation in various topographies using a NucleoSpin RNA XS RNA isolation kit (Macherey-Nagel, Mountain View, CA). Complementary DNA (cDNA) was made with the SuperScript VILO cDNA Synthesis Kit (Invitrogen). The TaqMan hPSC Scorecard Assay was used to determine relative gene expression of iPSCs cultured on the varying topographies. Quantitative PCR was performed using a QuantStudio 6 Flex Real-Time PCR System (Thermo Fisher). The run consisted of a hold at 50°C for 2 minutes, then 95°C for 10 minutes, followed by 15 seconds of melting at 95°C, and annealing/extending at 60°C for 40 cycles.
Cellular Differentiation and Statistical Analyses:
Gene expression data was exported from the hPSC Scorecard Analysis provided by Thermo Fisher Cloud and data was filtered to exclude wells with threshold cycles of 40 (no target detected). When comparing gene expression of topographical features to the non-patterned control, fold change was calculated as follows:
| (1) |
| (2) |
| (3) |
Where the subscripts C, i, and j represent the non-patterned control, a given feature size, and a gene of interest, respectively. Ct,ACTB represents the average threshold cycle for the house-keeping gene beta-actin for a given sample (C or i). Normality was assessed using the D’Agostino & Pearson normality test and the values were then compared using Wilcoxon signed-Rank tests that compared the values to the control (either pluripotent or glass alone) at a value of “1.” Kruskal-Wallis tests were also completed to determine if groups were statistically different from one another. All statistical analyses were performed at a 95% confidence interval.
Supplementary Material
Acknowledgements
We acknowledge financial support from the National Institutes of Health (1 R01 024605–01, 1 DP2 OD007483–01, 5P30CA086862), the Lyle and Sharon Bighley Chair of Pharmaceutical Sciences, The University of Iowa Graduate College and the Roy J. Carver Charitable Trust (Grant #18–5045). Scanning electron microscopy (NIH Shared Instrumentation Grant 1 S10 RR022498–01) was performed in the University of Iowa Central Microscopy Facility, a core resource supported by the Vice President for Research and Economic Development, the Holden Comprehensive Cancer Center, and the Carver College of Medicine.
Footnotes
Supporting Information
Supporting Information is available from the Wiley Online Library or from the author.
Joint first authors
Contributor Information
Prof. Kristan S. Worthington, Department of Biomedical Engineering, College of Engineering, University of Iowa, Iowa City, IA 52242, USA.
Dr. Anh-Vu Do, Department of Pharmaceutics and Translational Therapeutics, College of Pharmacy, The University of Iowa, Iowa City, IA 52242, USA.
Rasheid Smith, Department of Pharmaceutics and Translational Therapeutics, College of Pharmacy, The University of Iowa, Iowa City, IA 52242, USA.
Prof. Budd A. Tucker, Institute for Vision Research, Department of Ophthalmology and Visual Science, Carver College of Medicine, The University of Iowa, Iowa City, IA 52242, USA
Prof. Aliasger K. Salem, Department of Pharmaceutics and Translational Therapeutics, College of Pharmacy, The University of Iowa, Iowa City, IA 52242, USA
References
- 1.Abagnale G; Sechi A; Steger M; Zhou Q; Kuo C-C; Aydin G; Schalla C; Müller-Newen G; Zenke M; Costa IG; van Rijn P; Gillner A; Wagner W, Stem Cell Reports 2017, 9 (2), 654–666. DOI 10.1016/j.stemcr.2017.06.016. [DOI] [PMC free article] [PubMed] [Google Scholar]
- 2.M.J. D; M.O. R; H. J; S. A; A.S.G C, Cell Biology International 2004, 28 (3), 229–236. DOI doi: 10.1016/j.cellbi.2003.12.004. [DOI] [PubMed] [Google Scholar]
- 3.Schellenberg A; Joussen S; Moser K; Hampe N; Hersch N; Hemeda H; Schnitker J; Denecke B; Lin Q; Pallua N; Zenke M; Merkel R; Hoffmann B; Wagner W, Biomaterials 2014, 35 (24), 6351–6358. DOI 10.1016/j.biomaterials.2014.04.079. [DOI] [PubMed] [Google Scholar]
- 4.Gattazzo F; Urciuolo A; Bonaldo P, Biochimica et Biophysica Acta 2014, 1840 (8), 2506–2519. DOI 10.1016/j.bbagen.2014.01.010. [DOI] [PMC free article] [PubMed] [Google Scholar]
- 5.Abagnale G; Steger M; Nguyen VH; Hersch N; Sechi A; Joussen S; Denecke B; Merkel R; Hoffmann B; Dreser A; Schnakenberg U; Gillner A; Wagner W, Biomaterials 2015, 61, 316–326. DOI 10.1016/j.biomaterials.2015.05.030. [DOI] [PubMed] [Google Scholar]
- 6.Dalby MJ; Gadegaard N; Tare R; Andar A; Riehle MO; Herzyk P; Wilkinson CDW; Oreffo ROC, Nat. Mater. 2007, 6, 997 DOI 10.1038/nmat2013 10.1038/nmat2013https://www.nature.com/articles/nmat2013#supplementary-informationhttps://www.nature.com/articles/nmat2013#supplementary-information . [DOI] [PubMed] [Google Scholar]
- 7.Marco A; Ada CAE; Roman G; Jacques B; Wolfgang E; Martin K; Horst K; P. SJ, ChemPhysChem 2004, 5 (3), 383–388. DOI doi: 10.1002/cphc.200301014. [DOI] [PubMed] [Google Scholar]
- 8.Takeuchi K; Saruwatari L; Nakamura HK; Yang JM; Ogawa T, J Biomed Mater Res A 2005, 72 (3), 296–305. DOI 10.1002/jbm.a.30227. [DOI] [PubMed] [Google Scholar]
- 9.Metavarayuth K; Sitasuwan P; Zhao X; Lin Y; Wang Q, ACS Biomaterials Science & Engineering 2016, 2 (2), 142–151. DOI 10.1021/acsbiomaterials.5b00377. [DOI] [PubMed] [Google Scholar]
- 10.M. AN; Iva P; L. RR; F. MJ, Small 2010, 6 (20), 2208–2220. DOI doi: 10.1002/smll.201000233. [DOI] [PubMed] [Google Scholar]
- 11.Olsen MH; Hjorto GM; Hansen M; Met O; Svane IM; Larsen NB, Lab on a chip 2013, 13 (24), 4800–9. DOI 10.1039/c3lc50930c. [DOI] [PubMed] [Google Scholar]
- 12.Spagnolo B; Brunetti V; Lemenager G; De Luca E; Sileo L; Pellegrino T; Paolo Pompa P; De Vittorio M; Pisanello F, Scientific reports 2015, 5, 10531 DOI 10.1038/srep10531. [DOI] [PMC free article] [PubMed] [Google Scholar]
- 13.Kilian KA; Bugarija B; Lahn BT; Mrksich M, Proceedings of the National Academy of Sciences of the United States of America 2010, 107 (11), 4872–7. DOI 10.1073/pnas.0903269107. [DOI] [PMC free article] [PubMed] [Google Scholar]
- 14.Emmajayne K; Kate W; Nikolaj G; J. DM; C. ORO, Small 2013, 9 (12), 2140–2151. DOI doi: 10.1002/smll.201202340. [DOI] [PubMed] [Google Scholar]
- 15.Massumi M; Abasi M; Babaloo H; Terraf P; Safi M; Saeed M; Barzin J; Zandi M; Soleimani M, Tissue Eng Part A 2012, 18 (5–6), 609–20. DOI 10.1089/ten.TEA.2011.0368. [DOI] [PMC free article] [PubMed] [Google Scholar]
- 16.Wang A; Tang Z; Park I-H; Zhu Y; Patel S; Daley GQ; Li S, Biomaterials 2011, 32 (22), 5023–5032. DOI 10.1016/j.biomaterials.2011.03.070. [DOI] [PMC free article] [PubMed] [Google Scholar]
- 17.Lapointe VL; Fernandes AT; Bell NC; Stellacci F; Stevens MM, Advanced healthcare materials 2013, 2 (12), 1644–50. DOI 10.1002/adhm.201200382. [DOI] [PMC free article] [PubMed] [Google Scholar]
- 18.Wu C, Cell adhesion & migration 2007, 1 (1), 13–18. [DOI] [PMC free article] [PubMed] [Google Scholar]
- 19.Yao X; Peng R; Ding J, Biomaterials 2013, 34 (4), 930–939. DOI 10.1016/j.biomaterials.2012.10.052. [DOI] [PubMed] [Google Scholar]
- 20.Kilian KA; Bugarija B; Lahn BT; Mrksich M, Proceedings of the National Academy of Sciences of the United States of America 2010, 107 (11), 4872–4877. DOI 10.1073/pnas.0903269107. [DOI] [PMC free article] [PubMed] [Google Scholar]
Associated Data
This section collects any data citations, data availability statements, or supplementary materials included in this article.