Abstract
Sandhoff disease (SD) results from mutations in the HEXB gene, subsequent deficiency of N-acetyl-β-hexosaminidase (Hex) and accumulation of GM2 gangliosides. SD leads to progressive neurodegeneration and early death. However, there is a lack of established SD biomarkers, while the pathogenesis etiology remains to be elucidated. To identify potential biomarkers and unveil the pathogenic mechanisms, metabolomics analysis with reverse phase liquid chromatography (RPLC) was conducted. A total of 177, 112 and 119 metabolites were found to be significantly dysregulated in mouse liver, mouse brain and human hippocampus samples, respectively (p<0.05, ID score >0.5). Principal component analysis (PCA) analysis of the metabolites showed clear separation of metabolomics profiles between normal and diseased individuals. Among these metabolites, dipeptides, amino acids and derivatives were elevated, indicating a robust protein catabolism. Through pathway enrichment analysis, we also found alterations in metabolites associated with neurotransmission, lipid metabolism, oxidative stress and inflammation. In addition, N-acetylgalactosamine 4-sulphate, key component of glycosaminoglycans (GAG) was significantly elevated, which was also confirmed by biochemical assays. Collectively, these results indicated major shifts of energy utilization and profound metabolic impairments, contributing to the pathogenesis mechanisms of SD. Global metabolomics profiling may provide an innovative tool for better understanding the disease mechanisms, and identifying potential diagnostic biomarkers for SD.
Keywords: Sandhoff disease, GM2 gangliosidosis, metabolomics, biomarker
1. INTRODUCTION
Sandhoff disease (SD) is a lipid storage disorder and belongs to the genetically heterogeneous group of lysosomal diseases. SD results from mutations in the HEXB gene, which leads to the deficiency of β-hexosaminidase (Hex; EC 3.2.1.52) and subsequent accumulation of GM2 gangliosides [1]. Currently, there are no cure for SD, with palliative measures being the standard of care. The clinical symptoms of SD are characterized by progressive muscle/motor weakness, blindness, deafness, neurodegeneration and early death [2]. However, the etiology of SD remains to be elucidated due to its complexity.
Metabolomics analysis has been used to decipher disease mechanisms and identify biomarkers for mucopolysaccharidosis type III (MPS III) disease [3,4] and Pompe disease [5]. Compared with traditional gene expression profiling, e.g., microarray, metabolomics analysis is more straightforward because it measures the metabolites, which directly reflect biochemical activity and phenotype. Moreover, since lysosomal diseases are inherited disorder of metabolism, metabolomics profiling will enhance our understanding of the global changes underlying the disease progression.
In this study, we performed a global metabolomics profiling of the liver and brain from SD mice and hippocampus from human patients using LC-MS. Brain and hippocampus were chosen due to the severity of neurological disorders of SD. Liver was chosen for study because of the limited number of cell types, and its central role in metabolism. We identified 177, 112 and 119 metabolites that were significantly dysregulated in the brain and liver of SD mice, and the hippocampus of SD patients, respectively. Further analysis of these metabolites with bioinformatics tools revealed alterations in pathways associated with the metabolites. This approach of screening identified potential biomarkers of SD that may reveal specific protein signatures indicating SD risk. These might also be useful for prognosis, and providing outcome measures for assessing response to therapies.
2. MATERIALS AND METHODS
2.1. Sample collection and processing
Sandhoff mice (hexb−/−), purchased from the Jackson Laboratory, were generated by inserting a neomycin resistance cassette into exon 13 of the HEXB gene on the 129S4/SvJae background [6]. Sandhoff mice (hexb−/−) and control mice were genotyped by PCR. All mouse care and handling procedures were in compliance with the rules of the Institutional Animal Care and Use Committee (IACUC) of the University of Minnesota. Liver and brain samples were harvested from Sandhoff (hexb−/−) and heterozygous (hexb−/+) mice (n=3 each group, 3-month old).
Hippocampus samples of SD patients (n=2, hexb−/−, age 1 to 2, male) and unaffected controls (n=3, hexb+/+, age 1–2, male) were obtained from Maryland Depository, NIH NeuroBioBank (https://neurobiobank.nih.gov/). No identifiable information was retrieved [7].
2.2. Global metabolic profiling with RPLC
All samples were analyzed using LC-MS by reversed phase chromatography on a 0.5 × 100 mm PLRPS column using 0.1% formic acid in water (A) and 0.1% formic acid in acetonitrile (B) as solvents [8]. The samples were extracted in 3 volumes of 80% methanol in a TissueLyser II using 4 mm stainless steel balls at 20 Hz for 10 minutes. The solids were collected by centrifugation, and then the supernatant was filtered through a 0.8 μm spin filter. Samples were injected onto the LC-MS and data was acquired in polarity switching mode with data dependent acquisition of MS/MS spectra.
2.3. Raw data analysis
Raw data files were converted to mz5 format using ProteoWizard version pwiz: 3.0.10273. Feature finding (a/k/a peak picking) was performed using Elements 1.3.1 (Proteome Software Inc., Portland, OR). Feature finding was conducted over a mass range of (50 to 1,200) and the entire retention time range. A noise threshold value of 0.01% of max signal and a minimum time between scans of 0.5 second was used. MS2 spectra were detected for some features. Candidate metabolite identifications were generated by matching experimental data to spectral library data using exact mass with a mass tolerance of 20.0 ppm. If both the experimental and library data contained MS2 spectra, MS2 peaks were matched between experimental and library spectra using a fragment mass tolerance of 0.5 Da. Features that did not match to any metabolites contained in the spectral libraries were categorized as “Unknown Metabolites”. To assess confidence in candidate metabolite identifications, an ID score (0 to 1) was calculated from individual feature: library entry matches, incorporating mass accuracy, isotopic distribution, and fragmentation pattern.
2.4. Pathway enrichment analysis
The metabolites identified were analyzed with principal component analysis and hierarchical clustering through Elements 1.3.1 (Proteome Software Inc., Portland, OR). To determine pathways that significantly enriched, these metabolites were assessed by IMPaLA (Integrated Molecular Pathway Level Analysis; http://impala.molgen.mpg.de/) [9] and MetaboAnalyst [10]. To visualize global patterns of metabolic pathway alterations, the metabolites identified were also mapped in a targeted manner using the Metscape application (http://metscape.ncibi.org/) [11] within the Cytoscape platform (http://www.cytoscape.org/) [12].
3. Results
3.1. RPLC analysis identifies unique metabolomics profiles of SD disease
Metabolomics profiling of liver and brain samples from SD mice (n=3) and normal mice (n=3) were performed through RPLC. The age of these mice were approximately 3-month-old, when the SD mice start to exhibit symptoms. More than 5,000 metabolites (ID score>0.5) were identified and quantified. A total of 177 metabolites were found to be significantly dysregulated in mouse liver samples (p<0.05, ID score>0.5). Out of these 177 metabolites, 96 (54.2%) out were significantly upregulated, while 81 (45.8%) were downregulated in SD mouse liver. Similarly, a total of 112 metabolites were found to be dysregulated in mouse brain samples (p <0.05, ID score>0.5). Out of these 112 metabolites, 53 (47.3%) were significantly upregulated, while 59 (52.7%) were downregulated in SD mouse brain. Further, the same technology was applied with hippocampus samples from human SD patients (n=2) and normal controls (n=3). A total of 119 metabolites were found to be significantly dysregulated in human hippocampus samples (p<0.05, ID score>0.5). Out of these 119 metabolites, 94 (70.6%) were significantly upregulated, while 35 (29.4%) were downregulated.
Principal component analysis (PCA) of the metabolites showed clear separation of metabolomics profiles in mouse brain, mouse liver and human hippocampus samples (Figure 1A). It indicates the existence of a species-specific and tissue-specific metabolomics profile. More importantly, there is a significant separation between mutant and normal control in human hippocampus (Figure 1B), mouse brain (1C) and mouse liver (1D). Additionally, the heat map analysis also identified the significant separation between SD and control samples (data not shown). These clear divisions indicate that the detected metabolomics abnormalities are highly likely be SD associated and that global metabolomics profiling may have potential for the identification of pathological metabolomics signatures during SD progression.
Figure 1. Principal component analysis showed unique metabolomics profiles of SD mice and patients.
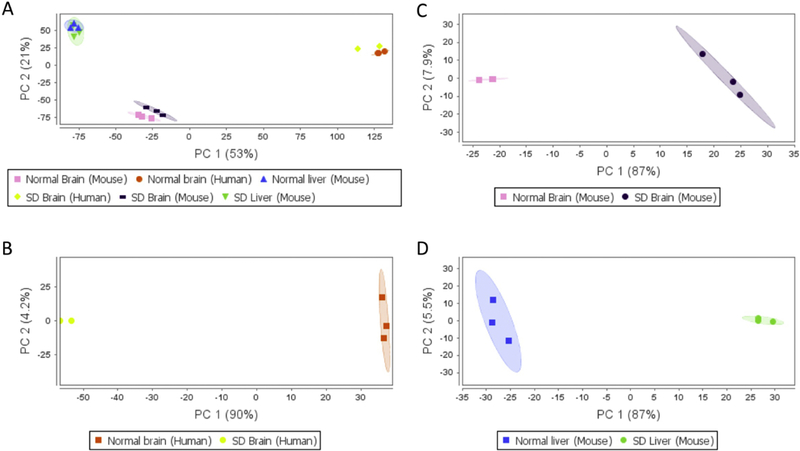
(A) Comparison between all groups; (B) Comparison between brain samples of human SD patients and normal controls; (C) Comparison between brain samples of SD and normal mice; (D) Comparison between liver samples of SD and normal mice.
3.2. Metabolomics profiling reveals profound abnormalities
Among the metabolites identified, elevation of many amino acids, amino acid derivatives and dipeptides was observed, indicating increased protein catabolism. In mouse brain samples, many lipids, fatty acids and derivatives were reduced, including docosahexaenoic acid, arachidonic acid, lysoPC (16:0) and polyoxyethylene dioleate. Similar observations were found in human hippocampus and mouse liver samples. In summary, alterations in protein catabolism and lipid metabolism were identified, which are consistent with previous findings in MPS I and MPS VII mice [13].
Specifically, several metabolites warrant further discussions. In mouse liver samples, N-acetylgalactosamine 4-sulphate, also known as GalNAc4S, increased by 2.17 fold compared with normal controls (p<0.05). N-acetylgalactosamine 4-sulphate is key component of glycosaminoglycans (GAG) including dermatan, keratan and chondroitin sulfate), and is found in elevated concentrations in the urine of MPS patients. More interestingly, since Hex enzyme may also cleave GAG, mice and cats with SD showed GAG accumulation and MPS-like phenotype [14,15]. The increase in N-acetylgalactosamine 4-sulphate may be a side effect of Hex enzyme deficiency. Significant higher total GAG levels in the brain and liver of SD mice compared with normal mice were also found using tissue GAG assays (Figure 2). Therefore, GAG can be used as a novel biomarker of SD. N-Acetyl-L-aspartic acid, downregulated in hippocampus of SD patients, is a neuronal osmolyte involved in fluid balance in the brain. N-Acetyl-L-aspartic acid is also involved in energy production from glutamate in neuronal mitochondria. Further, L-Glutamic acid, downregulated in hippocampus of SD patients, functions as an excitatory neurotransmitter. Additionally, aminoadipic acid, which antagonizes neuroexcitatory activity regulated by the glutamate receptor, was upregulated in hippocampus of SD patients. These results showed that the excitatory neurotransmission mediated by L-Glutamic acid was impaired. It has been shown that GM1 gangliosides inhibited neurotransmission [16]. Moreover, the impairment of neurotransmission was found to be associated with neurodegeneration [17] and excitotoxicity [18]. Therefore, the dysregulation of neurotransmission related metabolites indicate the role of neurotransmission in the neuropathogenesis of SD. Notably, aminoadipic acid has been identified as a biomarker of oxidative stress [19]. Together with the fact that oxidative stress has been implicated in many neurodegenerative diseases [20], the dysregulation of oxidative stress-related biomarkers indicates the involvement of oxidative stress in SD progression. Oxidized glutathione was found to be upregulated in both liver and brain samples of SD mice, further confirming the role of oxidative stress.
Figure 2. GAG was confirmed to be a potential biomarker of SD.
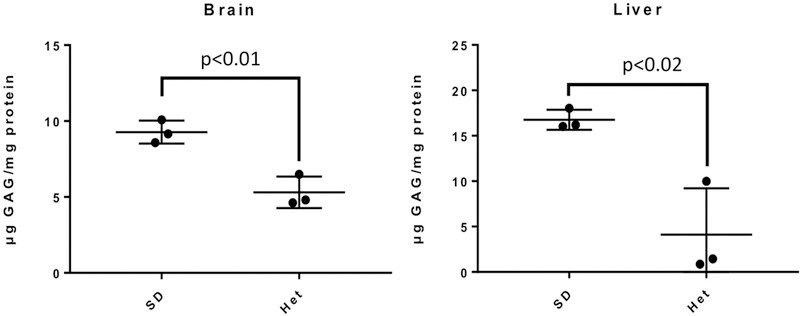
Tissue GAG assays were performed with brain and liver samples from SD (n=3) and heterozygous normal mice (n=3). Data are mean ± standard errors. Student’s t-test was applied.
3.3. Pathway enrichment analysis of the metabolites identified
Through bioinformatics analysis with IMPaLA and MetaboAnalyst, 45, 113 and 64 pathways were significantly enriched in the metabolites dysregulated in mouse brain, liver and human hippocampus samples, respectively (adjusted p<0.05). Among these pathways, 25 were shared among these groups (listed in Table 1). These enriched pathways include glutamate metabolism, glutathione metabolism, reactive oxidative species (ROS) degradation and amino acid metabolism. These results indicate alterations in antioxidant responses, neurotransmission, inflammation, gene expression and protein catabolism.
Table 1.
Common pathways involved among mouse liver, brain and human hippocampus.
| Glutamate glutamine metabolism |
One carbon metabolism and related pathways |
| Glutathione metabolism | 5-Oxoprolinase deficiency |
| Glutathione redox reactions II | Ascorbate recycling (cytosolic) |
| Glutathione synthetase deficiency |
Succinic semialdehyde dehydrogenase deficiency |
| Glutathione biosynthesis | Urea cycle and metabolism of arginine_ proline_ glutamate_ aspartate and asparagine Sulfation biotransformation reaction |
| Reactive oxygen species degradation |
5-Oxoprolinuria |
| Cellular responses to stress | Synthesis of 12-eicosatetraenoic acid derivatives |
| Gamma-glutamyl-transpeptidase deficiency |
Gamma-glutamyltransferase deficiency |
| Amino acid metabolism | Homocarnosinosis |
| Purine metabolism | Acyl chain remodeling of CL |
| 4-Hydroxybutyric aciduria/succinic semialdehyde dehydrogenase deficiency |
Vitamin C (ascorbate) metabolism |
| 2-Hydroxyglutric aciduria (D And L Form) |
Sulfur amino acid metabolism |
| Sulfation biotransformation reaction |
Moreover, Cytoscape was used to visualize the pathways associated with SD. As shown in Figure 3, pathways enriched in mouse liver samples include pyrimidine metabolism, arachidonic acid metabolism, glycerolphospholipid metabolism, omega-6 fatty acid metabolism and metabolism of many amino acids. Through Metascape plugin in the Cytoscape, the interaction between these metabolites and proteins as well as genes were also illustrated. These interactions indicate how changes at metabolomics, proteomics and genetics levels together contribute to Sandhoff disease etiology.
Figure 3. Network analysis with Cytoscape revealed interactions between metabolites, proteins and genes.
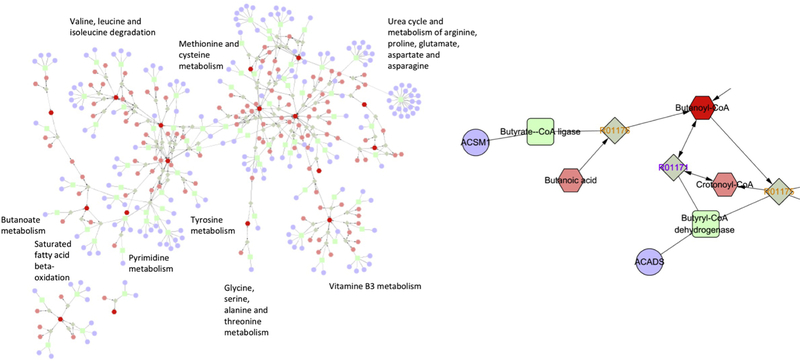
Genes were illustrated in circle, enzymes in rectangular, reactions in square, and metabolites in hexagon. The results shown were analysis of mouse brain samples, while analyses of mouse liver and human hippocampus samples yielded similar results.
4. DISCUSSION
4.1. Metabolomics interpretation of gangliosidosis etiology
In many previous studies [21–24], omics approaches have been applied to identify variations at mRNA and protein levels of lysosomal diseases. Followed with bioinformatics analyses, these studies generated many inferences about disease pathogenesis mechanisms of lysosomal diseases. In this study, a total of 177 and 122 dysregulated metabolites were identified in the liver and brain, respectively. Notably, there are more amino acid, amino acid derivatives and dipeptides identified in livers (mostly upregulated). These results are expected because the liver is the primary site of metabolism. In terms of pathways enriched, significant involvement of neurotransmission and chemical synaptic transmission were observed in the brain. Meanwhile, there are several pathways only enriched in the liver, including gamma glutamyl cycle, leukotriene biosynthesis, Phase II conjugation and glutathione synthesis, which are mainly associated with oxidative stress and inflammation. The energy imbalance in SD may lead to increased respiratory chain activity in mitochondrion, resulting in ROS. To eliminate ROS, the glutathione related pathways including gamma glutamyl cycle and glutathione synthesis may be activated. It has been shown that oxidative stress can potentially cause cell damage and thereby activate inflammatory processes [reviewed in 25].
In lysosomal diseases, relatively little is known as to how the genetic deficiency and resulting lysosomal storage leads to the observed clinical phenotypes. Furthermore, the role that metabolic deficiencies and the associated adaptations play in the disease progression is unknown. Based on the metabolomics profiling in this study and previous literature, we proposed a hypothetical etiology model for SD (illustrated in Figure 4). An important function of the lysosome is to recycle macromolecules into their constituent compounds for reuse. A deficiency of a lysosomal enzyme may lead to an accumulation of intact or only partially degraded substrates as well as a deficiency of the building blocks of those substrates due to interrupted recycling. The interrupted recycling may lead to increased de novo synthesis of macromolecules. As a result of increased de novo synthesis of gangliosides, the cells would require more raw materials and more energy utilization to maintain homeostasis. The increased energy requirements could generate an active mitochondrion that finally produce a ROS excess. The oxidative stress could cause cell damage, resulting in inflammation, which has also been found to be a major contributor to disease progression of GM2 gangliosidosis [26]. In this study, we identified elevation in glutathione pathways, which plays a pivotal role in responses to oxidative stress. Another evidence of inflammation is reduced levels of arachidonic acid, an omega-6 fatty acid, in brain samples of SD mice. Oxidation of arachidonic acid could generate leukotrienes, a family of eicosanoid inflammatory mediators produced in leukocytes, and thus promote inflammation. The increased energy requirements could also activate autophagy and protein catabolism, which have been found in MPS I and MPS VII mice [13]. In this study, increased levels of amino acids, amino acid derivatives and dipeptides were observed, indicating increased protein catabolism. Increased requirements of energy and raw materials could also activate lipid metabolism and carbohydrate metabolism, manifested by decreased adiposity, a common observation in many lysosomal diseases [28–30]. In addition, the enlarged lysosome and distended cells due to abnormal accumulation may require increased membrane synthesis, which can also affect lipid metabolism. Our previous proteomic analysis [31] also identified abnormality in the cytoskeleton system, which can be partially attributed to altered cellular architecture due to storage accumulation. Collectively, as shown in this study, the energy imbalance caused by the lack of these lysosome-derived precursors may have a major impact on the general metabolic state of the animal and on the level of autophagy. Therefore, the metabolomics analysis provides a novel holistic view of the etiology of lysosomal diseases.
Figure 4. Hypothetical etiology model for explaining SD pathogenesis mechanisms.
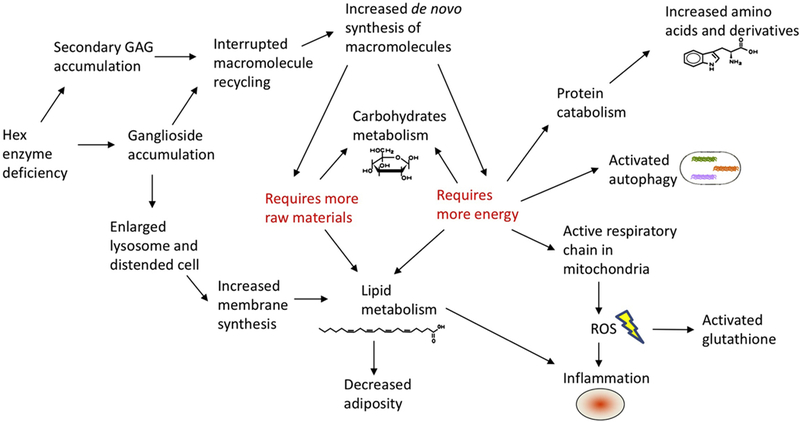
Based on metabolomics profiling, bioinformatics analysis and previous literature, a hypothetical etiology model was proposed. Hex enzyme deficiency causes ganglioside and GAG accumulation, which may lead to interrupted macromolecule recycling and increased de novo synthesis of macromolecules. On the other hand, ganglioside accumulation could result in enlarged lysosome and distended cell, which in turn affects lipid metabolism. Both pathways require more raw materials and more energy. A series of events including protein catabolism, activated autophagy, active respiratory chain in mitochondria may follow.
4.2. Novel biomarkers for Sandhoff disease
GAG is the major storage material in a related group of lysosomal diseases, mucopolysaccharidoses (MPS) [32], which lead to deformities of bone and connective tissues, including heart valves. It was shown that Hex enzyme can cleave GAG in most tissues [33, 34]. In addition, impairment of GAG degradation was observed in cultured human [35] and mouse [36] fibroblasts with SD. Although GAG was not accumulated in a Tay-Sachs mouse model [14], significant GAG accumulation was observed in a Hex α/β double knockout mouse model [37], which lacks all Hex enzyme isoforms. Further, some GM2 patients develop cardiac abnormalities, which closely resemble symptoms of MPS patients [38]. In this study, GAG was found to be elevated in SD mice, emerging as a potential biomarker.
Moreover, a previous study used targeted metabolomics profiling to analyze serum samples of MPS III mice pre- and post-AAV treatment [39]. The serum metabolomics profile emerges as a reliable surrogate biomarker for MPS III therapies. Therefore, metabolomics profiling in our study can also be used to establish a composite biomarker and outcome measurement for future therapeutic studies of SD. Notably, compared with targeted metabolomics profiling, metabolomics is a more comprehensive and with less bias by analyzing all metabolites, including those unknown.
Figure S1. Heatmap analysis of dysregulated metabolites in the mouse liver.
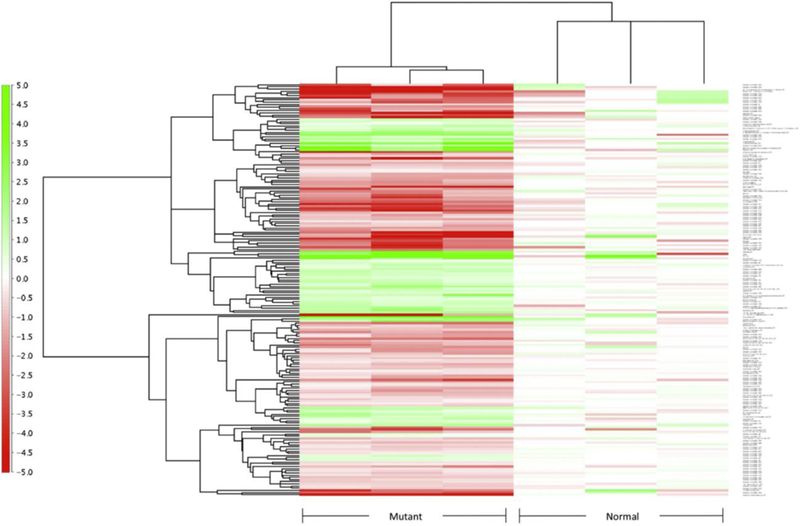
Mutant stands for SD mice (n=3), normal stands for heterozygous mice (n=3). Fold change is illustrated on the left.
5. ACKNOWLEDGEMENTS
The authors thank the Proteomics & Mass Spectrometry Facility at the Danforth Plant Science Center (St. Louis, MO) for metabolic profiling analyses. This work is supported by NIH grant P01HD032652. Dr. Li Ou is a fellow of the Lysosomal Disease Network (U54NS065768). The Lysosomal Disease Network is a part of the Rare Diseases Clinical Research Network (RDCRN), an initiative of the Office of Rare Diseases Research (ORDR), and NCATS. This consortium is funded through a collaboration between NCATS, the National Institute of Neurological Disorders and Stroke (NINDS), and the National Institute of Diabetes and Digestive and Kidney Diseases (NIDDK).
Footnotes
Publisher's Disclaimer: This is a PDF file of an unedited manuscript that has been accepted for publication. As a service to our customers we are providing this early version of the manuscript. The manuscript will undergo copyediting, typesetting, and review of the resulting proof before it is published in its final citable form. Please note that during the production process errors may be discovered which could affect the content, and all legal disclaimers that apply to the journal pertain.
All authors declare that they have no conflicts of interest related to this work.
6. REFERENCES
- [1].Sandhoff K, Andreae U, Jatzkewitz H. Deficient hexozaminidase activity in an exceptional case of Tay-Sachs disease with additional storage of kidney globoside in visceral organs. Life Sci 1968. March 15;7(6):283–8. [DOI] [PubMed] [Google Scholar]
- [2].Sandhoff K, Harzer K. Gangliosides and gangliosidoses: principles of molecular and metabolic pathogenesis. J Neurosci 2013. June 19;33(25):10195–208. [DOI] [PMC free article] [PubMed] [Google Scholar]
- [3].Fu H, Meadows AS, Pineda RJ, Mohney RP, Stirdivant S, McCarty DM. Serum global metabolomics profiling reveals profound metabolic impairments in patients with MPS IIIA and MPS IIIB. Metab Brain Dis 2017. October;32(5):1403–1415. [DOI] [PubMed] [Google Scholar]
- [4].Fu H, Meadows AS, Ware T, Mohney RP, McCarty DM. Near-Complete Correction of Profound Metabolomic Impairments Corresponding to Functional Benefit in MPS IIIB Mice after IV rAAV9-hNAGLU Gene Delivery. Mol Ther 2017. March 1;25(3):792–802. [DOI] [PMC free article] [PubMed] [Google Scholar]
- [5].Sato Y, Kobayashi H, Higuchi T, Shimada Y, Ida H, Ohashi T. Metabolomic Profiling of Pompe Disease-Induced Pluripotent Stem Cell-Derived Cardiomyocytes Reveals That Oxidative Stress Is Associated with Cardiac and Skeletal Muscle Pathology. Stem Cells Transl Med 2017. January;6(1):31–39. [DOI] [PMC free article] [PubMed] [Google Scholar]
- [6].Sango K, Yamanaka S, Hoffmann A, Okuda Y, Grinberg A, Westphal H, McDonald MP, Crawley JN, Sandhoff K, Suzuki K, Proia RL. Mouse models of Tay-Sachs and Sandhoff diseases differ in neurologic phenotype and ganglioside metabolism. Nat Genet 1995. October;11(2):170–6. [DOI] [PubMed] [Google Scholar]
- [7].Nichols L, Freund M, Ng C, Kau A, Parisi M, Taylor A, Armstrong D, Avenilla F, Joseph J, Meinecke D, Wagner A, Roger Little A. The National Institutes of Health Neurobiobank: a federated national network of human brain and tissue repositories. Biol Psychiatry 2014. June 15;75(12):e21–2. [DOI] [PubMed] [Google Scholar]
- [8].Kaiko GE, Ryu SH, Koues OI, Collins PL, Solnica-Krezel L, Pearce EJ, Pearce EL, Oltz EM, Stappenbeck TS. The Colonic Crypt Protects Stem Cells from Microbiota-Derived Metabolites. Cell 2016. June 16;165(7):1708–1720. [DOI] [PMC free article] [PubMed] [Google Scholar]
- [9].Kamburov A, Cavill R, Ebbels TM, Herwig R, Keun HC. Integrated pathway-level analysis of transcriptomics and metabolomics data with IMPaLA. Bioinformatics 2011. October 15;27(20):2917–8. [DOI] [PubMed] [Google Scholar]
- [10].Xia J, Mandal R, Sinelnikov IV, Broadhurst D, Wishart DS. MetaboAnalyst 2.0--a comprehensive server for metabolomic data analysis. Nucleic Acids Res 2012. July;40(Web Server issue):W127–33. [DOI] [PMC free article] [PubMed] [Google Scholar]
- [11].Karnovsky A, Weymouth T, Hull T, Tarcea VG, Scardoni G, Laudanna C, Sartor MA, Stringer KA, Jagadish HV, Burant C, Athey B, Omenn GS. Metscape 2 bioinformatics tool for the analysis and visualization of metabolomics and gene expression data. Bioinformatics 2012. February 1;28(3):373–80. [DOI] [PMC free article] [PubMed] [Google Scholar]
- [12].Shannon P, Markiel A, Ozier O, Baliga NS, Wang JT, Ramage D, Amin N, Schwikowski B, Ideker T. Cytoscape: a software environment for integrated models of biomolecular interaction networks. Genome Res 2003. November;13(11):2498–504. [DOI] [PMC free article] [PubMed] [Google Scholar]
- [13].Woloszynek JC, Kovacs A, Ohlemiller KK, Roberts M, Sands MS. Metabolic adaptations to interrupted glycosaminoglycan recycling. J Biol Chem 2009. October 23;284(43):29684–91. [DOI] [PMC free article] [PubMed] [Google Scholar]
- [14].Suzuki K, Sango K, Proia RL, Langaman C. Mice deficient in all forms of lysosomal beta-hexosaminidase show mucopolysaccharidosis-like pathology. J Neuropathol Exp Neurol 1997. June;56(6):693–703. [PubMed] [Google Scholar]
- [15].Gray-Edwards HL, Brunson BL, Holland M, Hespel AM, Bradbury AM, McCurdy VJ, Beadlescomb PM, Randle AN, Salibi N, Denney TS, Beyers RJ, Johnson AK, Voyles ML, Montgomery RD, Wilson DU, Hudson JA, Cox NR, Baker HJ, Sena-Esteves M, Martin DR. Mucopolysaccharidosis-like phenotype in feline Sandhoff disease and partial correction after AAV gene therapy. Mol Genet Metab 2015. Sep-Oct;116(1–2):80–7. [DOI] [PubMed] [Google Scholar]
- [16].Phillis JW, O’Regan MH. GM1 ganglioside inhibits ischemic release of amino acid neurotransmitters from rat cortex. Neuroreport 1995. October 23;6(15):2010–2. [DOI] [PubMed] [Google Scholar]
- [17].Plaitakis A, Constantakakis E, Smith J. The neuroexcitotoxic amino acids glutamate and aspartate are altered in the spinal cord and brain in amyotrophic lateral sclerosis. Ann Neurol 1988. September;24(3):446–9. [DOI] [PubMed] [Google Scholar]
- [18].Cambron M, D’Haeseleer M, Laureys G, Clinckers R, Debruyne J, De Keyser J. White-matter astrocytes, axonal energy metabolism, and axonal degeneration in multiple sclerosis. J Cereb Blood Flow Metab 2012. March;32(3):413–24. [DOI] [PMC free article] [PubMed] [Google Scholar]
- [19].Zeitoun-Ghandour S, Leszczyszyn OI, Blindauer CA, Geier FM, Bundy JG, Stürzenbaum SR. C. elegans metallothioneins: response to and defence against ROS toxicity. Mol Biosyst 2011. August;7(8):2397–406. [DOI] [PubMed] [Google Scholar]
- [20].Emerit J, Edeas M, Bricaire F. Neurodegenerative diseases and oxidative stress. Biomed Pharmacother 2004. January;58(1):39–46. [DOI] [PubMed] [Google Scholar]
- [21].Khalid O, Vera MU, Gordts PL, Ellinwood NM, Schwartz PH, Dickson PI, Esko JD, Wang RY. Immune-Mediated Inflammation May Contribute to the Pathogenesis of Cardiovascular Disease in Mucopolysaccharidosis Type I. PLoS One 2016. March 17;11(3):e0150850. [DOI] [PMC free article] [PubMed] [Google Scholar]
- [22].Parente MK, Rozen R, Cearley CN, Wolfe JH. Dysregulation of gene expression in a lysosomal storage disease varies between brain regions implicating unexpected mechanisms of neuropathology. PLoS One 2012;7(3):e32419. [DOI] [PMC free article] [PubMed] [Google Scholar]
- [23].Baldo G, Lorenzini DM, Santos DS, Mayer FQ, Vitry S, Bigou S, Heard JM, Matte U, Giugliani R. Shotgun proteomics reveals possible mechanisms for cognitive impairment in Mucopolysaccharidosis I mice. Mol Genet Metab 2015. February;114(2):138–45. [DOI] [PubMed] [Google Scholar]
- [24].Parente MK, Rozen R, Seeholzer SH, Wolfe JH. Integrated analysis of proteome and transcriptome changes in the mucopolysaccharidosis type VII mouse hippocampus. Mol Genet Metab 2016. May;118(1):41–54. [DOI] [PMC free article] [PubMed] [Google Scholar]
- [25].Reuter S, Gupta SC, Chaturvedi MM, Aggarwal BB. Oxidative stress, inflammation, and cancer: how are they linked? Free Radic Biol Med 2010. December 1;49(11):1603–16. [DOI] [PMC free article] [PubMed] [Google Scholar]
- [26].Jeyakumar M, Thomas R, Elliot-Smith E, Smith DA, van der Spoel AC, d’Azzo A, Perry VH, Butters TD, Dwek RA, Platt FM. Central nervous system inflammation is a hallmark of pathogenesis in mouse models of GM1 and GM2 gangliosidosis. Brain 2003. April;126(Pt 4):974–87. [DOI] [PubMed] [Google Scholar]
- [27].Takamura A, Higaki K, Kajimaki K, Otsuka S, Ninomiya H, Matsuda J, Ohno K, Suzuki Y, Nanba E. Enhanced autophagy and mitochondrial aberrations in murine G(M1)-gangliosidosis. Biochem Biophys Res Commun 2008. March 14;367(3):616–22. [DOI] [PubMed] [Google Scholar]
- [28].Woloszynek JC, Roberts M, Coleman T, Vogler C, Sly W, Semenkovich CF, Sands MS. Numerous transcriptional alterations in liver persist after short-term enzyme-replacement therapy in a murine model of mucopolysaccharidosis type VII. Biochem J 2004. April 15;379(Pt 2):461–9. [DOI] [PMC free article] [PubMed] [Google Scholar]
- [29].Venugopal B, Browning MF, Curcio-Morelli C, Varro A, Michaud N, Nanthakumar N, Walkley SU, Pickel J, Slaugenhaupt SA. Neurologic, gastric, and opthalmologic pathologies in a murine model of mucolipidosis type IV. Am J Hum Genet 2007. November;81(5):1070–83. [DOI] [PMC free article] [PubMed] [Google Scholar]
- [30].Du H, Heur M, Duanmu M, Grabowski GA, Hui DY, Witte DP, Mishra J. Lysosomal acid lipase-deficient mice: depletion of white and brown fat, severe hepatosplenomegaly, and shortened life span. J Lipid Res 2001. April;42(4):489–500. [PubMed] [Google Scholar]
- [31].Ou L, Przybilla MJ, Whitley CB. Proteomic analysis of mucopolysaccharidosis I mouse brain with two-dimensional polyacrylamide gel electrophoresis. Mol Genet Metab 2017. Jan-Feb;120(1–2):101–110. [DOI] [PMC free article] [PubMed] [Google Scholar]
- [32].Neufeld E, Muenzer J. The mucopolysaccharidosis, in: Scriver CR, Beaudet Arthur L., Sly William S., Valle David (Eds.), The Metabolic and Molecular bases of Inherited Disease, McGraw-Hill, New York, 1995. [Google Scholar]
- [33].Kresse H, Fuchs W, Glössl J, Holtfrerich D, Gilberg W. Liberation of N-acetylglucosamine-6-sulfate by human beta-N-acetylhexosaminidase A. J Biol Chem 1981. December 25;256(24):12926–32. [PubMed] [Google Scholar]
- [34].Singh J, Coppa GV, Di Ferrante N. Beta-N-acetylhexosaminidase active on dermatan sulfate. Enzyme 1975;19(1):15–23. [DOI] [PubMed] [Google Scholar]
- [35].Cantz M, Kresse H. Sandhoff disease: defective glycosaminoglycan catabolism in cultured fibroblasts and its correction by beta-N-acetylhexosaminidase. Eur J Biochem 1974. September 16;47(3):581–90. [DOI] [PubMed] [Google Scholar]
- [36].Sango K, McDonald MP, Crawley JN, Mack ML, Tifft CJ, Skop E, Starr CM, Hoffmann A, Sandhoff K, Suzuki K, Proia RL. Mice lacking both subunits of lysosomal beta-hexosaminidase display gangliosidosis and mucopolysaccharidosis. Nat Genet 1996. November;14(3):348–52. [DOI] [PubMed] [Google Scholar]
- [37].Hepbildikler ST, Sandhoff R, Kolzer M, Proia RL, Sandhoff K. Physiological substrates for human lysosomal beta-hexosaminidase S. J Biol Chem 2002. January 25;277(4):2562–72. [DOI] [PubMed] [Google Scholar]
- [38].Venugopalan P, Joshi SN. Cardiac involvement in infantile Sandhoff disease. J Paediatr Child Health 2002. February;38(1):98–100. [DOI] [PubMed] [Google Scholar]
- [39].Fu H, Meadows AS, Ware T, Mohney RP, McCarty DM. Near-Complete Correction of Profound Metabolomic Impairments Corresponding to Functional Benefit in MPS IIIB Mice after IV rAAV9-hNAGLU Gene Delivery. Mol Ther 2017. March 1;25(3):792–802. [DOI] [PMC free article] [PubMed] [Google Scholar]


