Abstract
Background and Purpose
The pathogenic mechanism of autosomal dominant polycystic kidney disease (ADPKD) is unclear. Similar to tumour cells, polycystic kidney cells are primarily dependent on aerobic glycolysis for ATP production. Compared with rodents, miniature pigs are more similar to humans. This study is the first time to investigate the effects of the combination of metformin and 2‐deoxyglucose (2DG) in a pig model of chronic progressive ADPKD.
Experimental Approach
A miniature pig ADPKD model was established by inducible deletion of the PKD1 gene. Blood, urine and kidney biopsy specimens were collected for analysis at specific times. The renal vesicle index was analysed by three‐dimensional reconstruction of CT scans. Markers of the mammalian target of rapamycin (mTOR) and ERK signalling pathways and associated metabolism were detected by Western blots and colorimetry.
Key Results
The three‐dimensional reconstruction of CT scans indicated a markedly lower renal vesicle index in the combination therapy group. Each drug intervention group showed a significantly lower serum creatinine and urinary protein/creatinine ratio. This treatment regimen also inhibited the activities of markers of the proliferation‐related mTOR and ERK pathways, and the expression of key enzymes involved in glycolysis, as well as reducing the production of ATP and lactic acid.
Conclusions and Implications
This study showed that the combination of metformin and 2DG blocked the formation of renal cysts and improved the renal function in ADPKD miniature pigs. Our results indicate that the combination of metformin and 2DG may be a promising therapeutic strategy in human ADPKD.
Abbreviations
- 2DG
2‐deoxyglucose
- 4E‐BP1
eukaryotic translation initiation factor 4E‐binding protein 1
- ADPKD
autosomal dominant polycystic kidney disease
- AMPK
AMP‐activated protein kinase
- CDK
cyclin‐dependent protein kinase
- HK
hexokinase
- MEK
MAPK kinase
- mTOR
mammalian target of rapamycin
- p70S6K
p70 ribosomal protein S6 kinase
- PCNA
proliferating cell nuclear antigen
- PFK1
phosphofructokinase type 1
- PKM2
pyruvate kinase isozymes M2
Introduction
Autosomal dominant polycystic kidney disease (ADPKD) is a common hereditary nephropathy with a morbidity rate of 1/500–1/1000. ADPKD is characterized by the abnormal proliferation of renal tubular epithelial cells and the formation of renal vesicles and their progressive expansion (Torres et al., 2007; Harris and Torres, 2009). Mutations in the PKD1 or PKD2 genes account for approximately 85% and 15% of ADPKD cases respectively (Harris and Torres, 2009). At present, the specific pathogenic mechanisms of polycystic kidney disease (PKD) have not been completely elucidated, and no effective treatment method has been identified (Rangan et al., 2016). Therefore, it is of great clinical significance to discover new drugs to delay the development of PKD and even reverse its progression to prevent ESRD.
Previous studies have shown abnormal regulation of multiple signalling pathways in PKD renal tissues. Specifically, the activity of AMP‐activated protein kinase (AMPK), a key signalling molecule in energy metabolism regulation, is known to be reduced. Moreover, the activities of the mammalian target of rapamycin (mTOR) and ERK pathways, which regulate cell proliferation, are enhanced (Rowe et al., 2013). AMPK inhibits mTOR activity in vivo, an interaction that is closely associated with abnormal energy metabolism and abnormal cell proliferation. The activation of AMPK by drugs such as metformin, or inhibition of mTOR has been shown to inhibit the proliferation of vesicular epithelial cells (Takiar et al., 2011; Mekahli et al., 2017). In recent years, drugs that target these signalling pathways have been used in rodent PKD models to evaluate their potential for PKD in preclinical studies. Although rapamycin showed good efficacy in a variety of rodent PKD models, desirable therapeutic effects were not observed in humans with PKD in subsequent clinical studies (Bolignano et al., 2015). Although tolvaptan has been approved for the treatment of ADPKD, there are still some patients who cannot tolerate the side effects such as liver damage. These failures suggested that the results obtained in rodent PKD models cannot always mimic the conditions of human PKD. Therefore, an urgent need exists to identify better treatments.
In recent years, research in rodent PKD models has revealed that cystic epithelial cells in polycystic kidneys are similar to tumour cells, with both cell types exhibiting the Warburg effect. That is, polycystic kidney cells primarily rely on aerobic glycolysis to produce ATP (Rowe and Boletta, 2014; Xu et al., 2015). Two key enzymes in glycolysis, hexokinase 1 (HK1) and pyruvate kinase isozymes M2 (PKM2), were found to have significantly increased expression in rodent PKD models (Rowe et al., 2013).
2‐deoxyglucose (2DG) is an effective inhibitor of glycolysis that functions by targeting hexokinase (Brown, 1962). Metformin is an AMPK activator (Ben Sahra et al., 2010) and has been widely used in the clinical treatment of type 2 diabetes. At present, both drugs have been used alone or in combination for the treatment of cancer in Phase I and II clinical trials (Cheong et al., 2011), and an inhibitory effect on cancer cell proliferation has been reported. As polycystic kidney cells exhibit similar abnormalities as cancer cells in terms of glucose metabolism and proliferation, 2DG and metformin have been tested as monotherapies for the short‐term treatment of PKD in rodents (Chiaravalli et al., 2016; Riwanto et al., 2016). However, no study has investigated the possibility of using a combination of these two agents for the long‐term treatment of PKD.
Given that there are considerable differences between rodents and humans with respect to genetics, anatomy and metabolism, study results based on rodents cannot accurately simulate the pathogenic processes of human disease. Compared with rodents, the kidney of miniature pigs more closely resembles the human kidney. For example, pig and human kidneys have a multipapillary structure, whereas rodent kidneys are unipapillary. Given these similarities, pig kidneys can better replicate the processes of human kidney diseases (Giraud et al., 2011; Groenen et al., 2012; Swindle et al., 2012). In addition, the use of miniature pigs has advantages in terms of animal research ethics. Therefore, the miniature pig is an ideal model in which to study the pathogenic mechanism of PKD and to evaluate drug efficacy.
This study is the first to use metformin in combination with 2DG for the long‐term treatment of chronic progressive ADPKD in a miniature pig model, which were prepared using the technique of zinc finger nuclease described by He et al. (2015). We are also the first to describe the effect of these two agents on vesicle formation and renal function in a miniature pig PKD model. Taking into account the considerable side effects that can result from the long‐term use of high doses of certain drugs, the dosage of metformin used in this study was equivalent to that used for the treatment of human type 2 diabetes. In addition, a mid‐range dose of 2DG was administered, thereby ensuring efficacy and avoiding side effects. The combination of these drugs was assessed in terms of their effects on the proliferation‐related AMPK–mTOR signalling pathway, Raf–MAPK kinase (MEK)–ERK activity and the expression of cell cycle proteins in vesicular epithelial cells. We also observed the effect of the combination of the two drugs on glucose metabolism in a PKD model, with the aim of understanding the cellular and molecular mechanisms that underlie the therapeutic effects of these therapies.
The results showed that the treatment groups, especially the combination of these drugs, significantly inhibited the progression of renal vesicles and improved renal function in a miniature pig model of PKD by regulating the activity of enzymes involved in glucose metabolism and inhibiting the activities of cell proliferation pathways. Our data provide strong evidence that the combination of 2DG and metformin may be a beneficial therapeutic strategy for the treatment of human PKD in the future.
Methods
A miniature pig ADPKD model was successfully constructed by inducible deletion of the PKD1 gene, which was achieved using zinc finger nucleases, a novel genomic editing technique (He et al., 2015). The progression of vesicle formation in this model is slower than in rodents and is very similar to that observed in human PKD. All animals were housed in a room maintained at 18–22°C and 30–70% relative humidity. Artificial lighting was provided from 8:00 to 20:00. The experimental protocol was carried out in accordance with the approved guidelines of the Institutional Animal Care and Use Committee at the Chinese PLA General Hospital. Animal studies are reported in compliance with the ARRIVE guidelines (Kilkenny et al., 2010).
Experimental groups of drug treatment
2DG was purchased from MedChem Express, LLC (CAS: 154‐17‐6, Princeton, NJ), and metformin was purchased from Merck Serono (CAS: 1115‐70‐4, Geneva, Switzerland). Both drugs were dissolved in sterile water for use. The intervention time was divided into three stages, and at each stage the animals were assigned to four groups, a total of 60 animals (Table S1): (i) model control group: ADPKD miniature pigs with body weights of 16–24 kg and which were not treated with either drug; (ii) metformin treatment group: ADPKD miniature pigs with a body weight of 16–24 kg were administered metformin at a dose of 41.67 mg·kg−1·day−1 in two doses; for animals with a body weight over 24 kg, the dosage was adjusted to 41.67 mg·kg−1·day−1 * correction coefficient, and the drug was administered in two doses. (iii) 2DG treatment group: ADPKD miniature pigs with a body weight of 16‐24 kg were administered 2DG at a dose of 68.5 mg·kg−1·day−1 in two doses; for animals with a body weight over 24 kg, the dosage was adjusted to 68.5 mg·kg−1·day−1 * correction coefficient, and the drug was administered in two doses. (iv) Combination therapy group: ADPKD miniature pigs were fed both metformin and 2DG at the above doses. After 10 months of treatment, blood and urine of some animals were collected for analysis after the animasl had been anaesthetized (n = 12). Ketamine hydrochloride and Su‐Mian‐XinII (volume ratio 2:1; 0.3 ml·kg−1) were used for muscle injection. After induction of anesthesia, intravenous sodium pentobarbital 3 mg·kg−1 were used to maintain anesthesia. To observe the changes in the appearance and morphology of the kidneys, some of the animals were killed, after being anaesthetized, for kidney collection (n = 5). After 20 months of treatment, the blood and urine of some animals were collected for analysis (n = 8), and kidney biopsy specimens were collected for analysis from some miniature pigs after they has been anaesthetized (n = 5). To observe kidney changes even more directly in the additional experiments, we continued to keep the miniature pigs to an age of 40 months. Thereafter, some animals were anaesthetized and killed (n = 8); the kidneys were obtained; and the kidney weight and body weight were measured. The diagram of the treatment scheme and pig numbers at each stage is shown in Table S1.
Serum and urine biochemistry analysis
On the scheduled days, serum and urine samples were collected from all miniature pigs. These samples were then centrifuged at 1006.2× g for 10 min and stored at −80°C before analysis. Serum and urine biochemical parameters were analysed using an Autoanalyzer (Cobas8000, Roche, Germany).
Analysis of renal vesicle index using CT scan
Spiral CT scans were performed on the kidneys from the miniature pigs of each group, followed by three‐dimensional reconstruction. The volume of each vesicle in the kidney and the total volume of the kidney were measured using eFilm software (Probe Tool of eFilm® 3.1.0, Merge Healthcare, Milwaukee, WI, USA). The total vesicle volume/total kidney volume was then calculated.
Histopathology of the kidneys
Kidneys from the miniature pigs were excised, fixed in 4% paraformaldehyde, embedded in paraffin and sectioned at 4 μm. Histological staining was performed with periodic acid‐Schiff and haematoxylin–eosin (HE) staining, followed by examination under a microscope.
Western blot
The frozen kidney tissues were lysed. The protein concentration was determined with the Pierce BCA assay kit (catalogue number 23225; Thermo Fisher Scientific, Rockford, IL, USA). A total of 100–150 μg total proteins were resolved on a 6–12% SDS‐PAGE gel. The proteins were then transferred to a nitrocellulose membrane, blocked with 5% skimmed milk for 1 h at room temperature and incubated overnight at 4°C with primary antibodies against the following proteins: proliferating cell nuclear antigen (PCNA; Cat# 2586, RRID: AB_2160343), phospho‐AMPK (Cat# 2531, RRID: AB_330330), phospho‐mTOR (Cat# 2971, RRID: AB_330970), phospho‐p70 ribosomal protein S6 kinase (p70S6K) (Cat# 9206, RRID: AB_2285392), phospho‐eukaryotic translation initiation factor 4E‐binding protein 1 (4E‐BP1) (Cat# 9451, RRID: AB_330947), phospho‐MEK (Cat# 9127), phospho‐PKA (Cat# 4781, RRID: AB_2300165), phospho‐Raf1 (Cat# 9421, RRID: AB_330759), phospho‐ERK1/2 (Cat# 4376, RRID: AB_331772), cyclin D1 (Cat# 2922, RRID: AB_2228523), cyclin E1 (Cat# 4129, RRID: AB_2071200), cyclin‐dependent kinase (CDK) 2 (Cat# 2546, RRID: AB_2276129), CDK4 (Cat# 12790, RRID: AB_2631166), CDK6 (Cat# 13331, RRID: AB_2721897) (Cell Signaling Technology, Danvers, MA, USA); phosphofructokinase type 1 (PFK1) (Cat# sc‐166722; Santa Cruz Biotechnology, Dallas, TX, USA); HK1 (Cat# 19662‐1‐AP, RRID: AB_10859778), HK2 (Cat# 22029‐1‐AP, RRID: AB_11182717), PKM2 (Cat# 10078‐2‐AP, RRID: AB_2283775), NADH1 (Cat# 19703‐1‐AP) and succinate dehydrogenase type A (SDHA) (Cat# 14865‐1‐AP, RRID: AB_11182164) (Proteintech Group, Chicago, IL, USA). The β‐actin (Cat# A5441, RRID: AB_476744) antibody was obtained from Sigma. The blots were subsequently probed with HRP‐conjugated anti‐mouse (Cat# A0216) or anti‐rabbit IgG (Cat# A0208; Beyotime Biotechnology, Beijing, China) at 1:1000. Immunoreactive bands were visualized by enhanced chemiluminescence, and densitometry was performed using ImageJ software (RRID: SCR_003070, Bio‐Rad Laboratories).
Immunohistochemistry staining
Kidneys were fixed in 10% formaldehyde at 4°C overnight, and tissue sections were subjected to antigen retrieval. Endogenous peroxidase was blocked by incubation with 3% hydrogen peroxide for 10 min. Sections were washed in PBS and incubated with 1.5% normal goat serum for 20 min, followed by incubation with a 1:8000 dilution of rabbit monoclonal PCNA antibody (Cell Signaling Technology) overnight at 4°C. Sections were washed and incubated with biotin‐conjugated goat anti‐mouse IgG (Invitrogen). Sections were again washed with PBS and incubated with streptavidin‐conjugated peroxidase (Invitrogen) for 30 min at room temperature. After which they were washed and incubated with DAB (Invitrogen) followed by examination under a microscope.
ATP and lactate quantification
The level of ATP in the miniature pig kidney tissues was quantified by colorimetry according to the standard protocol in the ATP assay kit (Cat# A095‐1; Nanjing Jiancheng Bioengineering Institute, Nanjing, China). The concentration of lactate was measured using the Lactic Acid assay kit (Cat# A019‐2; Nanjing Jiancheng Bioengineering Institute), according to the manufacturer's instructions.
Detection of mitochondrial respiratory chain complex activity in renal tissues of miniature pigs
The activity of the renal mitochondrial complex in the mitochondrial respiratory chain was spectrophotometrically measured according to a previously described method (Ketkar et al., 2015).
Data and statistical analysis
The data and statistical analysis comply with the recommendations on experimental design and analysis in pharmacology (Curtis et al., 2018). All of the data analyses were performed using the SPSS 17.0 (SPSS, Ver. 17.0 RRID: SCR_002865; Chicago, IL, USA) software package. Comparisons between groups were made using ANOVA. The data are expressed as the mean ± SD. P < 0.05 indicates significant differences.
Nomenclature of targets and ligands
Key protein targets and ligands in this article are hyperlinked to corresponding entries in http://www.guidetopharmacology.org, the common portal for data from the IUPHAR/BPS Guide to PHARMACOLOGY (Harding et al., 2018), and are permanently archived in the Concise Guide to PHARMACOLOGY 2017/18 (Alexander et al., 2017).
Results
Combination of 2DG and metformin significantly inhibited the progression of renal cyst formation in ADPKD miniature pigs
The miniature pig model is monoallelic for the PKD mutation. Kidneys were collected (under anaesthesia) from a subset of pigs after 10 months of drug treatment. The results showed that the kidneys from animals in the model control group were larger than those in the treatment groups, with obvious large vesicles on the surface and cysts of various sizes at the junction of the renal cortex and medulla. Among the three treatment groups, the combination therapy group showed the greatest difference in kidney volume and reduction in vesicle number (Figure 1A,B).
Figure 1.
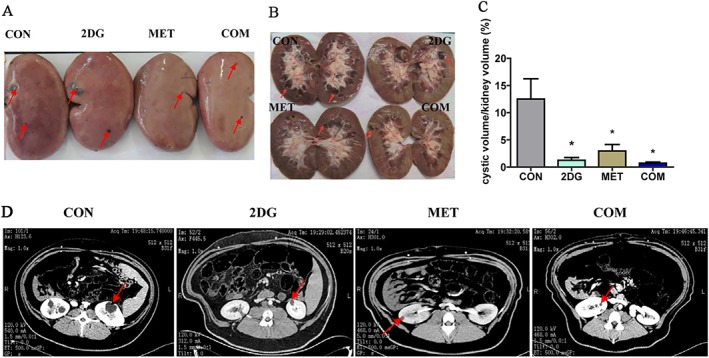
The intervention with 2DG and metformin significantly inhibited the progression of renal cysts in ADPKD miniature pigs. (A) Altered kidney appearance in each ADPKD miniature pig group after 10 months of drug treatment. The red arrow indicates the vesicles. (B) Changes in the cross section of the kidney after drug treatment. (C) The cystic volume/kidney volume were calculated by using enhanced CT to scan the kidneys of the animals and three‐dimensional reconstruction methods. (D) The typical images by CT scanning. *P < 0.05 versus CON (control group) (n = 5).
CT scans were performed on ADPKD miniature pigs from each group after 10 months of drug treatment. Three‐dimensional reconstruction was performed to determine the volume of each vesicle and the total volume of the kidney (Figure 1D and Table S2). And the volume of cysts and the total volume of all cysts in each kidney were calculated. Buoyancy methods were used to measure the total volume of the kidney, and the ratio of the total volume of cysts and the total kidney volume was then calculated. We defined this ratio as the cystic volume/kidney volume (Figure 1C). The results showed that both of the monotherapies and the combination therapy significantly inhibited the progression of renal cysts compared with the control group. The combination therapy group showed the best therapeutic effect.
The renal tissues of the miniature pigs were examined for pathological analysis after 10 months of drug intervention. The results showed lower volume and number of renal cysts in each intervention group when compared with the control group (Figure S1).
To observe the treatment efficacy even more directly, we anaesthetized and killed the miniature pigs that were provided with the drug intervention at 40 months, collected the kidneys, measured the kidney weight and body weight and calculated the kidney weight/body weight ratio (Figure 2C and Table S1). The results showed that compared with the model group, the number of cysts in the kidneys and the kidney weight were significantly reduced in the three drug intervention groups, especially the combination group and 2DG group. The results were shown in Figure 2A–D.
Figure 2.
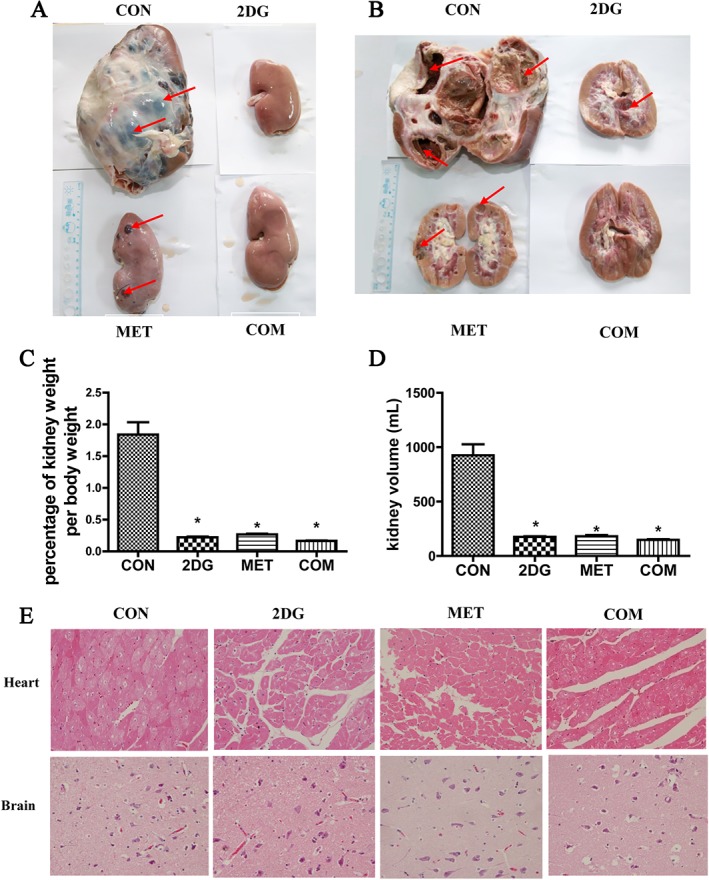
Changes in kidney weight and volume between four groups after 40 months of drug treatment. (A) Altered kidney appearance in each ADPKD miniature pig group after 40 months of drug treatment. The red arrow indicates the vesicles. (B) Changes in the cross section of the kidney after drug treatment. (C) Changes in kidney weight/body weight in the different groups. (D) Changes in kidney volume in different groups. (E) HE staining of the heart and brain from the miniature pigs of each group. *P < 0.05 versus CON (control group) (n = 8).
Combination treatment with 2DG and metformin significantly improved renal function in ADPKD miniature pigs
Blood and urine samples were collected from ADPKD miniature pigs to examine changes in biochemical parameters after 10 and 20 months of treatment with both 2DG and metformin. The results showed that the three drug treatment groups exhibited no significant differences in biochemical parameters when compared with the control group after 10 months of treatment (data not shown). After 20 months of treatment, the serum creatinine level and urinary protein/creatinine ratio were significantly lower in the three drug treatment groups compared with the control group (P < 0.05) (Table 1). Compared with the control group, the serum levels of the liver function indicators alanine aminotransferase and aspartate aminotransferase were not significantly different (P > 0.05) in any of the treatment groups, indicating that the two drugs had no obvious side effects on the liver.
Table 1.
Biochemical test results after 20 months of drug treatment in ADPKD miniature pigs
| Parameters | CON | 2DG | MET | COM |
|---|---|---|---|---|
| BUN (mmol·L−1) | 6.07 ± 0.90 | 4.86 ± 0.32 | 5.12 ± 0.17 | 5.14 ± 0.32 |
| SCr (μmol·L−1) | 149.73 ± 10.43 | 108.70 ± 10.87* | 106.63 ± 20.20* | 109.67 ± 3.02* |
| P/C (mg·mmol−1) | 20.16 ± 3.86 | 8.64 ± 4.70 | 4.58 ± 0.82* | 4.87 ± 0.88* |
| ALT (U·L−1) | 50.07 ± 7.82 | 57.1 ± 25.68 | 51.83 ± 0.81 | 50.27 ± 5.19 |
| AST (U·L−1) | 28.7 ± 0.98 | 46 ± 16.44 | 32.87 ± 7.66 | 36.2 ± 6.3 |
n = 8. ALT, serum alanine aminotransferase; AST, serum aspartate aminotransferase; BUN, blood urea nitrogen; SCr, serum creatinine; P/C, urinary protein/creatinine ratio.
Combination of 2DG and metformin significantly inhibited the proliferation of renal vesicular epithelial cells in ADPKD miniature pigs
Changes in the expression of cell proliferation markers PCNA in renal tissues of ADPKD miniature pigs after treatment
PCNA is used as indicators of cell proliferation. We used Western blotting and immunohistochemistry to examine the changes in PCNA protein expression in renal tissues of ADPKD miniature pigs. The results showed significantly lower expression levels of PCNA in renal tissues from each drug intervention group when compared with the control group. The reduction in the expression levels in the combination therapy group was significantly greater than that in the 2DG or metformin monotherapy groups (Figure 3A–C).
Figure 3.
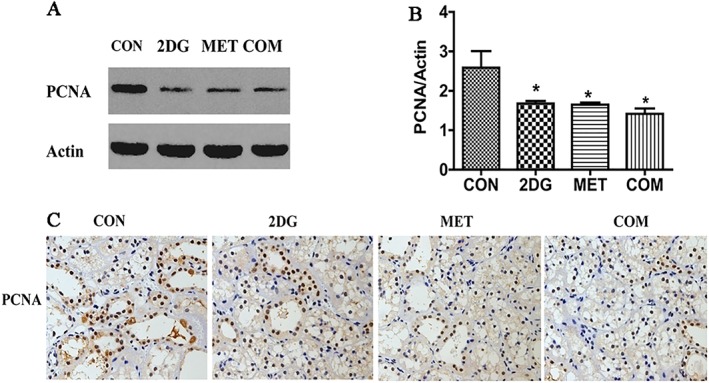
Changes in the expression of PCNA in the kidneys of each of the groups examined. (A) Detection of PCNA by Western blotting. (B) Semi‐quantitative analysis of PCNA expression level. (C) Detection of PCNA by immunohistochemistry. *P < 0.05 versus CON (control group) (n = 5).
Changes in the expression of cell cycle‐related proteins in renal tissues from ADPKD miniature pigs after drug treatment
Cell proliferation is closely related to abnormal cell cycle regulation. The CDK proteins are major regulators of protein phosphorylation in the cell cycle, and their activity is regulated by cyclin family proteins. We used Western blotting to examine the protein expression levels of cyclin D1, cyclin E1, CDK2, CDK4 and CDK6 in renal tissues from each treatment group. The results showed significantly lower expression levels of cyclin D1, CDK4 and CDK6 in all drug intervention groups when compared with the control group. The difference in expression of these proteins was more significant in the combination therapy group than in the two monotherapy groups. No significant changes were observed in the expression of cyclin E1 and CDK2 (Figure 4).
Figure 4.
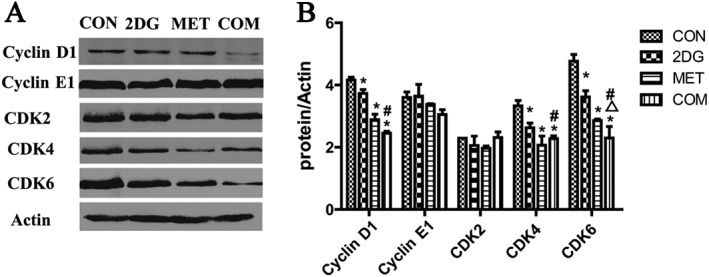
Changes of the expression of cell cycle‐related proteins in renal tissues from ADPKD miniature pigs. (A) The detection of cell cycle‐related proteins by Western blotting. (B) Semi‐quantitative analysis of the expression levels of cell cycle‐related proteins. *P < 0.05 versus CON, △P < 0.05 versus 2DG, # P < 0.05 versus MET (n = 5).
The combination of 2DG and metformin significantly inhibited the activities of proliferative signalling pathways in renal vesicular epithelial cells in ADPKD miniature pigs
Changes in the activity of members mTOR signalling pathway in renal tissues from ADPKD miniature pigs after drug treatment
In addition to regulating cell proliferation as a key protein kinase, mTOR also plays an important role in regulating energy metabolism. As a key kinase regulator of energy metabolism, AMPK negatively regulates mTOR, inhibiting its activity (Hardie, 2008; Ma and Blenis, 2009). The downstream signalling molecules of the mTOR pathways include p70S6K and 4E‐BP1, and activation of mTOR signalling pathway promotes cell proliferation. We used Western blotting to examine changes in the levels of phospho‐mTOR, phospho‐p70S6K and phospho‐4EBP1 in renal tissues from miniature pigs after drug treatment. The results showed significantly lower levels of phospho‐mTOR, phospho‐p70S6K and phospho‐4EBP1 in the drug intervention groups when compared with the control group. This difference was more significant in the combination therapy group than in the two monotherapy groups (Figure 5).
Figure 5.
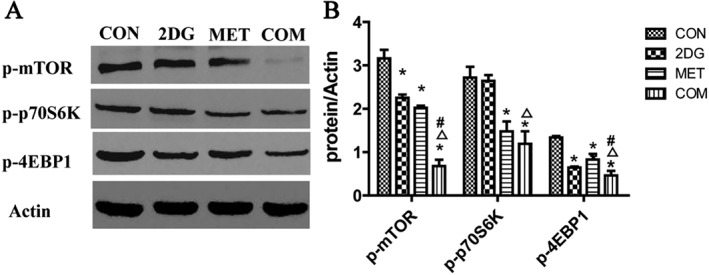
Changes in the activity of markers of the mTOR signalling pathway in renal tissues from ADPKD miniature pigs after drug treatment. (A) Detection of activated signalling molecules in the mTOR pathway via Western blotting. (B) Semi‐quantitative analysis of the expression levels of signalling molecules in the mTOR pathway. *P < 0.05 versus CON, △P < 0.05 versus 2DG, # P < 0.05 versus MET (n = 5).
Changes in the activity of ERK signalling pathway markers in renal tissues from ADPKD miniature pigs after drug treatment
ERK is one of the key protein kinases that regulates cell proliferation and is activated upon phosphorylation. We used Western blotting to investigate the levels of ERK signalling pathway members (phospho‐PKA, phospho‐Raf1, phospho‐MEK and phospho‐ERK1/2) in the renal tissues of miniature pigs after drug treatment. The results showed differing degrees of weaker phospho‐MEK and phospho‐ERK1/2 expression in the drug intervention groups compared to the control group. The most significant difference was observed for the combination therapy group. Compared with the control group, all three treatment groups showed lower expression of phospho‐Raf1, but the difference was not statistically significant (Figure 6).
Figure 6.
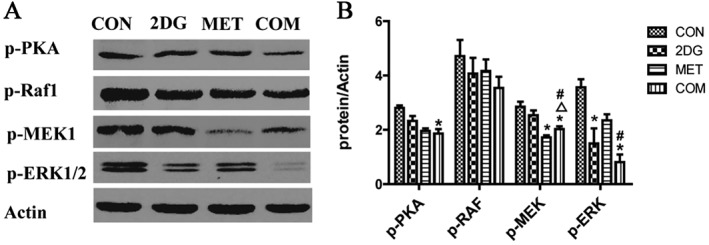
Changes in the activity of ERK signalling pathway members in renal tissues from each group of PKD miniature pigs. (A) The detection of activated signalling molecules of the ERK pathway via Western blotting. (B) Semi‐quantitative analysis of the expression levels of ERK pathway signalling molecules. *P < 0.05 versus CON, △P < 0.05 versus 2DG, # P < 0.05 versus MET (n = 5).
The combination of 2DG and metformin inhibited glycolytic activity and enhanced oxidative phosphorylation in the kidney of PKD miniature pigs
Changes in the expression of key glucose metabolism enzymes in the renal tissues from PKD miniature pigs
To further elucidate whether 2DG and metformin inhibited the proliferation of vesicular epithelial cells in PKD by regulating glucose metabolism, renal tissues from each treatment group were subjected to Western blotting for key enzymes in the glycolysis pathway, including hexokinase, PFK1 and PKM2. Levels of key enzymes in mitochondrial oxidative phosphorylation were also assessed, including NADH1 and SDHA. The results showed that the expression of key glycolysis enzymes HK1, HK2, PFK1 and PKM2 was significantly lower in the drug intervention groups compared with the control group, with the combination of 2DG and metformin showing the most obvious effect, followed by the 2DG treatment group (Figure 7). These data indicate that these two drugs significantly inhibited the activities of glycolytic enzymes.
Figure 7.
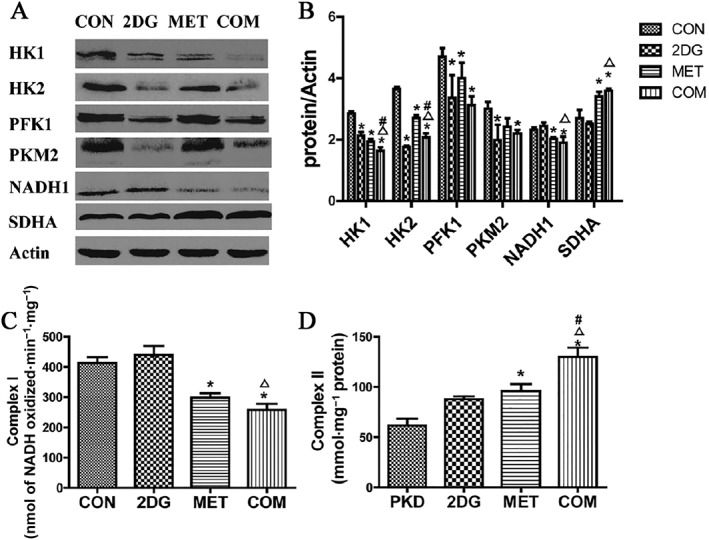
Changes in the expression of key glucose metabolism enzymes and the activities of mitochondrial respiratory chain complexes in the renal tissues from PKD miniature pigs after drug treatment. (A) Detection of the expression of key glucose metabolism enzymes via Western blotting. (B) Semi‐quantitative analysis of the expression levels of key glucose metabolism enzymes. Protein expression data are presented as the mean ± SD. (C) The activity of mitochondrial respiratory chain Complex I in the renal tissues from each group of miniature pigs. (D) Activity of the Complex II of the mitochondrial respiratory chain. *P < 0.05 versus CON, △P < 0.05 versus 2DG, # P < 0.05 versus MET (n = 5).
Metformin is an activator of AMPK (Ben Sahra et al., 2010) and inhibits Complex I activity in the mitochondrial oxidative phosphorylation chain (El‐Mir et al., 2000). 2DG inhibits the activity of the key glycolysis enzyme hexokinase.
Compared with the control group, the metformin intervention group and combination therapy group showed remarkably lower expression levels of a key mitochondrial oxidative phosphorylation enzyme (NADH1, subunit of the Complex I) in renal tissues (P < 0.05), as well as significantly higher levels of SDHA (subunit of the Complex I) (P < 0.05). This effect was likely due to the inhibitory action of metformin on Complex I activity during mitochondrial oxidative phosphorylation, leading to a compensatory increase in Complex II activity. However, compared to the control group, the 2DG treatment group did not show significant changes in the expression levels of NADH1 or SDHA (P > 0.05) (Figures 7A and 8B), possibly because 2DG primarily inhibits the rate‐limiting enzyme in glycolysis (hexokinase) without significantly affecting oxidative phosphorylation.
Figure 8.
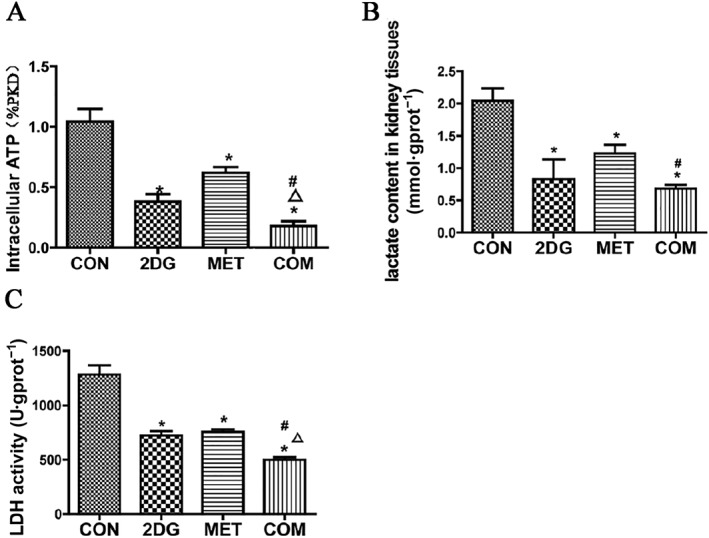
Analysis of changes in ATP (A), lactic acid (B) and LDH (C) in the kidneys of PKD miniature pigs after treatment. *P < 0.05 versus CON, Δ P < 0.05 versus 2DG, # P < 0.05 versus MET (n = 5).
We further analysed the activities of the mitochondrial respiratory chain complexes in renal tissues after treatment with the two drugs. Compared to the control group, the activity of Complex I was significantly lower in the metformin group and the combination therapy group (P < 0.05), whereas activity was markedly higher in the 2DG treatment group (Figure 7C). This effect was likely due to the inhibition of glycolysis pathway by 2DG, resulting in a compensatory increase in oxidative phosphorylation and Complex I activity. Compared to the control group, the activity of Complex II was significantly higher in the metformin and combination therapy groups (P < 0.05). The 2DG treatment group showed higher Complex II activity, but the difference was not statistically significant (P > 0.05) (Figure 7D). Compared with the control group, no significant changes were observed in the activities of Complexes or Complex IV (data not shown).
Changes in ATP and lactic acid levels and LDH activity in the kidneys of PKD miniature pigs after drug therapy
ATP and lactic acid are the products of glycolysis. LDH is a key enzyme in the regulation of glycolysis, catalysing the production of lactic acid from pyruvic acid. We examined ATP and lactic acid levels and LDH activity in PKD renal tissues after treatment with the two drugs. Compared to the control group, the levels of ATP and lactic acid and activities of LDH were significantly lower in all of the drug treatment groups. The combination therapy group showed the most significant effect, followed by the 2DG group (Figure 8).
Changes in phospho‐AMPK levels in renal tissues from PKD miniature pigs after drug treatment
AMPK is an intracellular energy metabolism sensor and a key molecule in the regulation of energy metabolism, with phospho‐AMPK being the activated form of AMPK. When intracellular ATP levels are high, the ATP/AMP ratio is decreased, leading to inhibition of AMPK activity. Activated AMPK negatively regulates mTOR, inhibiting its activity (Hardie, 2008; Ma and Blenis, 2009) and indirectly regulating cell proliferation. AMPK activity has been found to be significantly reduced in polycystic kidney tissues, and metformin is a known AMPK activator. Therefore, we examined the expression level of phospho‐AMPK in renal tissues of miniature pigs after treatment with the two drugs. Compared to the control group, all of the drug intervention groups exhibited higher expression levels of phospho‐AMPK, with the combination therapy group showing the most significant increase, followed by the metformin group (Figure 9). These data indicate that in addition to metformin, 2DG also activates AMPK.
Figure 9.
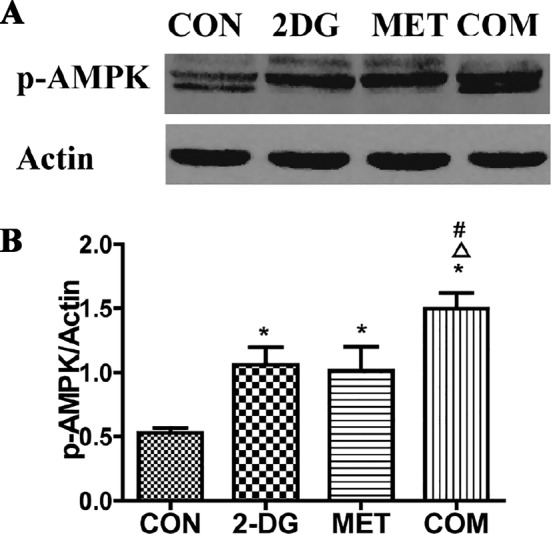
Analysis of phospho‐AMPK levels in the kidneys of PKD miniature pigs after drug treatment. (A) Detection of phospho‐AMPK through Western blotting. (B) Semi‐quantitative analysis of phospho‐AMPK levels. *P < 0.05 versus CON, △P < 0.05 versus 2DG, # P < 0.05 versus MET (n = 5).
Discussion
The glucose analogue 2DG acts as a competitive inhibitor of the glycolysis rate‐limiting enzyme hexokinase (Brown, 1962), leading to an inhibition of cell cycle progression and cell death in vitro (Maher et al., 2004). Metformin is an AMPK activator, and studies have explored the use of metformin in the context of ADPKD, both in vivo and in vitro (Takiar et al., 2011; Mekahli et al., 2014). In addition, metformin can inhibit the mitochondrial oxidative phosphorylation activity of Complex I (El‐Mir et al., 2000). Studies have found that metformin alone exhibits a strong anti‐proliferative action in numerous cancer cell lines (Ben Sahra et al., 2008; Gotlieb et al., 2008). In addition, metformin has been reported to enhance the cytotoxic activity of 2DG against various types of cancer cells by accelerating ATP depletion (Ben Sahra et al., 2010; Cheong et al., 2011). In recent years, inhibitors of glucose metabolism, such as metformin and 2DG, have been studied for their effects in inhibiting tumour cell growth. Notably, neither metformin nor 2DG has exhibited significant adverse side effects in the clinic (Lalau and Race, 1999; Dwarakanath et al., 2009; Stein et al., 2010). Metformin and 2DG have been studied in Phase I and II clinical studies in cancer patients (Cheong et al., 2011; DePeralta et al., 2016; Menamin et al., 2016). Previous studies have shown that polycystic kidney cells are similar to tumour cells. Moreover, it has been reported that PKD1 mutations result in enhanced glycolysis in mouse models of PKD (Rowe et al., 2013). Therefore, metformin and 2DG may be used to treat PKD.
Compared with rodent models, pigs are highly similar to humans in terms of metabolism and renal structure and functions (He et al., 2015). This was the first study to use a chronic progressive ADPKD miniature pig model, to study the therapeutic effects of treatment with both metformin and 2DG. The results showed that the combination of these two drugs inhibited cyst formation much more strongly than either drug alone in the studied models.
After 10 months of drug intervention, the appearance and cross section of kidneys from each drug treatment group were analysed, revealing significantly fewer vesicles than were observed in the control group. But the biochemical parameters exhibited no significant differences. After 20 months of drug intervention, compared to the control group, each drug intervention group showed significantly lower serum creatinine and urinary protein/creatinine ratio. These data indicate that both agents remarkably improved renal function in PKD1‐knockout miniature pigs. The results of biochemical tests showed no significant differences in liver function indicators between the treatment groups, indicating that metformin and 2DG had no obvious hepatic side effects.
The kidney‐to‐body weight ratio is a very important reference index; we continued raising the pigs to an age of 40 months; thereafter, they were anaesthetized and killed, and their kidney weight and body weight were measured. The kidney‐to‐body weight ratios have been shown (Figure 2C). There was no significant difference in the animal weight among the four groups. To observe whether the drug had toxic effects on the heart and brain, we harvested the heart and brain and performed HE staining. HE staining of the brain did not reveal any obvious pathological changes, and HE staining of the cardiac muscle did not reveal vacuolar or other pathological changes (Figure 2E).
Recent studies have shown that vesicle formation in PKD is associated with excessive proliferation of renal tubular epithelial cells. Cell proliferation is closely related to abnormal regulation of cell cycle. These proteins and cell cycle protein kinases (CDK2, CDK4 and CDK6) assemble into two types of complex: Cyclin D1/CDK4/CDK6 and Cyclin E1/CDK2 (Hunter, 1993; Sherr, 1993). Our results showed significantly lower expression of the primary G0/G1 phase proteins Cyclin D1, CDK4 and CDK6 compared to the control group after drug treatment. The expression of Cyclin E1 and CDK2 was not significantly affected by treatment.
A variety of drugs directed against cell proliferation signalling pathways have been tested for efficacy in rodent PKD models (Yamaguchi et al., 2004; Shillingford et al., 2006; Boletta, 2009) but have not shown significant therapeutic effects.
mTOR is a critical protein kinase in the regulation of cell proliferation (Ma and Blenis, 2009), and AMPK, the key kinase that regulates energy metabolism, is known to inhibit mTOR activity (Hardie, 2008; Ma and Blenis, 2009). Therefore, mTOR is a key molecule that links energy metabolism and cell proliferation. The signalling molecules that are downstream of mTOR include p70S6K and 4EBP1, which promote cell proliferation (Distefano et al., 2009). We found that the combination of metformin and 2DG significantly inhibited the activity of the mTOR signalling pathway, leading to markedly lower expression levels of phospho‐mTOR, phospho‐p70S6K and phospho‐4EBP1 compared to the control group. The strongest difference in the expression of these proteins was observed in the combination therapy group.
Previous studies have shown that cAMP activates PKA, which in turn activates the ERK signalling pathway to induce cell proliferation in polycystic kidney epithelial cells (Nagao et al., 2003; Yamaguchi et al., 2003; Baba et al., 2008). Therefore, we examined the levels of phospho‐PKA, phospho‐Raf1, phospho‐MEK1 and phospho‐ERK1/2 in renal tissues of ADPKD miniature pigs after treatment with metformin and/or 2DG. The results showed that the levels of phospho‐PKA, phospho‐Raf1, phospho‐MEK1 and phospho‐ERK1/2 were significantly lower in the treatment groups, with the most significant differences found in the combination therapy group.
Previous oncology studies have shown that abnormalities in cell energy metabolism are closely related to abnormal cell proliferation. We sought to determine whether 2DG and metformin inhibit the proliferation of vesicular epithelial cells in PKD by regulating glucose metabolism. To this end, we examined the expression of the key glycolysis enzymes and mitochondrial respiratory chain enzymes, as well as the changes in their activities, in the renal tissues from the miniature pigs after treatment with the two drugs. The results showed that the levels of ATP and lactic acid were significantly lower in the treated groups compared to the control group, as were the expression levels of the key glycolytic enzymes HK1, HK2, PFK1 and PKM2. Notably, the most obvious effects on the levels of these molecules and proteins were observed in the combination therapy group. The expression level of NADH1, the key enzyme in the oxidative phosphorylation process, was significantly lower in the treatment groups, while the expression level of SDHA was higher, with the most significant effects found in the combination therapy group. Among the enzyme complexes of the mitochondrial respiratory chain, Complex I showed lower activity in the treatment groups, while the Complex II exhibited higher activity.
Studies have found that either direct inhibition of mTOR signalling using rapamycin or indirect inhibition using the AMPK agonist metformin can reverse the glycolytic phenotype of ADPKD cells in vitro (Riwanto et al., 2016). AMPK is a crucial molecule in the regulation of energy metabolism (Hardie, 2008; Rehman et al., 2014). One previous study found lower levels of AMPK phosphorylation in Pkd1−/− cells compared to wild type cells (Rowe et al., 2013). We examined the levels of activated AMPK (phospho‐AMPK) in the renal tissues of miniature pigs from each group. The results showed significantly higher levels of activated AMPK after drug treatment compared to levels in the control group, with the strongest difference observed in the metformin intervention group, followed by the combination therapy group.
In summary, this study is the first to report that the combination of metformin and 2DG led to a stronger inhibition of renal vesicular epithelial cell proliferation than monotherapy with either drug. The combined treatment regulated the activities of glucose metabolism enzymes and inhibited the activities of the proliferative signalling pathways mTOR and ERK in renal cyst epithelial cells (Figure 10). In this way, the progression of renal vesicle formation was significantly blocked, and renal function improved in PKD miniature pigs. Our data provide proof of principle support for the combined use of 2DG and metformin as a potential therapeutic strategy for human PKD.
Figure 10.
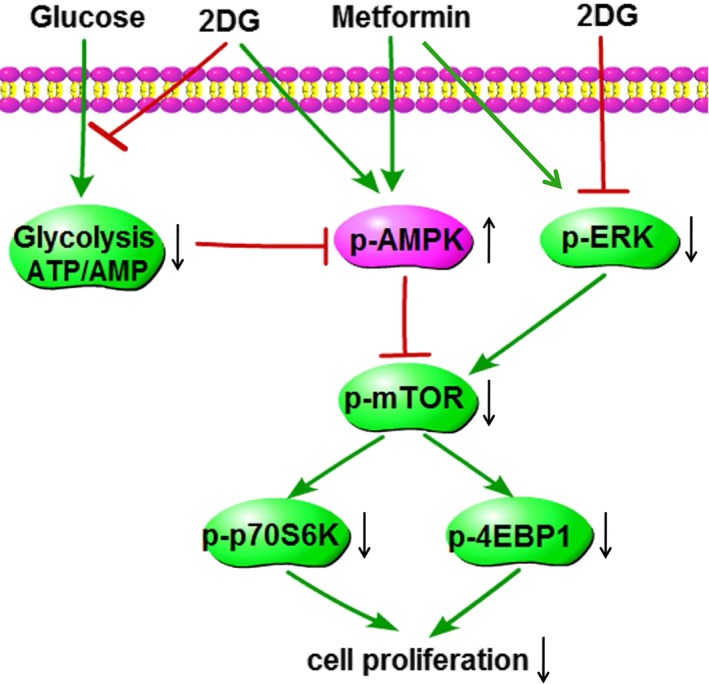
Diagram of the mechanism of action of PKD treatment in miniature pigs with the combination of 2DG and metformin. In the renal tissues of miniature pigs with polycystic kidneys, the level of glycolysis is significantly increased, leading to a higher production of ATP and decreased expression of p‐AMPK. These effects in turn induce the elevated expression of p‐ERK, p‐mTOR, p‐p70S6K and p‐4EBP1 and significantly enhance cell proliferation. The combination of 2DG and metformin for the treatment of miniature pigs with PKD blocks glycolysis, suppresses ATP production and increases p‐AMPK activity. In addition, this treatment strategy reduces the activities of p‐ERK, p‐mTOR, p‐p70S6K and p‐4EBP1, significantly inhibiting the proliferation of tubular cystic epithelial cells. p‐ (phospho‐) indicates the activated state of the protein.
Author contributions
X‐Y.B. designed and supervised the research and provided the final approval of the version to be published. X.W. and Y.Z contributed to breeding the mini‐pigs. X.L. performed all the experiments, analysed the data and wrote the manuscript. K.S. and S.L. contributed to the sample fabrication. Z.L. and G.C put forward very valuable comments. Q.L. and X.C. contributed to the collection, interpretation and analysis of data throughout the experiment. All authors discussed the results and commented on the manuscript.
Conflict of interest
The authors declare no conflicts of interest.
Declaration of transparency and scientific rigour
This Declaration acknowledges that this paper adheres to the principles for transparent reporting and scientific rigour of preclinical research recommended by funding agencies, publishers and other organisations engaged with supporting research.
Supporting information
Figure S1 Supporting information.
Table S1 The treatment scheme and the methods used for specimen collection.
Table S2 The results of renal vesicles by CT scanning.
Acknowledgements
This work was supported by grants (nos 81770663 and 81570659) from the National Natural Science Foundation of China, a grant (no. 2016YFA0101002) from the National Key Research and Development Program of China and a grant (no. 20158332) from the Natural Science Foundation of Hainan Province. The English in this document has been checked by at least two professional editors, both native speakers of English.
Lian, X. , Wu, X. , Li, Z. , Zhang, Y. , Song, K. , Cai, G. , Li, Q. , Lin, S. , Chen, X. , and Bai, X.‐Y. (2019) The combination of metformin and 2‐deoxyglucose significantly inhibits cyst formation in miniature pigs with polycystic kidney disease. British Journal of Pharmacology, 176: 711–724. 10.1111/bph.14558.
Contributor Information
Xiangmei Chen, Email: xmchen301@126.com.
Xue‐Yuan Bai, Email: xueyuan_bai@163.com.
References
- Alexander SPH, Fabbro D, Kelly E, Marrion NV, Peters JA, Faccenda E et al (2017). The Concise Guide to PHARMACOLOGY 2017/18: Enzymes. Br J Pharmacol 174: S272–S359. [DOI] [PMC free article] [PubMed] [Google Scholar]
- Baba M, Furihata M, Hong SB, Tessarollo L, Haines DC, Southon E et al (2008). Kidney‐targeted Birt‐Hogg‐Dube gene inactivation in a mouse model: Erk1/2 and Akt‐mTOR activation, cell hyperproliferation, and polycystic kidneys. J Natl Cancer Inst 100: 140–154. [DOI] [PMC free article] [PubMed] [Google Scholar]
- Ben Sahra I, Laurent K, Giuliano S, Larbret F, Ponzio G, Gounon P et al (2010). Targeting cancer cell metabolism: the combination of metformin and 2‐deoxyglucose induces p53‐dependent apoptosis in prostate cancer cells. Cancer Res 70: 2465–2475. [DOI] [PubMed] [Google Scholar]
- Ben Sahra I, Laurent K, Loubat A, Giorgetti‐Peraldi S, Colosetti P, Auberger P et al (2008). The antidiabetic drug metformin exerts an antitumoral effect in vitro and in vivo through a decrease of cyclin D1 level. Oncogene 27: 3576–3586. [DOI] [PubMed] [Google Scholar]
- Boletta A (2009). Emerging evidence of a link between the polycystins and the mTOR pathways. Pathogenetics 2: 6. [DOI] [PMC free article] [PubMed] [Google Scholar]
- Bolignano D, Palmer SC, Ruospo M, Zoccali C, Craig JC, Strippoli GF (2015). Interventions for preventing the progression of autosomal dominant polycystic kidney disease. Cochrane Database Syst Rev : Cd010294. [DOI] [PMC free article] [PubMed] [Google Scholar]
- Brown J (1962). Effects of 2‐deoxyglucose on carbohydrate metablism: review of the literature and studies in the rat. Metabolism 11: 1098–1112. [PubMed] [Google Scholar]
- Cheong JH, Park ES, Liang J, Dennison JB, Tsavachidou D, Nguyen‐Charles C et al (2011). Dual inhibition of tumor energy pathway by 2‐deoxyglucose and metformin is effective against a broad spectrum of preclinical cancer models. Mol Cancer Ther 10: 2350–2362. [DOI] [PMC free article] [PubMed] [Google Scholar]
- Chiaravalli M, Rowe I, Mannella V, Quilici G, Canu T, Bianchi V et al (2016). 2‐Deoxy‐d‐glucose ameliorates PKD progression. J Am Soc Nephrol 27: 1958–1969. [DOI] [PMC free article] [PubMed] [Google Scholar]
- Curtis MJ, Alexander S, Cirino G, Docherty JR, George CH, Giembycz MA et al (2018). Experimental design and analysis and their reporting II: updated and simplified guidance for authors and peer reviewers. Br J Pharmacol 175: 987–993. [DOI] [PMC free article] [PubMed] [Google Scholar]
- DePeralta DK, Wei L, Ghoshal S, Schmidt B, Lauwers GY, Lanuti M et al (2016). Metformin prevents hepatocellular carcinoma development by suppressing hepatic progenitor cell activation in a rat model of cirrhosis. Cancer 122: 1216–1227. [DOI] [PMC free article] [PubMed] [Google Scholar]
- Distefano G, Boca M, Rowe I, Wodarczyk C, Ma L, Piontek KB et al (2009). Polycystin‐1 regulates extracellular signal‐regulated kinase‐dependent phosphorylation of tuberin to control cell size through mTOR and its downstream effectors S6K and 4EBP1. Mol Cell Biol 29: 2359–2371. [DOI] [PMC free article] [PubMed] [Google Scholar]
- Dwarakanath BS, Singh D, Banerji AK, Sarin R, Venkataramana NK, Jalali R et al (2009). Clinical studies for improving radiotherapy with 2‐deoxy‐D‐glucose: present status and future prospects. J Cancer Res Ther 5 (Suppl. 1): S21–S26. [DOI] [PubMed] [Google Scholar]
- El‐Mir MY, Nogueira V, Fontaine E, Averet N, Rigoulet M, Leverve X (2000). Dimethylbiguanide inhibits cell respiration via an indirect effect targeted on the respiratory chain complex I. J Biol Chem 275: 223–228. [DOI] [PubMed] [Google Scholar]
- Giraud S, Favreau F, Chatauret N, Thuillier R, Maiga S, Hauet T (2011). Contribution of large pig for renal ischemia‐reperfusion and transplantation studies: the preclinical model. J Biomed Biotechnol 2011: 532127. [DOI] [PMC free article] [PubMed] [Google Scholar]
- Gotlieb WH, Saumet J, Beauchamp MC, Gu J, Lau S, Pollak MN et al (2008). In vitro metformin anti‐neoplastic activity in epithelial ovarian cancer. Gynecol Oncol 110: 246–250. [DOI] [PubMed] [Google Scholar]
- Groenen MA, Archibald AL, Uenishi H, Tuggle CK, Takeuchi Y, Rothschild MF et al (2012). Analyses of pig genomes provide insight into porcine demography and evolution. Nature 491: 393–398. [DOI] [PMC free article] [PubMed] [Google Scholar]
- Hardie DG (2008). AMPK and Raptor: matching cell growth to energy supply. Mol Cell 30: 263–265. [DOI] [PubMed] [Google Scholar]
- Harding SD, Sharman JL, Faccenda E, Southan C, Pawson AJ, Ireland S et al (2018). The IUPHAR/BPS Guide to PHARMACOLOGY in 2018: updates and expansion to encompass the new guide to IMMUNOPHARMACOLOGY. Nucl Acids Res 46: D1091–D1106. [DOI] [PMC free article] [PubMed] [Google Scholar]
- Harris PC, Torres VE (2009). Polycystic kidney disease. Annu Rev Med 60: 321–337. [DOI] [PMC free article] [PubMed] [Google Scholar]
- He J, Li Q, Fang S, Guo Y, Liu T, Ye J et al (2015). PKD1 mono‐allelic knockout is sufficient to trigger renal cystogenesis in a mini‐pig model. Int J Biol Sci 11: 361–369. [DOI] [PMC free article] [PubMed] [Google Scholar]
- Hunter T (1993). Braking the cycle. Cell 75: 839–841. [DOI] [PubMed] [Google Scholar]
- Ketkar S, Rathore A, Kandhare A, Lohidasan S, Bodhankar S, Paradkar A et al (2015). Alleviating exercise‐induced muscular stress using neat and processed bee pollen: oxidative markers, mitochondrial enzymes, and myostatin expression in rats. Integr Med Res 1: 147–160. [DOI] [PMC free article] [PubMed] [Google Scholar]
- Kilkenny C, Browne W, Cuthill IC, Emerson M, Altman DG (2010). Animal research: reporting in vivo experiments: the ARRIVE guidelines. Br J Pharmacol 160: 1577–1579. [DOI] [PMC free article] [PubMed] [Google Scholar]
- Lalau JD, Race JM (1999). Lactic acidosis in metformin therapy. Drugs 58 (Suppl. 1): 55–60 discussion 75‐82. [DOI] [PubMed] [Google Scholar]
- Ma XM, Blenis J (2009). Molecular mechanisms of mTOR‐mediated translational control. Nat Rev Mol Cell Biol 10: 307–318. [DOI] [PubMed] [Google Scholar]
- Maher JC, Krishan A, Lampidis TJ (2004). Greater cell cycle inhibition and cytotoxicity induced by 2‐deoxy‐D‐glucose in tumor cells treated under hypoxic vs aerobic conditions. Cancer Chemother Pharmacol 53: 116–122. [DOI] [PubMed] [Google Scholar]
- Mekahli D, Decuypere JP, Sammels E, Welkenhuyzen K, Schoeber J, Audrezet MP et al (2014). Polycystin‐1 but not polycystin‐2 deficiency causes upregulation of the mTOR pathway and can be synergistically targeted with rapamycin and metformin. Pflugers Arch 466: 1591–1604. [DOI] [PubMed] [Google Scholar]
- Menamin UC, Cardwell CR, Hughes CM, Murray LM (2016). Metformin use and survival from lung cancer: a population‐based cohort study. Lung Cancer 94: 35–39. [DOI] [PubMed] [Google Scholar]
- Nagao S, Yamaguchi T, Kusaka M, Maser RL, Takahashi H, Cowley BD et al (2003). Renal activation of extracellular signal‐regulated kinase in rats with autosomal‐dominant polycystic kidney disease. Kidney Int 63: 427–437. [DOI] [PubMed] [Google Scholar]
- Rangan GK, Tchan MC, Tong A, Wong AT, Nankivell BJ (2016). Recent advances in autosomal‐dominant polycystic kidney disease. Intern Med J 46: 883–892. [DOI] [PubMed] [Google Scholar]
- Rehman G, Shehzad A, Khan AL, Hamayun M (2014). Role of AMP‐activated protein kinase in cancer therapy. Arch Pharm (Weinheim) 347: 457–468. [DOI] [PubMed] [Google Scholar]
- Riwanto M, Kapoor S, Rodriguez D, Edenhofer I, Segerer S, Wuthrich RP (2016). Inhibition of aerobic glycolysis attenuates disease progression in polycystic kidney disease. PLoS One 11: e0146654. [DOI] [PMC free article] [PubMed] [Google Scholar]
- Rowe I, Boletta A (2014). Defective metabolism in polycystic kidney disease: potential for therapy and open questions. Nephrol Dial Transplant 29: 1480–1486. [DOI] [PubMed] [Google Scholar]
- Rowe I, Chiaravalli M, Mannella V, Ulisse V, Quilici G, Pema M et al (2013). Defective glucose metabolism in polycystic kidney disease identifies a new therapeutic strategy. Nat Med 19: 488–493. [DOI] [PMC free article] [PubMed] [Google Scholar]
- Sherr CJ (1993). Mammalian G1 cyclins. Cell 73: 1059–1065. [DOI] [PubMed] [Google Scholar]
- Shillingford JM, Murcia NS, Larson CH, Low SH, Hedgepeth R, Brown N et al (2006). The mTOR pathway is regulated by polycystin‐1, and its inhibition reverses renal cystogenesis in polycystic kidney disease. Proc Natl Acad Sci U S A 103: 5466–5471. [DOI] [PMC free article] [PubMed] [Google Scholar]
- Stein M, Lin H, Jeyamohan C, Dvorzhinski D, Gounder M, Bray K et al (2010). Targeting tumor metabolism with 2‐deoxyglucose in patients with castrate‐resistant prostate cancer and advanced malignancies. Prostate 70: 1388–1394. [DOI] [PMC free article] [PubMed] [Google Scholar]
- Swindle MM, Makin A, Herron AJ, Clubb FJ Jr, Frazier KS (2012). Swine as models in biomedical research and toxicology testing. Vet Pathol 49: 344–356. [DOI] [PubMed] [Google Scholar]
- Takiar V, Nishio S, Seo‐Mayer P, King JD Jr, Li H, Zhang L et al (2011). Activating AMP‐activated protein kinase (AMPK) slows renal cystogenesis. Proc Natl Acad Sci U S A 108: 2462–2467. [DOI] [PMC free article] [PubMed] [Google Scholar]
- Torres VE, Harris PC, Pirson Y (2007). Autosomal dominant polycystic kidney disease. Lancet 369: 1287–1301. [DOI] [PubMed] [Google Scholar]
- Xu XD, Shao SX, Jiang HP, Cao YW, Wang YH, Yang XC et al (2015). Warburg effect or reverse Warburg effect? A review of cancer metabolism. Oncol Res Treat 38: 117–122. [DOI] [PubMed] [Google Scholar]
- Yamaguchi T, Nagao S, Wallace DP, Belibi FA, Cowley BD, Pelling JC et al (2003). Cyclic AMP activates B‐Raf and ERK in cyst epithelial cells from autosomal‐dominant polycystic kidneys. Kidney Int 63: 1983–1994. [DOI] [PubMed] [Google Scholar]
- Yamaguchi T, Wallace DP, Magenheimer BS, Hempson SJ, Grantham JJ, Calvet JP (2004). Calcium restriction allows cAMP activation of the B‐Raf/ERK pathway, switching cells to a cAMP‐dependent growth‐stimulated phenotype. J Biol Chem 279: 40419–40430. [DOI] [PubMed] [Google Scholar]
Associated Data
This section collects any data citations, data availability statements, or supplementary materials included in this article.
Supplementary Materials
Figure S1 Supporting information.
Table S1 The treatment scheme and the methods used for specimen collection.
Table S2 The results of renal vesicles by CT scanning.


