Abstract
Objective:
The purpose of this study was to introduce combined multi-wavelength photoacoustic (PA) and plane-wave ultrasound (US) imaging referred to as mwPA/pwUS imaging capable of probing the rapid dynamic behavior of optically activated phase-change contrast agents.
Methods:
A dedicated mwPA/pwUS imaging sequence was developed based on a programmable US system synchronized with a tunable laser to irradiate tissue with laser pulses at desired optical wavelengths and to acquire post-laser-pulse PA images followed by ultrafast plane-wave US images. To evaluate the mwPA/pwUS imaging, a capillary filled with optically responsive perfluorohexane nanodroplets (PFHnDs) containing a dye with the peak absorption at 760 nm was imaged with optical wavelengths ranging from 700 nm to 940 nm. The differences between post-laser ultrafast US images (i.e., differential US (ΔUS)) were taken to visualize the recondensation dynamics of PFHnDs at each wavelength.
Results:
The PA images of PFHnDs showed higher contrast near 760 nm, corresponding to the peak absorption of the dye encapsulated in the PFHnDs. Moreover, the ΔUS signals immediately after 760 nm pulsed-laser irradiation were also high due to the increased US contrast associated with vaporized PFHnDs.
Conclusion:
The mwPA/pwUS imaging allowed for the US-based optical spectroscopic characterization of PFHnDs and their dynamics.
Significance:
The introduced mwPA/pwUS imaging sequence can be used in various clinical applications where both spectroscopic PA imaging of endogenous and/or exogenous chromophores and ultrafast US imaging of phase-change nanodroplets are desired.
Keywords: Multi-wavelength laser, optically triggered nanodroplets, spectroscopic photoacoustic imaging, phase-change contrast agents, ultrafast ultrasound imaging
I. Introduction
PHASE-change ultrasound contrast agents such as perfluorocarbon nanodroplets have demonstrated promising potential in various diagnostic ultrasound and therapeutic applications [1, 2]. Unlike traditional microbubbles (usually 1–5 μm diameter), phase-change contrast agents can be synthesized at sub-micrometer sizes, which allows them to extravasate from the intra-vascular space [3, 4]. In addition, because of their relative stability, these phase-change contrast agents can circulate longer than microbubbles [5]. Once administered, they can be vaporized by an acoustic trigger to undergo a liquid-to-gas phase transition, providing on-demand high contrast ultrasound [6, 7].
Optically triggered nanodroplets (nDs) are a new class of phase-change contrast agents [8]. These nanodroplets contain optical absorbers (e.g., dyes or nanoparticles) that can be used to vaporize perfluorocarbon nDs in response to pulsed-laser irradiation [8–11]. Perfluorohexane nanodroplets (PFHnDs) with the boiling point (56°C), higher than the physiological body temperature (37°C), recondense after vaporization. Importantly, this vaporization-condensation process is repeatable, which offers repeated high-contrast photoacoustic (PA) and ultrasound (US) signals. Here, PA signals are generated from both the vaporization of PFHnDs and the thermal expansion of dye within PFHnDs. US signals are increased due to an acoustic backscattering from the transient microbubbles formed right after vaporization of PFHnDs.
The recondensation of PFHnDs is a function of many factors including core type, droplet size, photoabsorber type, local optical fluence, local temperature, local acoustic pressure, and local viscoelasticity [12–14]. The droplet recondensation is, therefore, transient and stochastic in general. Previously, the gas-to-liquid transition of PFHnDs captured via ultrasound imaging was demonstrated in several applications including super-resolution imaging of the vasculature and contrast-enhanced imaging of the mouse lymph node [13, 15, 16]. However, it has been experimentally shown that the recondensation of the PFHnDs typically takes just a few milliseconds although it could vary from a few microseconds to tens of milliseconds [13, 14]. Therefore, high-frame-rate ultrasound imaging is required to capture the gaseous state of vaporized PFHnDs prior to recondensation.
Previously, PFHnDs were imaged using a preclinical US and PA imaging system (Vevo 2100, FUJIFILM VisualSonics, Inc., Toronto, ON, Canada), where laser illumination was not synchronized with US imaging; this was done to achieve high-frame-rate US imaging during laser activation of the PFHnDs [13, 15, 16]. Consequently, no corresponding PA images were obtained due to technical limitations of the US/PA system, operating at 20 Hz or slower. Thus, high frame rate US imaging synchronized with PA imaging is desired to fully exploit the benefits of optically triggered contrast agents such as PFHnDs.
Introducing a tunable laser to trigger nDs containing photoabsorbers with distinct optical absorption peaks allows for selective activation of nDs, enabling multiplexed imaging of molecularly targeted nDs. A previous study has shown that a subset of perfluoropentane nanodroplets (PFPnDs) can be selectively activated at the wavelength corresponding to the particular optical dye inside the PFPnDs, whereas the other PFPnDs containing the dye with different peak absorption were not activated [17]. Due to the low boiling point of perfluoropentane (29°C), the PFPnDs vaporize but do not recondense. Therefore, low-frame-rate US and spectroscopic PA (sPA) imaging were used. However, to extend this method to image PFHnDs, high-frame-rate US with sPA imaging is needed. In addition, sPA imaging not only enables the selective activation and imaging of nDs, but also allows for the quantification of chromophores’ concentrations.
The goal of tins study was to design, implement, and test an imaging sequence capable of acquiring spectroscopic PA (sPA) images followed by ultrafast ultrasound images. This imaging sequence, referred to as multi-wavelength PA and plane-wave US (mwPA/pwUS) imaging, can capture the dynamic behavior of PFHnDs and can be used in various applications including super-resolution imaging, contrast-enhanced imaging, and molecular multiplex imaging.
II. Multi-Wavelength PA and Plane-Wave US imaging
A. System Configuration
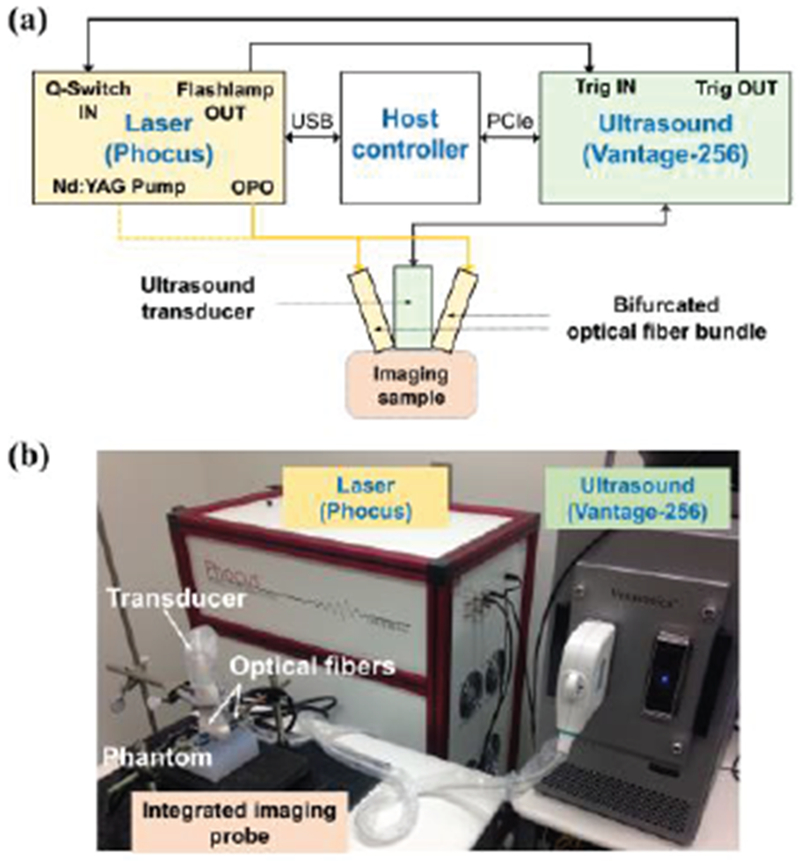
To implement mwPA/pwUS imaging, a programmable ultrasound system (Vantage 256™, Verasonics Inc., Kirkland, WA, USA) and a tunable pulsed laser (Phocus Mobile, Opotek Inc., Carlsbad, CA, USA) were interfaced and synchronized with a host controller (Fig. 1). Bifurcated optical fiber bundles placed at two sides of a linear array transducer were connected to the laser system to irradiate the imaging volume with laser pulses at 1,064 nm (Nd:YAG primary wavelength) or 690 nm – 950 nm (Nd:YAG laser pumped OPO system). To tune the laser wavelength, the laser was controlled by the host controller using dedicated dynamic-link libraries. Using the MATLAB (MathWorks, Natick, MA, USA), customized imaging routines were developed to sweep the optical wavelength and to acquire post-laser-pulse PA and ultrafast US images.
Fig. 1.

(a) Block diagram and (b) photograph of the mwPA/pwUS system containing an ultrasound imager, a laser system, a host controller, and an integrated imaging probe consisting of an ultrasound transducer and optical fiber bundles.
B. Imaging sequence
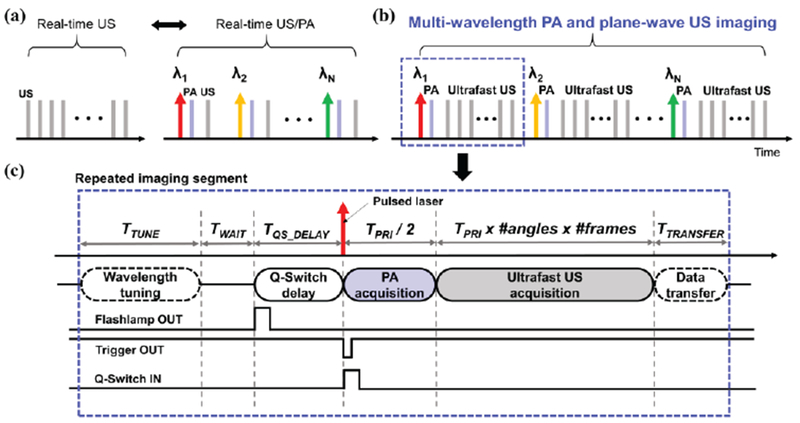
The overall imaging sequence consisted of real-time US/PA imaging as a default mode (Fig. 2a) and mwPA/pwUS imaging as an acquisition mode (Fig. 2b). The default real-time imaging was used to identity imaging targets before switching to the acquisition mode. In the mwPA/pwUS imaging, laser pulses with pre-selected wavelengths (i.e., λ1, λ2, …, λN) were used for two purposes: to activate PFHnDs, and/or to obtain sPA images. After irradiating the tissue with a laser pulse at a desired wavelength and obtaining a corresponding PA image, ultrafast US imaging captured the temporal dynamics of PFHnDs.
Fig. 2.

(a) Real-time US and real-time US/PA imaging mode. (b) mwPA/pwUS imaging mode, where gray lines present ultrafast ultrasound frames acquired as a function of time, and red, yellow, and green lines present multi-wavelength laser pulses. Light blue lines indicate photoacoustic frames, (c) A detailed view of an imaging segment of the overall mwPA/pwUS imaging.
The imaging sequence started with irradiation of a laser pulse tuned to a particular wavelength, followed by PA and US imaging. Each segment of an imaging sequence, outlined using a blue dotted rectangular box (Figs. 2b and 2c), consisted of several modules including wavelength tuning, Q-Switch delay, PA image acquisition, ultrafast US image acquisition, and data transfer (Fig. 2c). For TTUNE, the laser system was tuned to produce a desired optical wavelength. Them the ultrasound system waited for TWAIT for a “flashlamp OUT” trigger signal from the laser system. The flashlamp signal is generally periodic, and in the case of our laser system, it was repeated every 0.1 sec (10 Hz). Once triggered, the ultrasound system sent out a “trigger OUT” signal after a pre-determined Q-Switch delay (TQS_DELAY) to irradiate a laser light. After the “Q-Switch IN” signal from the Verasonics system activated laser pulse generation, PA acquisition began immediately and continued for half of a pre-defined US pulse-repetition interval (PRI) (i.e., TPRI/2). Thus, the Verasonics system controlled the Q-Switch delay signal, determining the laser fluence. Then, ultrafast US images were acquired based on the user-defined number of plane-wave angles and frames. Each imaging segment per laser pulse concluded with transfer of captured data (TTRANSFER).
For mwPA/pwUS imaging, the single-wavelength PA and ultrafast imaging was repeated for each optical wavelength, i.e., until the last optical wavelength (λN) was reached (Fig. 2b).
C. PFHnD Synthesis and Phantom Experiments
The PFHnDs were synthesized by sonication-based methods, described in detail elsewhere [16]. The resulting PFHnDs consisted of a fluorosurfactant (Zonyl FSO, Sigma-Aldrich, St. Louis, MO, USA) shell with a liquid perfluorohexane (FluoroMed, L.P., Round Rock, TX, USA) and an optical dye (Epolight 9151, Epolin Inc., Newark, NJ, USA). The optical absorption peak of the dye was around 760 nm.
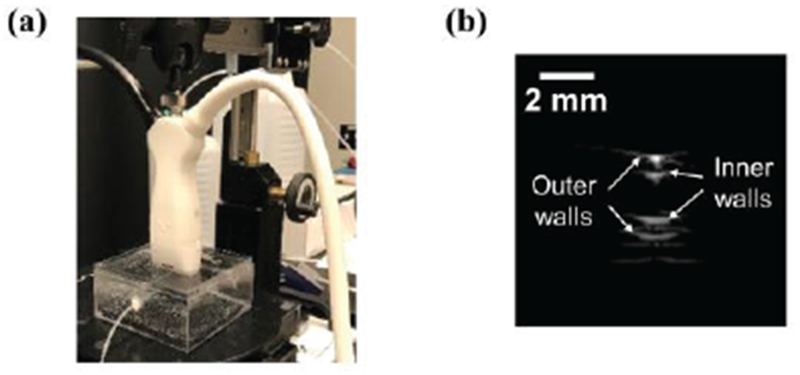
To test the developed system, a phantom containing a small capillary (inner and outer diameters are 1.6 mm and 2.9 mm, respectively), filled with PFHnDs and positioned horizontally in a plastic cuvette, was prepared (Fig. 3a). The integrated imaging probe was positioned above the tube phantom, and the phantom was imaged such that the capillary tube was orthogonal to the imaging plane (Fig. 3b).
Fig. 3.

(a) Experimental setup for imaging PFHnDs and (b) an example B-scan ultrasound image of the cross-section of the tube.
A linear array transducer (LZ201, FUJIFILM VisualSonics Inc., Toronto, ON, Canada) integrated with optical fibers was used. This transducer was connected to the ultrasound system via an adapter (UTA 360, Verasonics Inc., Kirkland, WA, USA). A single angle (0°) of a plane wave with a center frequency of 15.6 MHz (i.e., the wavelength was 98.6 μm) at a pulse repetition frequency (PRF) of 3 kHz was used for ultrafast US imaging. For an imaging depth of 20 mm, the PRF can be up to 38.5 kHz. However, to avoid reverberation artifacts, a PRF of 3 kHz was used in our study. Because angular compounding was not used, the effective frame rate was the same as the PRF. An optical wavelength range from 700 nm to 940 nm with a 30-nm step was used. At each wavelength, a single PA image and 30 US images were collected and displayed using a logarithmic scale with a dynamic range of 40 dB. To allow for better visualization of the recondensation of PFHnDs, the static signals were rejected by taking a difference between adjacent US frames.
III. Results and Discussion
PA and differential US (ΔUS) images obtained from the tube containing PFHnDs are shown in Fig. 4. Because PFHnDs had the dye with a peak optical absorption at 760 nm, the PA signals are stronger near 760 nm than those at other wavelengths. Starting from 790 nm, the magnitude of PA signals decreases as wavelength increases. The corresponding ΔUS images obtained from the first and second US images are presented as a function of wavelength (Fig 4). Given that the ΔUS images represent differences between consecutive images right after the laser activation of PFHnDs, the higher signals in ΔUS images indicate that PFHnDs were successfully vaporized and recondensed. Similar to the PA images, ΔUS signals were high at around 760 nm. The ΔUS signals at optical wavelengths of 880 nm, 910 nm, and 940 nm were very weak, indicating that at these wavelengths the PFHnDs were not vaporized and recondensed, thus producing no change in ΔUS images.
Fig. 4.

Photoacoustic and differential US (ΔUS) images of a capillary tube containing PFHnDs. The images were obtained at different optical wavelengths ranging from 700 nm to 940 nm. Each ΔUS image was generated by taking a difference between first two post-laser ultrasound frames.
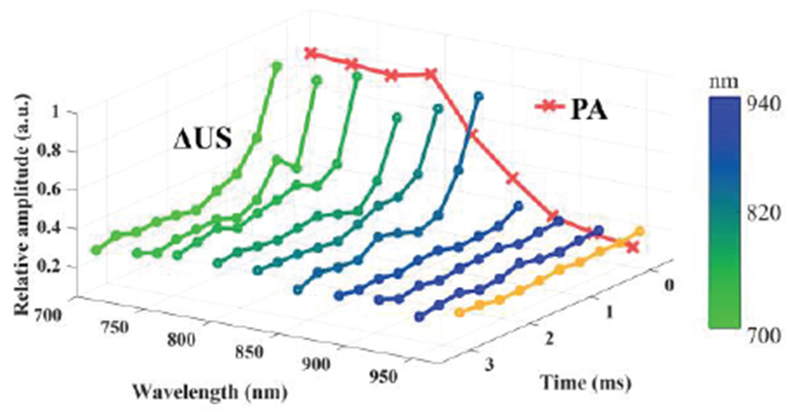
Mean intensity of PA (red lines) and ΔUS (green to blue lines) signals inside the tube as a function of both optical wavelength and time is plotted in Fig. 5. Both PA and ΔUS signals are clearly wavelength dependent. Although the peak absorption of the dye was at 760 nm, the PA signals were strong within a range from 700 nm to 820 nm due to spectral shift and/or broadening of the absorption of the dye encapsulated in the droplet shell. The PA signals started to decay as wavelength increases beyond 850 nm. The ΔUS signals at higher wavelengths (> 880 nm) do not change significantly over time, which indicates that if the laser wavelength is far from the peak absorption, no vaporization of PFHnDs occurs, and, therefore, ΔUS signals remain low and almost the same as the ΔUS signals under no laser irradiation (orange line in Fig. 5). However, for the ΔUS signals at lower wavelengths (< 850 nm), the large amplitude of ΔUS right after laser pulses demonstrates the occurrence of the PFHnD vaporization. As the PFHnDs recondensed overtime, the AUS signals accordingly reduced.
Fig. 5.

Mean intensity of PA and ΔUS images inside the tube as a function of optical wavelength and time after each laser pulse. Orange ΔUS line was obtained with US images under no laser irradiation.
In the current study, we observed the vaporization and the recondensation of the PFHnDs repeatedly at the same location. In our previous study, we have shown that the PFHnDs, can repeatedly vaporize and recondense for more than a few thousand times [15]. In the future studies, we will employ the developed imaging sequence to characterize the dynamics of PFHnDs quantitatively.
We have demonstrated the feasibility of mwPA/pwUS imaging using PFHnDs. Although an exogenous agent was used in our study, use of mwPA/pwUS imaging is not limited to contrast-enhanced ultrasound imaging and could be used in various clinical applications. For example, our mwPA/pwUS imaging should be able to simultaneously assess the oxygen saturation level for tumor characterization based on the sPA imaging mode and visualize the dynamics of PFHnDs for tumor detection based on the ultrafast imaging mode [15, 18]. Thus, our approach can be potentially used for both detection and characterization of cancer.
IV. Conclusion
We have introduced combined mwPA/pwUS imaging as a tool to probe dynamic phase-change contrast agents. The ability of mwPA/pwUS imaging was demonstrated in the phantom study where a capillary tube containing PFHnDs was visualized and analyzed. We have shown that both acoustic and optical features of the PFHnD dynamic behavior were captured as a function of time and optical wavelength. Our future study will include testing and optimization of the developed imaging method in in vivo studies.
Acknowledgment
The authors would like to thank Kristina Hallam of the Georgia Institute of Technology and Emory University School of Medicine for providing custom-made perfluorohexane nanodroplets for this study.
This work was supported by the U.S. National Institute of Health under grants CA149740 and CA158598, and by the Breast Cancer Research Foundation under a grant BCRF-17-043.
Contributor Information
Heechul Yoon, School of Electrical and Computer Engineering, Georgia Institute of Technology, Atlanta, GA, USA (heechul.yoon@gatech.edu).
Stanislav Y. Emelianov, School of Electrical and Computer Engineering, Georgia Institute of Technology, Atlanta, GA USA; Wallace H. Coulter Department of Biomedical Engineering, Georgia Institute of Technology and Emory University School of Medicine, Atlanta, GA, USA.
References
- [1].Sheeran PS and Dayton PA, “Phase-Change Contrast Agents for Imaging and Therapy,” Curr. Pharm. Des, vol. 18, pp. 2152–2165, May 2012. [DOI] [PMC free article] [PubMed] [Google Scholar]
- [2].Lin C-Y and Pitt WG, “Acoustic Droplet Vaporization in Biology and Medicine,” BioMed Res. Int, vol. 2013, pp. 1–13, Oct. 2013. [DOI] [PMC free article] [PubMed] [Google Scholar]
- [3].Prabhakar U, et al. , “Challenges and Key Considerations of the Enhanced Permeability and Retention Effect for Nanomedicine Drug Delivery in Oncology,” Cancer Res, vol. 73, pp. 2412–2417, Apr. 2013. [DOI] [PMC free article] [PubMed] [Google Scholar]
- [4].Martin KH and Dayton PA, “Current status and prospects for microbubbles in ultrasound theranostics,” Wiley Interdiscipl. Rev. Nanomed. Nanobiotechnol, vol. 5, pp. 329–345, Jul-Aug 2013. [DOI] [PMC free article] [PubMed] [Google Scholar]
- [5].Ferrara K, et al. , “Ultrasound Microbubble Contrast Agents: Fundamentals and Application to Gene and Drug Delivery,” Annu. Rev. Biomed. Eng, vol. 9, pp. 415–447, Aug. 2007. [DOI] [PubMed] [Google Scholar]
- [6].Rapoport N, et al. , “Ultrasound-mediated tumor imaging and nanotherapy using drug loaded, block copolymer stabilized perfluorocarbon nanoemulsions,” J. Control. Release, vol. 153, pp. 4–15, Jul. 2011. [DOI] [PMC free article] [PubMed] [Google Scholar]
- [7].Matsunaga TO, et al. , “Phase-Change Nanoparticles Using Highly Volatile Perfluorocarbons: Toward a Platform for Extravascular Ultrasound Imaging,” Theranostics, vol. 2, pp. 1185–1198, Nov. 2012. [DOI] [PMC free article] [PubMed] [Google Scholar]
- [8].Wilson K, et al. , “Biomedical photoacoustics beyond thermal expansion using triggered nanodroplet vaporization for contrast-enhanced imaging,” Nat. Commun, vol. 3, p. 618, Jan. 2012. [DOI] [PubMed] [Google Scholar]
- [9].Hannah A, et al. , “Indocyanine Green-Loaded Photoacoustic Nanodroplets: Dual Contrast Nanoconstructs for Enhanced Photoacoustic and Ultrasound Imaging,” ACS Nano, vol. 8, pp. 250–259, Jan. 2014. [DOI] [PMC free article] [PubMed] [Google Scholar]
- [10].Lin S, et al. , “Optically and acoustically triggerable sub-micron phase-change contrast agents for enhanced photoacoustic and ultrasound imaging,” Photoacoustics, vol. 6, pp. 26–36, Jun. 2017. [DOI] [PMC free article] [PubMed] [Google Scholar]
- [11].Strohm E, et al. , “Vaporization of perfluorocarbon droplets using optical irradiation,” Biomed. Opt. Express, vol. 2, pp. 1432–1442, Jun. 2011. [DOI] [PMC free article] [PubMed] [Google Scholar]
- [12].Hannah AS, “Optically-triggered nanodroplets for enhanced ultrasound and photoacoustic imaging,” Ph.D. thesis, Biomedical Engineering, The University of Texas at Austin, Austin, TX, USA, 2015. [Google Scholar]
- [13].Luke GP, et al. , “Super-resolution ultrasound imaging in vivo with transient laser-activated nanodroplets,” Nano Lett, Apr. 2016. [DOI] [PMC free article] [PubMed] [Google Scholar]
- [14].Yu J, et al. , “Vaporization and recondensation dynamics of indocyanine green-loaded perfluoropentane droplets irradiated by a short pulse laser,” Appl. Phys. Lett, vol. 109, p. 243701, 2016. [Google Scholar]
- [15].Yoon H, et al. , “Contrast-enhanced ultrasound imaging in vivo with laser-activated nanodroplets,” Med. Phys, vol. 44, pp. 3444–3449, Jul. 2017. [DOI] [PMC free article] [PubMed] [Google Scholar]
- [16].Hannah AS, et al. , “Blinking Phase-Change Nanocapsules Enable Background-Free Ultrasound Imaging,” Theranostics, vol. 6, pp. 1866–1876, Jul. 2016. [DOI] [PMC free article] [PubMed] [Google Scholar]
- [17].Santiesteban D, et al. , “Multicolor perfluorocarbon nanodroplets for multiplexed ultrasound and photoacoustic imaging,” in Ultrasonics Symposium (IUS), 2017 IEEE International, 2017, pp. 1–1. [Google Scholar]
- [18].Rich LJ and Seshadri M, “Photoacoustic monitoring of tumor and normal tissue response to radiation,” Sci. Rep, vol. 6, p. 21237, 02/17/online 2016. [DOI] [PMC free article] [PubMed] [Google Scholar]


