Abstract
Objectives: Widespread adoption of recent recommendations for minimal residual disease (MRD) detection in myeloma has partly been impeded by a paucity of studies detailing multiparameter flow cytometry (MPF) assay validation. In response, we have validated a novel and efficient single-tube 10-color assay for MRD detection that incorporates the recently recommended plasma cell markers.
Methods: Aspirate samples from 53 patients with plasma cell disorder were analyzed using a novel single-tube 10-color method. The limit of detection, precision of measurement, and linearity of measurement of our new assay were determined using serial dilution experiments. The stability of the new antibody cocktail and the viability/specificity of stained samples were evaluated using serial time course measurements.
Results: There was a high degree of quantitative agreement between our new 10-color method and an established eight-color method. Four positive samples detected by the 10-color assay were below or at the limit of detection of the eight-color assay, confirming its high sensitivity. In two cases, subsequent revision of the International Myeloma Working Group Uniform Response Criteria was necessary.
Conclusion: Adoption of our validated 10-color assay would enable clinical laboratories to satisfy current MRD recommendations without significantly increasing the demands on current workflow practices.
Keywords: MRD, Minimal residual disease, Multiple myeloma, Plasma cell disorder, Multiparameter flow cytometry, Single tube, 10-color, Validation
Multiple myeloma (MM) remains a largely incurable disease despite improvements in the progression-free survival (PFS) and overall survival (OS) following the advent of high-dose melphalan and autologous stem cell transplantation (ASCT). 1 However, with the advent of novel first-line therapies such as immunomodulatory drugs and proteasome inhibitors, increasing numbers of patients achieve a complete response (CR), as determined by a reduction in the plasma cell burden below 5% of the bone marrow cellularity, absence of urine and serum paraprotein by immunofixation, and attainment of a normal κ/λ free chain ratio. 2-6 While 5-year survival now approaches 50% and 70% in transplant-ineligible and transplant-eligible patients, respectively, the observation that almost all patients attaining CR subsequently relapse implies that current parameters of CR fail to detect significant residual disease. 2 , 7 , 8 Consequently, there has been a concerted effort to establish and validate a means of detecting and monitoring minimal residual disease (MRD) in MM analogous to that successfully applied to chronic myeloid leukemia and lymphoblastic leukemia/lymphoma. Several methods of MRD detection have been developed and extensively described, including multiparameter flow cytometry (MPF), allele-specific oligonucleotide polymerase chain reaction, fluorine-18 fluorodeoxyglucose positron emission tomography–computed tomography, and next-generation sequencing (recently reviewed in Biran et al 9 ). While each of these methods demonstrates particular advantages and disadvantages, MPF has been consistently advanced as an important tool in determining MRD on the basis of its widespread availability in clinical practice, near-universal applicability, and high sensitivity. Indeed, several studies show a strong positive correlation between mean fluorescence intensity (MFC)-detected MRD and worse PFS and OS in patients receiving high-dose therapy followed by ASCT and worse PFS in the setting of thalidomide maintenance therapy. 10 , 11 However, the prognostic value of MRD does appear to depend on the particular therapeutic regime and clinical setting, as evidenced by its failure to consistently predict PFS in transplant-ineligible patients. 10
Notwithstanding the evidence supporting MFC as an appropriate and practicable method of MRD detection, flow cytometry for MM faces challenges to widespread adoption, most of which can be attributed to a lack of uniformity in the areas of sample acquisition, processing, numbers of cells analyzed, and specific antigenic targets. Numerous protocols that vastly differ in recommendations for all these important variables have been published and recommended for use in the context of clinical trials for myeloma, likely accounting for differences in reported association with clinical outcomes. 10 , 12-15 Indeed, a 2013 survey of 30 major institutions in the United States highlighted the extent to which MRD testing in MM is characterized by significant heterogeneity in all aspects of MPF analysis. 16 Of particular note, few published studies present standard assay validation data pertaining to analytical precision, minimal limit of detection, recovery, and sample stability, as currently recommended for validation of flow cytometric assays. 17 To our knowledge, no study of MRD in MM has presented all of the recommended metrics.
Consensus recommendations arising from the recent National Cancer Institute (NCI) workshop, convened to establish guidelines for MM MRD testing, call for analysis of 3 to 5 × 10 6 cells using CD38, CD138, CD45, CD19, CD56, CD27, CD81, and CD117 in addition to κ and λ cytoplasmic light chain staining for confirmation of an abnormal plasma cell population. 18 Several assays using panels recommended by the workshop have been designed, usually including at least two tube panels with multiply redundant antigen evaluation between the tubes.
In light of the evidence supporting the utility of MRD detection in patients with myeloma using MFC and the NCI recommendations of at least a 10-marker panel, many centers already facing prohibitive demands on laboratory workflow are now confronted with the prospect of providing a two-tube MPF assay for myeloma MRD. Quite apart from the technical expertise required to evaluate plasma cell MRD, the need to rapidly process and run two eight-color tubes with the acquisition of 5 × 10 6 cells per tube places heavy demands on limited resources, including instrument time, analysis time, sample quality control, and data storage. Indeed, in our own laboratory, we run upward of 25 plasma cell samples per week, peaking at 10 to 15 cases per day. To address some of these issues, we designed and validated a novel single-tube 10-color assay that incorporates all of the recommended NCI markers and compared it with our current single-tube eight-color plasma cell MRD assay. We demonstrate the favorable performance of this novel assay and suggest that with the widespread adoption of 10-color instruments, this offers the prospect of providing optimal MRD detection by MPF while improving efficient resource utilization and reducing the need for inferential reasoning necessitated by multiple tube assays.
Materials and Methods
Patient Samples
A total of 53 bone marrow aspirate samples from patients with a documented or suspected plasma cell disorder were included in this study. The cohort included newly diagnosed (10), posttransplant (22), and pretransplant (21) specimens. Table 1 summarizes the patient clinicopathologic characteristics, and Table 2 includes the International Myeloma Working Group (IMWG) Uniform Response Criteria for Myeloma.
Table 1.
Clinicopathologic Characteristics of Patient Samples a
| Characteristic | No. of Patients (n = 53) |
|---|---|
| Sex | |
| Male | 24 |
| Female | 29 |
| Estimated % PCs in marrow by morphology ± IHC | |
| <1 | 2 |
| 1-5 | 20 |
| 5-10 | 3 |
| 10-20 | 4 |
| >20 | 12 |
| Not given | 12 |
| Clonal light chain (BMT) | |
| 8 | |
| 15 | |
| Polytypic | 17 |
| Not given | 13 |
| IgH translocation | |
| t(11;14) | 3 |
| t(4;14) | 2 |
| t(4;16) | 1 |
| Other | 0 |
| del (13q) | 10 |
| del (17p) | 6 |
BMT, bone marrow transplant; IgH, immunoglobulin H; IHC, immunohistochemistry; PC, plasma celll.
Table 2.
International Myeloma Working Group Treatment Response
| Response | Eight-Color MPF, No. | Ten-Color MPF, No. |
|---|---|---|
| Stringent complete response a | 10 | 8 |
| Complete response b | 4 | 6 |
| Very good partial response | 9 | 9 |
| Partial response | 3 | 3 |
| Stable disease | 3 | 3 |
| Progressive disease | 10 | 10 |
| Relapse | 4 | 4 |
| New diagnosis | 10 | 10 |
MPF, multiparameter flow cytometry.
a Complete response as defined above plus normal free light chain ratio and absence of clonal cells in bone marrow by immunohistochemistry or immunofluorescence.
b Negative immunofixation on the serum and urine and disappearance of any soft tissue plasmacytomas and less than 5% plasma cells in bone marrow.
The procedures followed were approved by the institutional review board in accordance with the ethical standards established by Memorial Sloan Kettering Cancer Center.
Plasma Cell Staining and Acquisition for Flow Cytometry
Single-Tube Eight-Color MPF Method
Cell counts and viability determination for bone marrow aspirate samples were determined using a Cellometer 2000 (Nexcelom Bioscience, Lawrence, MA). Unlysed samples were stained with a surface marker cocktail comprising CD117 PC5.5, CD19 BV421, CD138 APC, CD56 PC7, CD45 APC-H7, and CD38 BV510. After 15 minutes of incubation, samples were washed in PBA (phosphate-buffered saline + 0.3% bovine serum albumin) before being fixed and permeabilized (Fixation and Permeabilization Kit, Invitrogen, Waltham, MA). Permeabilized cells were subsequently stained with a cocktail of κ fluorescein isothiocyanate (FITC)/λ phycoerythrin (PE) and incubated for 30 minutes. Samples were finally washed with PBA and pelleted prior to acquisition by a BD FACSCanto II color flow cytometer (BD Biosciences, San Jose, CA) using a standard optical detection configuration. A target minimum of 1 × 10 6 cells were acquired for each sample, or the entire sample tube was drained.
Single-Tube 10-Color MPF Method
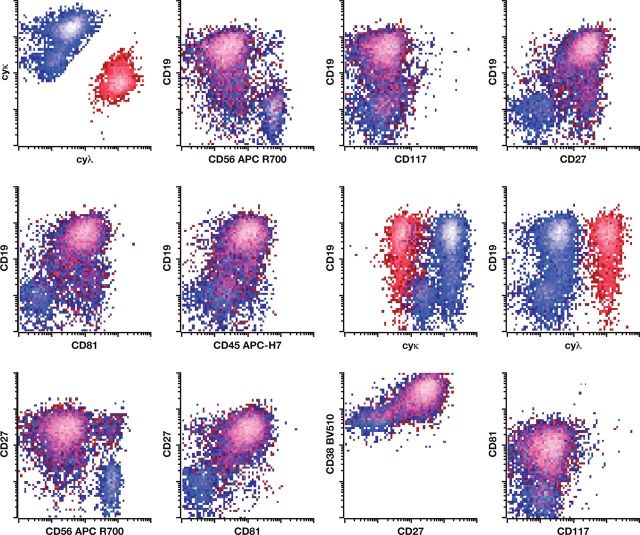
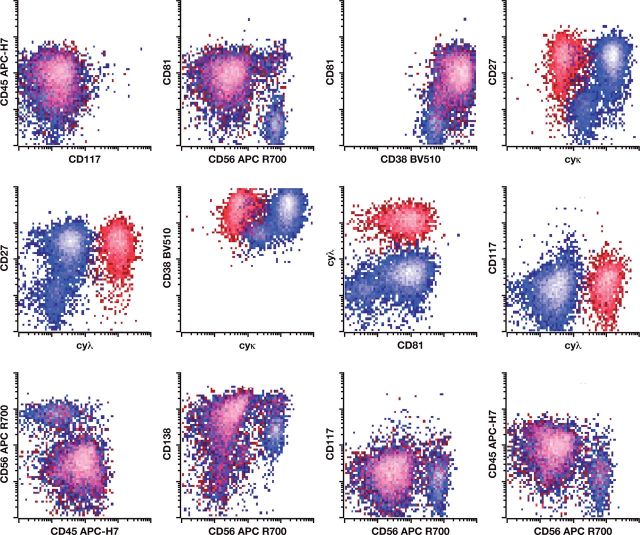
Cell counts and viability determination for bone marrow aspirate samples were determined using a Cellometer 2000. RBC lysis was performed using ammonium chloride lyse solution with samples resuspended in PBA prior to addition of a surface marker cocktail comprising CD117 PC5.5, CD19 PC7, CD138 APC, CD56 APC-R700, CD45 APC-H7, CD81 Pacific Blue, CD38 BV510, and CD27 BV605. (Bulk sample lysis was performed prior to staining to comply with the latest NCI recommendations for MRD detection in myeloma.) After 30 minutes of incubation, samples were lysed using FACS Lyse Solution (BD Biosciences) prior to washing, fixation, and permeabilization (Fixation and Permeabilization Kit, Invitrogen). Permeabilized cells were subsequently stained with a cocktail of κ FITC/λ PE and incubated for 15 minutes. Samples were finally washed with PBA and pelleted prior to acquisition by a BD FACSCanto 10-color flow cytometer using a standard optical configuration. A target minimum of 5 × 10 6 WBCs were acquired for each sample, or the entire sample tube was drained. An example of the gating strategy using this novel 10-color lyse/stain protocol to identify abnormal plasma cells is shown in Figure 1. Details of the antibodies described for both the eight- and 10-color MPF methods are provided in Table 3.
Figure 1.
Example of single-tube 10-color analysis for abnormal plasma cells. Flow cytometry reveals an abnormal plasma cell population having abnormal expression of CD19 (absent), CD38 (dim), CD45 (dim), CD56 (bright), CD27 (absent), and CD81 (absent) with monoclonal cytoplasmic light chain restriction. The abnormal plasma cells demonstrate normal expression of CD117 and CD138.
Table 3.
Antibodies for Eight- and 10-Color Multiparameter Flow Cytometry Detection of Plasma Cells
| Antibody | Source | Catalog No. |
|---|---|---|
| CD38 BV510 | BD Horizon (San Jose, CA) | 563251 |
| CD117 PC5.5 | Beckman Coulter (Miami, FL) | A66333 |
| CD81 Pacific blue | Beckman Coulter | B19717 |
| CD56 APC-R700 | BD Horizon | 657887 |
| CD56 PC7 | Beckman Coulter | A51078 |
| CD138 APC | Beckman Coulter | A87787 |
| CD45 APC-H7 | BD Horizon | 641408 |
| CD27 BV605 | BD Horizon | 562655 |
| CD19 BV421 | BD Horizon | 582440 |
| CD19 PC7 | Beckman Coulter | M3628U |
| FITC | DAKO (Carpinteria, CA) | F0434 |
| PE | DAKO | R0437 |
FITC, isothiocyanate; PE, phycoerythrin.
Interpretation of Results
For both MPF methods, samples with a cluster of 20 or more plasma cells demonstrating an aberrant phenotype were considered positive, and quantitation was provided as a percentage of WBCs. Samples containing a cluster of 10 to 19 abnormal plasma cells were regarded as positive but below the limit of quantitation.
Results
Sample Stability Using the 10-Color Method
To assess the maximum acceptable time limit between sample draw and flow cytometric analysis of 10-color stained samples, we used six fresh samples containing either normal or abnormal plasma cells. The samples were stained upon receipt (within 8 hours of collection) or stained 24 or 48 hours following receipt by the flow laboratory. All unprocessed samples were stored at 4 °C. We determined overall sample viability, proportion of plasma cells, and abnormal plasma cells present, as well as the percentage and intensity of positivity for all antigens in the 10-color panel. The proportion of plasma cells either remained stable or showed a slight increase over the 24- and 48-hour storage times, likely attributable to the degeneration of granulocytes during storage (data not shown). The absolute number of plasma cells declined by up to 40% in the samples stored for 48 hours (data not shown). There was no discernible qualitative loss of sensitivity for any of the samples, and no significant loss of antigen expression was observed.
Cocktail Stability
Standardization of flow cytometric analysis is greatly facilitated by cocktailing antibody reagents for multiple samples; this reduces pipetting errors and reduces the hands-on time for technologists. However, the cocktailing of antibodies carries a theoretical risk of antibody interaction and/or degradation within the cocktail matrix. We validated cocktail stability by comparing three samples stained with a freshly prepared cocktail and three samples stained with preprepared cocktails stored at 4 °C for each of 2, 7, and 14 days. We observed no significant changes in the stain index for any antibodies in the 10-color panel (data not shown). The same compensation matrix could be used for the analysis of all samples.
Analytic Accuracy of the 10-Color Method
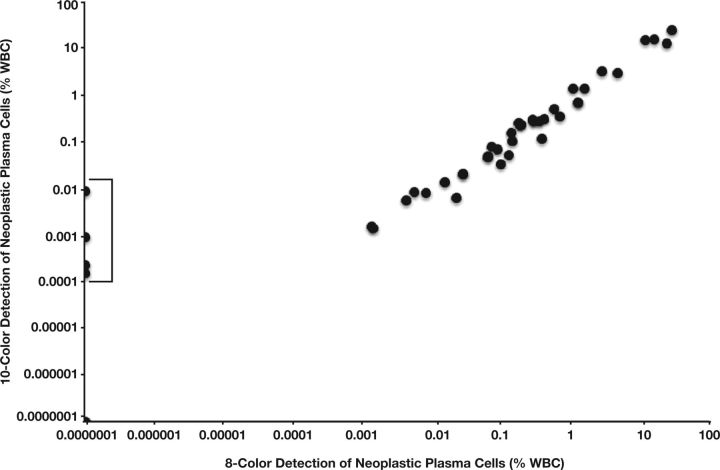
To assess the accuracy of the novel 10-color method, we performed a parallel study using both the new method and our established eight-color method to evaluate 53 samples received in our laboratory for routine analysis of a suspected or established plasma cell disorder. Overall, there was a high degree of quantitative agreement between methods Figure 2. Using Deming regression analysis, the relationship was described as y = 0.847x + 0.03; the intercept was not significantly different from 0, while a slightly decreased recovery population of plasma cells was evidenced by the slope of 0.847 (0.780-0.913). Four samples were detected below or at the theoretical limit of detection of the established eight-color method and within the detection limit of the new 10-color method; each of these samples was obtained from a posttransplant patient in whom MRD detection is most likely to be informative and of future clinical utility. Indeed, in two cases, the result of 10-color MRD detection altered the patient’s IMWG Uniform Response Criteria for MM from strict CR to CR (see Table 2). These findings demonstrate that the new testing approach shows significantly increased sensitivity at low abnormal plasma cell numbers without compromising analytical specificity.
Figure 2.
Analytic accuracy of a 10-color, single-tube multiparameter flow cytometry assay for the detection of neoplastic plasma cells. There was a high degree of quantitative agreement between the 10-color and eight-color methods. Using Deming regression analysis, the relationship was described as y = 0.847x + 0.03, R 2 = 0.96; the intercept was not significantly different from 0, while a slightly decreased recovery population of plasma cells was evidenced by the slope of 0.847 (0.780-0.913). Four samples (bracket) were detected below or at the theoretical limit of detection of the established eight-color method and within the detection limit of the new 10-color method.
Analytic Specificity of the 10-Color Method
Ten samples from patients with non–plasma cell disorders (chronic lymphocytic leukemia/Waldenström macroglobulinemia, myelodysplasia, or thrombocytopenia) were also evaluated by both the eight- and 10-color methods. No sample showed an abnormal plasma cell population, confirming equivalent specificity between methods (data not shown).
Limit of Detection, Precision of Measurement, and Linearity of Measurement Using the 10-Color Method
While clusters of 10 to 20 plasma cells are traditionally considered the limit for qualitative detection of a neoplastic population by flow cytometry, the theoretical quantitative limit of detection is driven by Poisson counting statistics where the SD is determined by the square root of the expected average number of events (SD = √Events), and the coefficient of variation (CV) is determined by the ratio of the SD to the mean (μ) (CV = SD/μ). For example, for a cluster of 20 events, this yields the theoretical minimal SD of 4.5 and CV of 22%. Ten events would be expected to yield a CV of at least 32%, slightly above the commonly expected 30% CV at the limit of detection. To empirically assess the imprecision of measurement near the theoretical limit of detection of the abnormal population, a spiking experiment was performed using five abnormal plasma cell samples of varying immunophenotype. An aspirate sample from a myelodysplastic marrow containing no abnormal plasma cells was spiked with the pooled abnormal plasma cells and sequentially diluted in triplicate to a target of 30 to 50 abnormal plasma cells. Each sample was independently processed and stained; the results are summarized in Table 4. The average imprecision was comparable to the theoretical limit. To estimate imprecision with larger numbers of plasma cells, we performed a dilution of a single abnormal plasma cell sample into a sample that contained only normal plasma cells. Imprecision did not exceed 20% levels of 5,000, 500, and 50 cells (data not shown). Of note, recovery of abnormal plasma cells increased at higher dilutions, a phenomenon that may be attributable to reduced autoaggregation.
Table 4.
Precision of Detection of Atypical Plasma Cells by 10-Color Multiparameter Flow Cytometry a
| Abnormal PCs | Total PCs | Abnormal PCs | Abnormal PCs | Total PCs | WBCs | ||||||||
|---|---|---|---|---|---|---|---|---|---|---|---|---|---|
| Tube No. | No. | Mean (% CV) | No. | Mean (% CV) | % of WBCs | Mean (% CV) | % of Total PCs | Mean (% CV) | % of WBCs | Mean (% CV) | No. | Mean (% CV) | |
| 1 | 4,538 | 11,811 | 0.3301 | 38.4218 | 0.8592 | 1,374,666 | |||||||
| 2 | 773 | 740.3 (3.8) | 8,406 | 8,519.3 (1.2) | 0.0383 | 0.0391 (2.1) | 9.1958 | 8.6935 (5.0) | 0.4161 | 0.4507 (6.7) | 2,019,964 | 1,894,977 (5.8) | |
| 725 | 8,537 | 0.0399 | 8.4924 | 0.4702 | 1,815,533 | ||||||||
| 723 | 8,615 | 0.0391 | 8.3923 | 0.4658 | 1,849,434 | ||||||||
| 3 | 123 | 113.0 (9.9) | 9,970 | 9,735.3 (6.8) | 0.0057 | 0.0067 (13.1) | 1.2337 | 1.1662 (13.5) | 0.4646 | 0.5824 (20.2) | 2,146,026 | 1,717,540.7 (21.7) | |
| 101 | 10,244 | 0.0069 | 0.9859 | 0.7001 | 1,463,180 | ||||||||
| 115 | 8,992 | 0.0075 | 1.2789 | 0.5826 | 1,543,416 | ||||||||
| 4 | 27 | 30.0 (10.0) | 11,970 | 13,053.7 (10.4) | 0.0015 | 0.0016 (5.5) | 0.2256 | 0.2299 (3.0) | 0.6486 | 0.6797 (4.6) | 1,845,478 | 1,917,478 (6.1) | |
| 30 | 12,606 | 0.0016 | 0.2380 | 0.6799 | 1,854,164 | ||||||||
| 33 | 14,585 | 0.0016 | 0.2263 | 0.7105 | 2,052,792 | ||||||||
| 5 | 0.0 | 1,010.0 | 0.0000 | 0.0000 | 0.3701 | 272,866 | |||||||
CV, coefficient of variation; PC, plasma cell.
a A bone marrow aspirate sample containing no plasma cells was spiked with abnormal plasma cells (tube 1) before being serially diluted in triplicate (tubes 2-5) to a target cell number of 30 to 50 plasma cells (tube 4). The average imprecision of the three diluted samples in tube 4 was comparable to the theoretical limit of detection for each sample as determined by Poisson counting statistics.
Discussion
Several large studies have established that the determination of MRD in myeloma by MPF correlates with PFS and OS. 10 , 11 In turn, the NCI has recently proposed a two-tube 10-color protocol for the evaluation of plasma cell disorders, including MRD, with the aim of standardizing laboratory approaches to MPF. 18 Published data examining MRD by MPF suggests that sensitivities in the range of 0.001% to 0.0005% neoplastic plasma cells can reasonably be expected. 19 , 20 However, there is significant variation in the methods adopted by various institutions for determining MM MRD, with few centers publishing detailed descriptions of their assay design and validation.
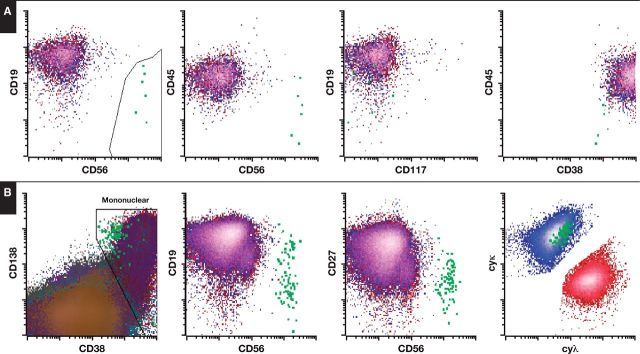
In response, we have designed a novel single-tube 10-color assay for the detection of plasma cell MRD that meets the recommendations of the recent NCI guidelines and incorporates all of the specified markers. Moreover, we have evaluated the performance of this novel assay against an established and validated eight-color assay using routine clinical samples. We show that our new testing approach shows significantly increased sensitivity at low abnormal plasma cell numbers without compromising analytical specificity. Of 53 samples analyzed, four were detected below or at the theoretical limit of detection of the established eight-color method and within the detection limit of the new 10-color method Figure 3. Importantly, this resulted in an alteration of the IMWG response categorization in two patients. Of note, this improved sensitivity likely reflects the approximately fivefold increase in WBCs analyzed as part of the 10-color MPF protocol (target of 5 × 10 6 WBCs vs 1 × 10 6 WBCs) that satisfies the latest recommendations for MRD analysis issued by the NCI. In addition to demonstrating the favorable performance of the 10-color method, we present a detailed description of the assay validation, including analytical precision, minimal limit of detection, recovery, and sample stability.
Figure 3.
Example of single-tube 10-color vs eight-color analysis for abnormal plasma cells. A, In this example, flow cytometry using the eight-color method was reported as negative, although six abnormal events were identified (cutoff for positive result being ≥10 abnormal cells). B, The same sample processed and acquired using the 10-color method identified 84 abnormal events and was therefore reported as positive.
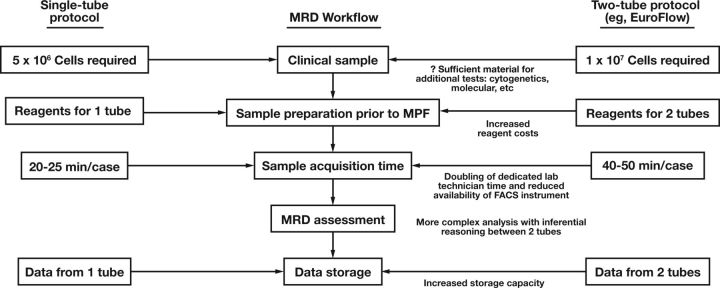
While many laboratories already perform MPF for plasma cell disorders, provision of a more sophisticated assay for MRD detection using an expanded panel of markers requiring multiple tubes (as proposed by the NCI) imposes significant demand on available clinical material and limited laboratory resources. The recommendation of acquiring 5 × 10 6 cells (per tube) means that a two-tube assay essentially requires twice the aspirate material of a single-tube assay. With competing demand for other clinical tests such as cytogenetics and various established and burgeoning molecular assays, this may complicate workflow practices for the management of patients with myeloma. In terms of the clinical laboratory, multiple tubes inevitably result in increased reagent costs. More significantly, compared with a single-tube assay, two tubes necessitate a doubling of the time required by a dedicated laboratory technician to acquire the sample prior to analysis and reduce the availability of the fluorescence-activated cell sorting equipment for other clinical samples. Finally, analyzing a single-tube assay is relatively simple compared with a two-tube assay, with no need for inferential reasoning between tubes. The potential advantages of adopting a single-tube MRD assay for myeloma are summarized in Figure 4.
Figure 4.
Comparison of the workflow for a single-tube and two-tube myeloma minimal residual disease (MRD) assay. MPF, multiparameter flow cytometry.
Taken together, we propose that our validated single-tube 10-color assay for the analysis for MM MRD represents a suitably sensitive and discriminating means of MRD in myeloma that allows clinical flow laboratories to incorporate the requirement for expanded antigen detection and increased event analysis, with the convenience and resource efficiency of a single-tube assay.
References
- 1. Child JA, Morgan GJ, Davies FE, et al. High-dose chemotherapy with hematopoietic stem-cell rescue for multiple myeloma. N Engl J Med. 2003;348:1875-1883. [DOI] [PubMed] [Google Scholar]
- 2. Richardson PG, Weller E, Lonial S, et al. Lenalidomide, bortezomib, and dexamethasone combination therapy in patients with newly diagnosed multiple myeloma. Blood. 2010;116:679-686. [DOI] [PMC free article] [PubMed] [Google Scholar]
- 3. Attal M, Lauwers-Cances V, Marit G, et al. Lenalidomide maintenance after stem-cell transplantation for multiple myeloma. N Engl J Med. 2012;366:1782-1791. [DOI] [PubMed] [Google Scholar]
- 4. McCarthy PL, Owzar K, Hofmeister CC, et al. Lenalidomide after stem-cell transplantation for multiple myeloma. N Engl J Med. 2012;366:1770-1781. [DOI] [PMC free article] [PubMed] [Google Scholar]
- 5. Anderson KC. Oncogenomics to target myeloma in the bone marrow microenvironment. Clin Cancer Res. 2011;17:1225-1233. [DOI] [PubMed] [Google Scholar]
- 6. Mailankody S, Korde N, Lesokhin AM, et al. Minimal residual disease in multiple myeloma: bringing the bench to the bedside. Nat Rev Clin Oncol. 2015;12:286-295. [DOI] [PMC free article] [PubMed] [Google Scholar]
- 7. Mateos MV, Oriol A, Martinez-Lopez J, et al. Bortezomib, melphalan, and prednisone versus bortezomib, thalidomide, and prednisone as induction therapy followed by maintenance treatment with bortezomib and thalidomide versus bortezomib and prednisone in elderly patients with untreated multiple myeloma: a randomised trial. Lancet Oncol. 2010;11:934-941. [DOI] [PubMed] [Google Scholar]
- 8. Kumar S, Flinn I, Richardson PG, et al. Randomized, multicenter, phase 2 study (EVOLUTION) of combinations of bortezomib, dexamethasone, cyclophosphamide, and lenalidomide in previously untreated multiple myeloma. Blood. 2012;119:4375-4382. [DOI] [PubMed] [Google Scholar]
- 9. Biran N, Ely S, Chari A. Controversies in the assessment of minimal residual disease in multiple myeloma: clinical significance of minimal residual disease negativity using highly sensitive techniques. Curr Hematol Malig Rep. 2014;9:368-378. [DOI] [PubMed] [Google Scholar]
- 10. Rawstron AC, Orfao A, Beksac M, et al. Report of the European Myeloma Network on multiparametric flow cytometry in multiple myeloma and related disorders. Haematologica. 2008;93:431-438. [DOI] [PubMed] [Google Scholar]
- 11. Paiva B, Gutierrez NC, Rosinol L, et al. High-risk cytogenetics and persistent minimal residual disease by multiparameter flow cytometry predict unsustained complete response after autologous stem cell transplantation in multiple myeloma. Blood. 2012;119:687-691. [DOI] [PubMed] [Google Scholar]
- 12. Rawstron AC. Immunophenotyping of plasma cells. Curr Protoc Cytom. 2006;Chapter 6:Unit6.23. [DOI] [PubMed] [Google Scholar]
- 13. Mateo G, Montalban MA, Vidriales MB, et al. Prognostic value of immunophenotyping in multiple myeloma: a study by the PETHEMA/GEM cooperative study groups on patients uniformly treated with high-dose therapy. J Clin Oncol. 2008;26:2737-2744. [DOI] [PubMed] [Google Scholar]
- 14. Frebet E, Abraham J, Genevieve F, et al. A GEIL flow cytometry consensus proposal for quantification of plasma cells: application to differential diagnosis between MGUS and myeloma. Cytometry B Clin Cytom. 2011;80:176-185. [DOI] [PubMed] [Google Scholar]
- 15. Manasanch EE, Salem DA, Yuan CM, et al. Flow cytometric sensitivity and characteristics of plasma cells in patients with multiple myeloma or its precursor disease: influence of biopsy site and anticoagulation method. Leuk Lymphoma. 2015;56:1416-1424. [DOI] [PMC free article] [PubMed] [Google Scholar]
- 16. Flanders A, Stetler-Stevenson M, Landgren O. Minimal residual disease testing in multiple myeloma by flow cytometry: major heterogeneity. Blood. 2013;122:1088-1089. [DOI] [PMC free article] [PubMed] [Google Scholar]
- 17. Wood B, Jevremovic D, Bene MC, et al. Validation of cell-based fluorescence assays: practice guidelines from the ICSH and ICCS, part V: assay performance criteria. Cytometry B Clin Cytom. 2013;84:315-323. [DOI] [PubMed] [Google Scholar]
- 18. Landgren O, Gormley N, Turley D, et al. Flow cytometry detection of minimal residual disease in multiple myeloma: lessons learned at FDA-NCI roundtable symposium. Am J Hematol. 2014;89:1159-1160. [DOI] [PubMed] [Google Scholar]
- 19. Ely S, Biran N, Chari A. What we mean when we talk about MRD in myeloma: a review of current methods. Part 1 of a two-part series. Curr Hematol Malig Rep. 2014;9:379-388. [DOI] [PubMed] [Google Scholar]
- 20. Roschewski M, Stetler-Stevenson M, Yuan C, et al. Minimal residual disease: what are the minimum requirements? J Clin Oncol. 2014;32:475-476. [DOI] [PubMed] [Google Scholar]


