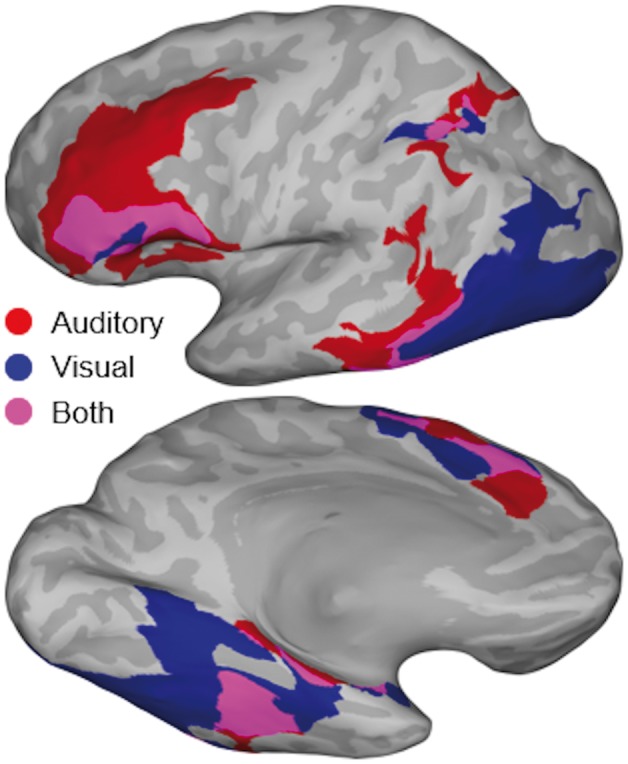
Figure 5.

Heteromodal semantic contrast map. Conjunction of SB-MEMA maps aligned to articulation revealing heteromodal regions of semantic-specific BGA. SB-MEMA contrast maps were calculated for both auditory (naming to definition versus reversed speech) and visual (picture naming versus scrambled images) conditions. These pairs of maps were generated for 250 ms time windows in the full second preceding articulation (four total pairs). As in Fig. 4, binary thresholds were applied to each map based on effect estimate, corrected confidence, and electrode coverage. These resulting binary masks were combined via logical conjunction to generate the final conjunction map shown in this figure. Regions with semantic-specific activity in the full second preceding articulation are shown: visual domain, blue; auditory domain, red; both domains, purple.
