

Abstract
Gene function prediction has proven valuable in formulating testable hypotheses. It is particularly useful for exploring biological processes that are experimentally intractable, such as meiotic initiation and progression in the human fetal ovary. In this study, we developed the first functional gene network for the human fetal ovary, HFOnet, by probabilistically integrating multiple genomic features using a naïve Bayesian model. We demonstrated that this network could accurately recapture known functional connections between genes, as well as predict new connections. Our findings suggest that known meiosis-specific genes (i.e., with functions only in meiotic processes in the germ cells) make either no or a few functional connections but are highly clustered with neighbor genes. In contrast, known nonspecific meiotic genes (i.e., with functions in both meiotic and nonmeiotic processes in the germ cells and somatic cells) exhibit numerous connections but low clustering coefficients, indicating their role as central modulators of diverse pathways, including those in meiosis. We also predicted novel genes that may be involved in meiotic initiation and DNA repair. This global functional network provides a much-needed framework for exploring gene functions and pathway components in early human female meiosis that are difficult to tackle by traditional in vivo mammalian genetics.
Keywords: computational prediction, fetus, meiosis, naive Bayesian network, oocyte development, ovary
Introduction
Meiosis is a sexual reproduction process that occurs in all eukaryotes. This program starts with one round of DNA replication followed by two rounds of cell division (Meiosis I and Meiosis II) to form haploid gametes. Meiosis I involves the segregation of homologous chromosomes, whereas Meiosis II is similar to mitosis with the segregation of sister chromatids [1, 2].
Human female meiosis is a highly complex process that takes decades to accomplish [1, 2]. All ovulated eggs initiate meiosis in the fetal ovary at ∼11–12 wk [3]. Oocytes enter meiotic prophase, and homologous chromosomes synapse and exchange genetic information (recombination). Oocytes then become arrested near the end of meiotic prophase (in dictyotene) before birth [1, 2]. Errors in meiotic initiation, synapsis, and/or recombination jeopardize the quality and quantity of oocytes and can lead to infertility, birth defects, and/or reduced female reproductive span. Indeed, alterations in maternal meiotic recombination are an important contributor to both autosomal and sex chromosome trisomies in humans [4].
However, meiotic prophase in female humans is challenging to study because it takes place in utero, and ovaries from healthy human fetuses are difficult to obtain. Consequently, less is known about human female meiosis than male meiosis. Studies focusing on female meiosis usually apply cytogenetic approaches to investigate the patterns of meiotic progression and recombination in oocytes from euploid and aneuploid fetuses [5–11]. Recent developments in fetal ovary tissue culture also allow us to explore meiotic progression and the chromosome pairing process [12, 13].
Mammalian meiotic genes are mainly identified by laborious procedures such as targeted mutagenesis in mice. For example, Dazl expression allows germ cells to acquire meiotic competency [14], and then retinoic acid induces Stra8 expression, which is required for meiotic initiation in the mouse fetal ovary [15, 16]. Genes involved in chromosome synapsis and recombination, such as Sycp3, Syce2, Spo11, Msh4, Mlh1, and Trip13, are essential for germ cell survival and meiotic progression [2]. Additionally, random chemical mutagenesis of whole animals and embryonic stem cells has identified candidate genes required for female meiosis, such as Mei1 and Ccnb1ip1 (Mei4) [17–19]. The temporal and spatial dynamics of meiotic gene expression can be further characterized in fetal oocytes using immunofluorescence approaches [20–24].
Despite these discoveries, we still know little of the way in which genes interact with each other during human female fetal development and how these interactions lead to differences in meiotic progression. Microarray approaches provide high throughput platforms to yield genomewide and unbiased gene expression measurements and have been used to monitor time-series expression profiles for the mouse embryonic ovary [25] and recently for the human fetal ovary [26]. These provide a valuable resource for probing the pathways and networks that govern meiotic dynamics in the female. However, the temporal profiles of gene expression were derived from ovaries that consist of both germ cells and somatic cells [25, 26]. Although the dynamic change in transcripts might be driven by germ cells that undergo meiosis, the contamination by somatic cells and the mixture of germ cells in different meiotic stages may confound expression profiles. Moreover, microarray technology is only sensitive for detection of transcriptionally regulated genes.
The establishment of a functional network by integrating diverse genomic datasets is invaluable to extend our understanding of meiotic initiation and progression in the human fetal ovary. This allows us to extract high-confidence functional links between genes and predict new genes through their connections with known meiotic genes. These predictions can further direct experiments to discover novel meiotic genes. Genomic feature integration to infer functional network was pioneered in the model organism S. cerevisiae [27–32]. The recent emergence of genomic information in mammals also allows us to predict gene functions in humans and mice [33–35]. Clearly, the prediction of gene function is much more complicated in mammals due to the complex genome organizations as well as to different developmental stages and tissue expression. Nevertheless, the integration of diverse information sources can improve prediction accuracy [30, 32].
In this article, we describe the development of the first genomewide functional network for the human fetal ovary, HFOnet, using a naïve Bayesian model to integrate diverse data types, including gene expression, protein-protein interaction, disease phenotype, protein domain, phylogeny, and gene ontology. Genes with similar functions are linked in the network, and functional modules are further extracted from the network. Our results show that the probabilistic integration of heterogeneous data can generate high-confidence measures for gene connections and improve prediction accuracy. Our findings suggest that known meiosis-specific genes (i.e., with functions only in meiotic processes in the germ cells) make few connections but are highly clustered with neighbors. In contrast, known nonspecific meiotic genes (i.e., with functions in both meiotic and nonmeiotic processes in the germ cells and somatic cells) tend to interact with numerous neighbors and exhibit low clustering, indicating that they are multi-taskers. We also predict novel genes that may be involved in meiotic initiation and DNA repair through their linkages with known meiotic genes. Our study leads to the detection of human meiotic pathways, for which a systematic understanding is currently lacking. Prediction of novel meiotic genes can be further validated through targeted experimental procedures.
Materials and Methods
Gold Standards
We used protein-protein interactions to define positive gold standards for functionally linked genes. This is a stringent definition, as functionally linked genes (e.g., enzymes in a metabolic pathway) need not interact physically. Human protein-protein interactions were collected from five databases: Human Protein Reference Database [36], Database of Interacting Proteins [37], Molecular INTeraction database [38], IntAct [39], and BioGrid [40]. Interactions from these databases were either manually or automatically curated from the literature. To identify interactions specific to the fetal ovary, we obtained a list of 7996 genes expressed in human fetal ovarian germ cells. This list was derived from two gene expression annotation databases—Electric Genetics (egenetics, http://www.egenetics.com) and Genomics Institute of the Novartis Research Foundation (gnf) Atlas [41]. We retrieved these expression data from Ensembl BioMart [42]. Thus, our positive gold standards consist of 20 034 pairs, with both genes expressed in human fetal ovarian germ cells (Table 1).
Table 1.
Genomic features and gold standards for predicting gene functional associations in the human fetal ovary.
| Parameter | No. of genes | No. of gene pairs |
|---|---|---|
| Genomic features | ||
| Gene expression | 16 285 | 132 592 470 |
| GO process | 25 597 | 327 590 406 |
| Phylogeny | 17 800 | 158 411 100 |
| Protein domain | 10 317 | 53 215 086 |
| OMIM phenotype | 2278 | 2 593 503 |
| Essential gene | 727 | 333 943 246 |
| Gold standards | ||
| Positive | 4606 | 20 034 |
| Negative | 4339 | 4 513 260 |
Negative gold standards are defined as gene pairs in which neither gene is expressed in the fetal ovary and in which one gene is exclusively expressed at the cell membrane and the other in the nucleus, as annotated by the Cellular Component in Gene Ontology (GO) [43]. In making this definition, we assume proteins that are physically separated are also functionally unrelated. Pairs that appear in the above five protein-protein interaction databases were further filtered out, resulting in 4 513 260 negative gold-standard pairs (Table 1).
Genomic Features
Gene expression
Temporal gene expression patterns from normal human fetal testes and ovaries between 9 and 20 wk of gestation were obtained from the literature [26]. The Pearson correlation,
 |
was first calculated between males and females for the same gene over the time course, where x and y are expression data vectors of length n for males and females, x̄ and ȳ are means, and sx and sy are standard deviations. Genes showing differential expression profiles between males and females (rxy < 0.75) were kept for further investigation of possible meiotic genes. Subsequently the Pearson correlation was calculated for pairwise genes in fetal ovaries over the time course, where x and y are expression data vectors of length n for two genes. Gene expression profiles from the mouse embryonic ovary [25] were analyzed in a similar manner to the human data by mapping orthologs via InParanoid [44]. However, since mouse gene correlations are not predictive for gold standards, they were not included in the genomic features.
Gene ontology
GO has three subontologies: Biological Process, Molecular Function, and Cellular Component [43]. For each subontology, semantic similarity was calculated for gene pairs to represent annotation similarity between genes [45].
Phylogeny
Genes that are either both present or both absent in different organisms are likely to possess similar functions. Phylogenetic profiles of genes in 34 species (including eukaryotes and prokaryotes) were obtained from the InParanoid database, and conservation was quantified by the fraction of species in which two genes were either both present or both absent.
Protein domain
Protein domains can function and evolve independently of the rest of the protein chain. One domain may appear in a variety of functionally related proteins. The probability of a protein pair sharing at least k domains was derived from the hypergeometric distribution
 |
where C(j,k) is the combinatorial factor j!/k!(j–k)!, m and n are the number of domains each protein has, and t is the total number of domains in Pfam-A families (curated protein domains) from Pfam 23.0 [46]. The –log10(p) quantifies the protein domain similarity of two proteins.
Online Mendelian Inheritance in Man phenotype
Genes showing similar disease phenotypes are frequently functionally related. Co-occurrence of diseases recorded in Online Mendelian Inheritance in Man (OMIM) [47] for a pair of genes was quantified with a hypergeometric p value as described above. The –log10(p) quantifies the phenotype similarity of two genes.
Essential genes
Essential genes may imply function in the same pathway [48]. We considered whether a pair of genes was essential based on two RNAi studies that identified human essential genes [49, 50]. Gene pairs were classified as both essential, one essential, or both nonessential.
Construction of HFOnet
A detailed description of naïve Bayesian networks is provided in the Supplemental Text S1 (all Supplemental Data are available online at www.biolreprod.org). The six genomic features described above were considered in our study. They all exhibited high degrees of overlap with the gold standards (Supplemental Fig. S1) and showed no significant correlation with each other (Supplemental Table S1). Integrating the six genomic features by a naïve Bayesian approach yields a joint likelihood ratio (LR), the quantitative measurement of functional association for gene pairs. Every gene pair in the human genome is associated with a joint LR. Any gene pairs with a joint LR greater than a threshold are predicted to be functionally associated genes. Connecting functionally associated genes forms the HFOnet.
Clique-Finding Algorithm
A clique is a subgraph in which all nodes are connected (Supplemental Text S2) [51]. A heuristic algorithm was implemented by first considering each node as a clique of size one. Smaller cliques were merged into larger ones, starting from the highest weight edge and proceeding until there were no more possible mergers. Two cliques could be merged if each node in one clique was connected to each node in another clique.
Results
A Probabilistic Functional Network for the Human Fetal Ovary
Naïve Bayesian networks have been used to identify protein-protein interactions and gene functional associations in yeast, mice, and humans, and have the advantage of combining heterogeneous information and accommodating missing data (Supplemental Text S1) [29, 32, 33, 35, 48]. We employed a naïve Bayesian approach to construct a probabilistic functional network for the human fetal ovary called HFOnet. We assembled six genomic features that are potentially useful in predicting gene functional associations, including gene expression [26], GO process [43], phylogeny [44], protein domain [46], OMIM phenotype [47], and essential genes [49, 50] (Table 1). The predictive power of each genomic feature was quantified by the individual LRs (Fig. 1). GO, protein domain, and OMIM data yielded the highest LR values. Integrating the six genomic features by naïve Bayesian approach generates a joint LR, the quantitative measurement of functional association for gene pairs (Fig. 2). Any possible combination of gene pairs in the human genome is associated with a joint LR value. Gene pairs with joint LRs greater than a threshold are connected to form the HFOnet, with the joint LR as the confidence measurement of functional associations for gene pairs.
Fig. 1.
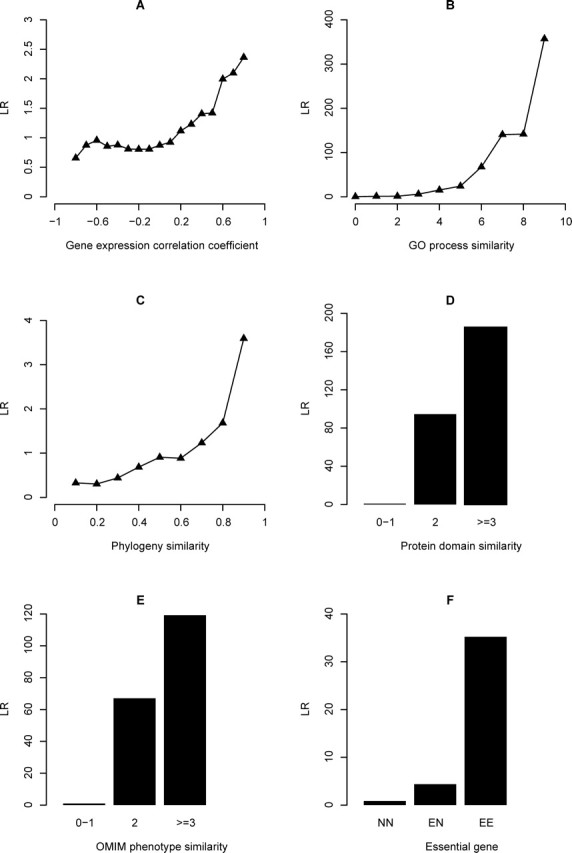
The predictive power of six genomic features for the functional association of gene pairs in the human fetal ovary. LR values represent the predictive power of each genomic feature and were calculated based on feature values of gold standards. For each genomic feature, gene pairs were grouped according to feature values. A) Gene coexpression was quantified by correlation coefficients between −1 and 1. B) GO term similarity in the subontology Biological Process was quantified by semantic similarity scores ranging from 0 to 10. C) Phylogeny similarity was the fraction of species in which two genes were either both present or both absent. D) Protein domain similarity was quantified by the –log10(p). Gene pairs were classified into three groups based on domain similarity values. E) OMIM phenotype similarity was quantified by the –log10(p). Gene pairs were classified into three groups based on phenotype similarity values. F) Gene pairs were classified into three groups: both are essential genes, one is essential, and both are nonessential.
Fig. 2.

The joint LR is the product of individual LRs according to the naïve Bayesian scheme. The joint LR represents the quantitative prediction of functional association between two genes. Individual LRs were calculated from six genomic features: gene coexpression, semantic similarity in GO Biological Process, phylogeny similarity, protein domain similarity, OMIM phenotype similarity, and essential genes. An individual LR is omitted from the joint LR calculation if a genomic feature for the gene pair is missing.
Validation of Functional Links in the HFOnet
We evaluated the functional association of gene pairs in the HFOnet using precision-coverage curves, which are the standard for determining classification performance (Fig. 3). Precision is defined as the number of positive gold standards divided by the total number of positive and negative gold standards with LR values above a threshold. A perfect precision of 1.0 means that every gold standard with the LR value above the threshold is a positive gold standard. Coverage is the number of positive gold standards with LRs above the threshold. A perfect coverage is the total number of positive gold standards, meaning that all positive gold standards have LRs above the threshold. The precision-coverage curve is obtained by using different LRs as the threshold to calculate precision and coverage values. Ideally, choosing a higher LR threshold will result in higher precision but lower coverage. Our results show Bayesian prediction exhibited consistently higher precision than individual genomic features at the same coverage, suggesting information integration can improve the prediction accuracy for the functional relationships between genes (Fig. 3). Consistent with the LR values (Fig. 1), the best individual features were protein domain, GO process, and OMIM phenotype. The predictive power of global gene expression was low, which is consistent with a previous study showing that gene expression is one to two orders of magnitude lower than other features for predicting human protein-protein interactions [35].
Fig. 3.

Performance evaluation of Bayesian integration and individual genomic features. Precision is the ratio of positive gold standards to all gold standards with LR values above a threshold, while the number of positive gold standards (coverage) is marked in the x-axis. For precision, higher numbers are better, and the ideal value is 1. For coverage, higher numbers are better, and the ideal value is 20 034, representing the total count of positive gold standards. The precision-coverage curves were obtained by taking different LRs as the threshold to calculate precision and coverage values.
We further validated the functional links in the HFOnet with GO annotation. Since the GO Biological Process was used to build the HFOnet, we used the independent subontologies of Molecular Function and Cellular Component to evaluate HFOnet predictions (Fig. 4). The Molecular Function ontology implies a molecular activity for a gene, whereas the Cellular Component suggests a subcellular location of gene products. The semantic similarity of GO terms measures annotation similarity for a pair of genes. We found that the semantic similarity of the Molecular Function and the Cellular Component increased with joint LR values, suggesting closer functional relationships for gene pairs with higher LR values. This indicates the joint LR scheme from the naïve Bayesian network is valid in predicting quantitative functional associations for gene pairs.
Fig. 4.

Evaluation of the joint LR as a quantitative predicator for gene functional associations. The semantic similarity of gene pairs was calculated as the measure of annotation similarity in GO subontologies Molecular Function and Cellular Component. Symbols represent means, and dashed lines represent standard deviations.
Network Properties of HFOnet
In the HFOnet, each node represents a gene, and each link represents the functional association between two connected genes (see Supplemental Text S2). The HFOnet can be constructed by connecting all gene pairs with a joint LR greater than a threshold value. The threshold LR can be estimated from the number of genes and gene pairs in the positive gold standards and was calculated to be 528 (see detail in Supplemental Text S1). Thus, we can draw the network by connecting gene pairs with a joint LR greater than 528. Obviously, the network can be redrawn at less or more stringent LR cutoff values to identify gene pairs with lower or higher significance.
The size of the network (the numbers of gene pairs and genes) decreases with increasing joint LR thresholds (Fig. 5A). The gene pair number declines faster than the gene number, indicating less connectivity of genes in smaller networks. The degree is the number of directly connected genes for a given gene (Supplemental Text S2). Although the majority of genes had only a small number of neighbors, a few genes were connected with a high degree (Fig. 5B). These hub genes were significantly enriched for metabolic processes, regulation of biological processes, and cell communication. They were involved in enzymatic activity, protein binding, and signal transduction activity (Table 2). These enriched GO terms suggest that the hub genes serve as the center of diverse biological pathways and are engaged in cross talk among these pathways. The clustering coefficient measures the interconnectivity around a gene (Supplemental Text S2). Most genes are highly clustered by choosing joint LR > 100 as the threshold (Fig. 5C). With the increase of LR threshold, the distribution of clustering coefficients gradually shows a bimodal trend, with both high and low clustering around genes.
Fig. 5.
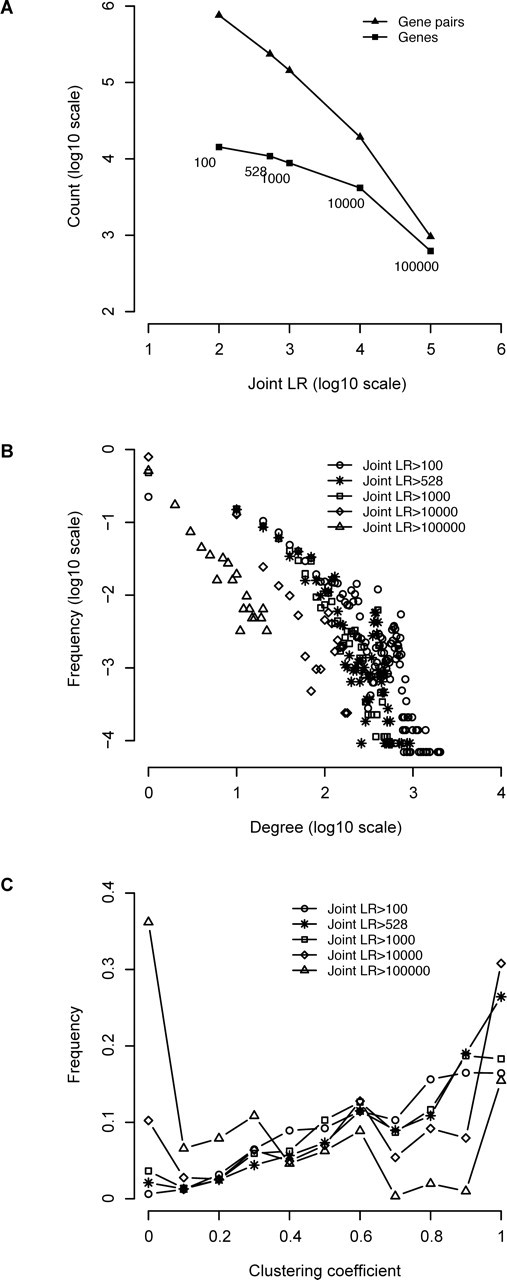
Network properties of the HFOnet by taking different joint LRs as the threshold value. A) Numbers of genes and gene pairs in the network. The joint LR value is labeled underneath the symbols. B) The degree distribution of genes in the network. The degree is the number of directly connected neighbors for a given gene. C) The clustering coefficient distribution of genes in the network. The clustering coefficient measures transitivity around a gene.
Table 2.
Significant GO SLIM terms enriched in the top 100 most connected genes in the HFOnet.a
| GO term | GO name | Hypergeometric P valueb |
|---|---|---|
| Biological process | ||
| GO:0043170 | Macromolecule metabolic process | 2.07E-18 |
| GO:0007154 | Cell communication | 5.07E-17 |
| GO:0008152 | Metabolic process | 3.11E-14 |
| GO:0050789 | Regulation of biological process | 1.22E-13 |
| GO:0009987 | Cellular process | 2.15E-13 |
| GO:0030154 | Cell differentiation | 0.00039519 |
| GO:0050896 | Response to stimulus | 0.000418585 |
| GO:0008219 | Cell death | 0.005115639 |
| Molecular function | ||
| GO:0016301 | Kinase activity | 1.24E-53 |
| GO:0016740 | Transferase activity | 3.98E-41 |
| GO:0003824 | Catalytic activity | 2.17E-17 |
| GO:0005488 | Binding | 6.56E-12 |
| GO:0005515 | Protein binding | 4.59E-09 |
| GO:0004871 | Signal transducer activity | 0.002071487 |
The top 100 most connected genes all have more than 400 directly linked neighbors, and the HFOnet was defined by joint LR > 528.
GO term significance was defined by hypergeometric P < 0.01.
HFOnet Predicts Novel Meiotic Genes
Biological pathways involved in meiotic initiation and progression in fetal oogenesis are largely unknown, although several genes have been identified as essential components of the process [1]. The HFOnet can serve as a functional map to predict novel meiotic genes through their linkages with known meiotic genes. In other words, we can use known meiotic genes as seeds to identify new genes through computationally predicted linkages between them. We can further group known and unknown meiotic genes together to discover pathway memberships.
Twenty genes known to function during meiotic initiation and prophase are listed in Table 3 along with their network properties [1, 2, 4, 14–16, 52–56]. We grouped these genes into four functional categories: meiotic initiation, homologous recombination, chromatid cohesion, and synaptonemal complex formation. Among the 20 genes, 13 are meiosis-specific and seven are nonspecific. Meiosis-specific genes function only in germ cells in meiotic processes, whereas nonspecific meiotic genes function in both somatic tissues and in germ cells (e.g., the mismatch repair protein MLH1 is associated with DNA repair in somatic cells, as well as with generation of crossover in meiocytes). One striking observation is that meiosis-specific genes either have no neighbors or are connected with only a few neighbors but are highly clustered with them. This phenomenon might be due to the tight function of these genes or to the scarcity of data on these genes. Conversely, nonspecific meiotic genes exhibit high degrees but low clustering coefficients, possibly serving as modulators of multiple pathways. An example of one such pair of “contrasting” genes involves the meiosis-specific MSH5 and nonspecific MLH3, both of which are mismatch repair proteins with similar degrees (Fig. 6) [53, 54]. MSH5 connects with five genes, and any two of the five genes are linked with each other, resulting in a clustering coefficient equal to 1. This indicates a coherent function of MSH5. In contrast, the subgraph centered at MLH3 is less densely connected. MLH3 has seven neighbors and a clustering coefficient of 0.48 because fewer neighbors connect with each other. This suggests that MLH3 is a player in multiple pathways, including meiotic recombination. Other examples of distinctly different network properties for meiosis-specific and nonspecific genes include the strand invasion proteins DMC1 (meiosis-specific) and RAD51 (nonspecific) [4] and the mismatch repair proteins MSH4 (meiosis-specific) and MLH1 (nonspecific) [2].
Table 3.
Topological properties of known meiotic genes in the HFOnet.a
| Categories | Known meiotic genesb | Degreec | Clustering coefficient |
|---|---|---|---|
| Meiotic initiation | DAZL | 42 | 0.58 |
| STRA8 | 0 | – | |
| Homologous recombination | SPO11 | 0 | – |
| RAD51 | 102 | 0.18 | |
| DMC1 | 4 | 1 | |
| MSH4 | 5 | 1 | |
| MSH5 | 5 | 1 | |
| MLH1 | 27 | 0.28 | |
| MLH3 | 7 | 0.48 | |
| Chromatid cohesion | RAD21 | 42 | 0.57 |
| SMC1A | 6 | 0.6 | |
| SMC3 | 8 | 0.54 | |
| SMC1B | 0 | – | |
| STAG3 | 0 | – | |
| REC8 | 0 | – | |
| Synaptonemal complex | SYCP3 | 4 | 0.17 |
| SYCP2 | 0 | – | |
| SYCP1 | 0 | – | |
| SYCE2 | 0 | – | |
| SYCE1 | 0 | – |
HFOnet was defined by joint LR > 528.
Meiosis-specific genes are in boldface and nonspecific genes are underlined.
The degree is the number of directly connected neighbors for a given gene.
Fig. 6.

Topological properties of meiosis-specific and nonspecific meiotic genes. MSH5 provides an example of a meiosis-specific gene with high clustering. The clustering coefficient of MSH5 is 1, because any two of its five connecting genes are linked with each other. MLH3 is an example of a nonspecific meiotic gene with low clustering. The clustering coefficient of MLH3 is 0.48, because fewer of its linked genes connect with each other. Connections are defined by joint LR > 528.
HFOnet can predict novel meiotic genes through their linkages with known meiotic genes. We listed the top neighbors of 13 known meiosis-specific genes in Table 4. These top neighbors were defined based on their joint LR values with meiosis-specific genes. We found these top neighbors include known meiosis-specific genes, nonspecific meiotic genes, and genes not known to participate in meiosis. One key observation is that the nonspecific meiotic genes, RAD51 and RAD21, exhibit connections with most of the 13 known meiosis-specific genes. This could be because RAD51 and RAD21 are essential genes and share similar functional annotations with these meiosis-specific genes. Interacting with nonspecific meiotic genes (RAD51 and RAD21) can reuse core functional modules during meiosis, such as DNA repair pathways. The promiscuousness of RAD51 and RAD21 is also represented by their high degrees (Table 3). A recent study demonstrated a biochemical interaction between the structural protein SYCE2 and the repair protein RAD51 in a Syce1 knockout mouse [55], which supports our prediction that RAD51 is a top functional neighbor of SYCE2. Another interesting observation is that the top neighbors also include known meiosis-specific structural proteins, cohesins STAG3 and REC8 [52], and synaptonemal complex components SYCP1, SYCP2, and SYCE2 [56]. These structural proteins make top connections with themselves.
Table 4.
Top neighbors of meiosis-specific genes with joint LR > 100.a
| Categories | Meiosis-specific genes | Top three neighborsb | ||
|---|---|---|---|---|
| Meiotic initiation | STRA8 | CDCA5 | PDGFB | PIM2 |
| Homologous recombination | SPO11 | RAD51 | RAD21 | ZW10 |
| DMC1 | RAD51 | RAD51L1 | RAD51C | |
| MSH4 | MSH2 | MSH5 | MSH3 | |
| MSH5 | MSH2 | MSH4 | MSH6 | |
| Chromatid cohesion | STAG3 | RAD51 | MAD2L1 | SYCP2 |
| REC8 | RAD51 | SYCE2 | ESPL1 | |
| Synaptonemal complex | SYCP3 | NASP | MYC | CCNA1 |
| SYCP2 | STAG3 | RAD21 | RAD51 | |
| SYCP1 | SYCP3 | RAD51 | CUL7 | |
| SYCE2 | SENP5 | REC8 | RAD51 | |
SMC1B and SYCE1 are not listed because they have no neighbors with joint LR > 100.
Neighbors are ranked based on joint LR values with meiosis-specific genes; meiosis-specific neighbors are in boldface and nonspecific neighbors are underlined.
We further applied a heuristic clique-finding algorithm to identify cliques formed by high-confidence links. A clique is a set of genes in which each has a connection to each of the others, providing a stringent definition for functional modules (Supplemental Text S2). Therefore, we can identify novel meiotic genes with high confidence if they are in the same clique with known meiotic genes. This is more reliable than simply mapping top neighbors of known meiotic genes. Three out of 13 meiosis-specific genes and six out of seven nonspecific meiotic genes (Table 3) were located in cliques (Fig. 7). The mouse gene Dazl has been demonstrated to be an intrinsic factor that enables germ cells to acquire meiotic competence [14]. In the HFOnet defined by LR > 528, DAZL has 42 direct neighbors with a clustering coefficient of 0.58 (Table 3). Our clique-finding algorithm identified DAZL in a clique with 13 other genes, most of which are involved in the regulation and initiation of translation (Fig. 7). DAZ1 and BOLL were found to be the top two ranked neighbors of DAZL. This result is supported by the evidence that they are all RNA-binding proteins with physical interactions with each other and may regulate the translation of key genes [57]. Interestingly, BOLL exhibits a similar gene expression profile as DAZL in the fetal ovary (Pearson correlation 0.77), although the expression level of BOLL is much lower than that of DZAL [26]. This suggests that BOLL might work together with DAZL in the fetal ovary to prepare germ cells for meiotic entry. Other components in the DAZL clique include translation initiation factors (EIF3G, EIF4B, EIF4H (WBSCR1)) and RNA binding proteins (IGF2BP1, IGF2BP2, IGF2BP3, CPEB2, RBM38, A1CF) for mRNA editing and translation regulation.
Fig. 7.

Cliques containing known meiotic genes. Meiosis-specific genes are blue, nonspecific genes are red. Cliques were derived from the HFOnet with joint LR > 528.
RAD51 and DMC1 are essential components of the meiotic homologous recombination machinery. However, RAD51 also functions in mitosis and participates in a common DNA damage response pathway, whereas DMC1 is meiosis specific [1, 4]. This is reflected by the high degree of RAD51 (102 neighbors) and low degree of DMC1 (four neighbors; Table 3). RAD51C, RAD51L1 (RAD51B), and XRCC3 are in the same clique with RAD51 and DMC1 (Fig. 7), suggesting their common role in the meiotic homologous recombination repair pathway. The formation of this clique is well supported by the evidence of physical interactions among RAD51 paralogs [58].
MSH4 and MSH5 are meiotic recombination proteins and form heterodimers [53]. Similar to MSH5 described above, MSH4 exhibits low degree and high clustering (Table 3), suggesting its coherent function in meiotic mismatch repair pathway. The clique of MSH4 and MSH5 includes MSH3, a component of mismatch repair system, and ANKRD17, the ankyrin repeat domain-containing protein 17 (Fig. 7). The only known function of ANKRD17 is its interactions with the capsid proteins of enterovirus 71 [59]. ANKRD17 is expressed in the fetal ovary and testis, with a weak Pearson correlation of 0.41 [26]. Linkages with MSH4 and MSH5 as predicted from our study indicate that ANKRD17 might participate in meiotic mismatch repair response.
Another mismatch repair clique consists of MSH6, MSH2, MLH1, and PMS2 (Fig. 7). They are components of the general mismatch repair system [2] and could participate in meiotic recombination. The last mismatch repair clique is MLH3-SMCHD1. The connection between MLH3 and SMCHD1 has not been previously documented, although it is known that MLH3 functions to promote crossover recombination [54], and SMCHD1 encodes for the structural maintenance of chromosome flexible hinge domain-containing protein 1 [60]. An SMC protein clique contains SMC1A–SMC3, central components of the cohesin complex, and SMC2–SMC4, the condensing complex member [52] (Fig. 7). They all belong to a family of chromosomal ATPases and exhibit a similar structure.
Discussion
Meiosis initiates in the human fetal ovary at ∼11–12 wk [3]. Primary oocytes pass through the leptotene, zygotene, and pachytene stages before being arrested at the dictyate stage of meiotic prophase [1]. Although a few pivotal genes have been identified and characterized for female meiosis [1, 2, 14–24], little is known in regard to the genetic pathways and networks that govern this critical developmental process. Clearly, this is because the human fetal ovaries are not an experimentally tractable system. The establishment of a functional network is invaluable in extending our understanding of meiosis initiation and progression in the human fetal ovary and in identifying novel genes and interactions involved in these processes. With the recent availability of global gene expression profiles of human fetuses [26] and other genome-scale data, we were able to construct a tissue-specific and stage-specific functional network to probe meiotic pathways, which are difficult to tackle by traditional in vivo mammalian genetics.
In this study, we applied a naïve Bayesian approach to build a functional network for the human fetal ovary called HFOnet. Our results show that the probabilistic integration of heterogeneous data types can generate confident measures for gene connections and can improve prediction accuracy. We also characterized the network properties of HFOnet and identified that most genes exhibit low degree, but a small number of genes are highly connected as hubs. Our findings suggest that known meiosis-specific genes make few connections and that these connections are frequently with both meiosis-specific and nonspecific meiotic genes. Known nonspecific meiotic genes, on the other hand, tend to make numerous interactions and exhibit low clustering, indicating that they are multi-taskers. By using a clique-finding algorithm, we grouped genes into functional modules, confirmed known connections among genes, and, more importantly, predicted novel genes that might participate in meiotic initiation and DNA repair. We used 20 representative, known meiotic genes as seed genes to identify new candidate genes through computationally predicted linkages. Certainly, the 20 genes are not a complete list of all known meiotic genes. Indeed, we can use other known meiotic genes to query the HFOnet for obtaining their neighbors as candidate meiotic genes.
In summary, we have constructed a tissue- and developmental-stage-specific functional network for the human fetal ovary. This provides a unique opportunity for investigating novel genes involved in the meiotic prophase and directing targeted experiments. With the increase in the quality and quantity of tissue-specific genomic data for mammals, we anticipate that our predictive model will grow in size and accuracy, and will become an invaluable resource for reproductive biologists.
Supplementary Material
Acknowledgment
The authors would like to acknowledge Lizhong Yang for providing the time-series expression profiles for the human fetal ovary and testis and for the mouse embryonic ovary and testis.
References
- 1. Bowles J, Koopman P. Retinoic acid, meiosis and germ cell fate in mammals. Development 2007; 134:3401–3411. [DOI] [PubMed] [Google Scholar]
- 2. Hunt PA, Hassold TJ. Human female meiosis: what makes a good egg go bad? Trends Genet 2008; 24:86–93. [DOI] [PubMed] [Google Scholar]
- 3. Gondos B, Westergaard L, Byskov AG. Initiation of oogenesis in the human fetal ovary: ultrastructural and squash preparation study. Am J Obstet Gynecol 1986; 155:189–195. [DOI] [PubMed] [Google Scholar]
- 4. Hassold T, Hall H, Hunt P. The origin of human aneuploidy: where we have been, where we are going. Hum Mol Genet 2007; 16(spec no. 2):R203–R208. [DOI] [PubMed] [Google Scholar]
- 5. Barlow AL, Hulten MA. Sequential immunocytogenetics, molecular cytogenetics and transmission electron microscopy of microspread meiosis I oocytes from a human fetal carrier of an unbalanced translocation. Chromosoma 1997; 106:293–303. [DOI] [PubMed] [Google Scholar]
- 6. Robles P, Roig I, Garcia R, Brieno M, Martin M, Barbero JL, Cabero LI, Garcia-Caldes M. Analysis of recombination along chromosome 21 during human female pachytene stage. Reprod BioMed Online 2009; 18:784–794. [DOI] [PubMed] [Google Scholar]
- 7. Robles P, Roig I, Garcia R, Ortega A, Egozcue J, Cabero LL, Garcia M. Pairing and synapsis in oocytes from female fetuses with euploid and aneuploid chromosome complements. Reproduction 2007; 133:899–907. [DOI] [PubMed] [Google Scholar]
- 8. Roig I, Robles P, Garcia R, Martin M, Egozcue J, Cabero L, Barambio S, Garcia M. Evolution of the meiotic prophase and of the chromosome pairing process during human fetal ovarian development. Hum Reprod 2005; 20:2463–2469. [DOI] [PubMed] [Google Scholar]
- 9. Roig I, Robles P, Garcia R, Martinez-Flores I, Cabero L, Egozcue J, Liebe B, Scherthan H, Garcia M. Chromosome 18 pairing behavior in human trisomic oocytes. Presence of an extra chromosome extends bouquet stage. Reproduction 2005; 129:565–575. [DOI] [PubMed] [Google Scholar]
- 10. Tease C, Hartshorne G, Hulten M. Altered patterns of meiotic recombination in human fetal oocytes with asynapsis and/or synaptonemal complex fragmentation at pachytene. Reprod BioMed Online 2006; 13:88–95. [DOI] [PubMed] [Google Scholar]
- 11. Tease C, Hartshorne GM, Hulten MA. Patterns of meiotic recombination in human fetal oocytes. Am J Hum Genet 2002; 70:1469–1479. [DOI] [PMC free article] [PubMed] [Google Scholar]
- 12. Hartshorne GM, Barlow AL, Child TJ, Barlow DH, Hulten MA. Immunocytogenetic detection of normal and abnormal oocytes in human fetal ovarian tissue in culture. Hum Reprod 1999; 14:172–182. [DOI] [PubMed] [Google Scholar]
- 13. Roig I, Garcia R, Robles P, Cortvrindt R, Egozcue J, Smitz J, Garcia M. Human fetal ovarian culture permits meiotic progression and chromosome pairing process. Hum Reprod 2006; 21:1359–1367. [DOI] [PubMed] [Google Scholar]
- 14. Lin Y, Gill ME, Koubova J, Page DC. Germ cell-intrinsic and -extrinsic factors govern meiotic initiation in mouse embryos. Science 2008; 322:1685–1687. [DOI] [PubMed] [Google Scholar]
- 15. Bowles J, Knight D, Smith C, Wilhelm D, Richman J, Mamiya S, Yashiro K, Chawengsaksophak K, Wilson MJ, Rossant J, Hamada H, Koopman P. Retinoid signaling determines germ cell fate in mice. Science 2006; 312:596–600. [DOI] [PubMed] [Google Scholar]
- 16. Koubova J, Menke DB, Zhou Q, Capel B, Griswold MD, Page DC. Retinoic acid regulates sex-specific timing of meiotic initiation in mice. Proc Natl Acad Sci U S A 2006; 103:2474–2479. [DOI] [PMC free article] [PubMed] [Google Scholar]
- 17. Ward JO, Reinholdt LG, Motley WW, Niswander LM, Deacon DC, Griffin LB, Langlais KK, Backus VL, Schimenti KJ, O'Brien MJ, Eppig JJ, Schimenti JC. Mutation in mouse hei10, an e3 ubiquitin ligase, disrupts meiotic crossing over. PLoS Genet 2007; 3:e139. [DOI] [PMC free article] [PubMed] [Google Scholar]
- 18. Ward JO, Reinholdt LG, Hartford SA, Wilson LA, Munroe RJ, Schimenti KJ, Libby BJ, O'Brien M, Pendola JK, Eppig J, Schimenti JC. Toward the genetics of mammalian reproduction: induction and mapping of gametogenesis mutants in mice. Biol Reprod 2003; 69:1615–1625. [DOI] [PubMed] [Google Scholar]
- 19. Libby BJ, Reinholdt LG, Schimenti JC. Positional cloning and characterization of Mei1, a vertebrate-specific gene required for normal meiotic chromosome synapsis in mice. Proc Natl Acad Sci U S A 2003; 100:15706–15711. [DOI] [PMC free article] [PubMed] [Google Scholar]
- 20. Anderson RA, Fulton N, Cowan G, Coutts S, Saunders PT. Conserved and divergent patterns of expression of DAZL, VASA and OCT4 in the germ cells of the human fetal ovary and testis. BMC Dev Biol 2007; 7:136. [DOI] [PMC free article] [PubMed] [Google Scholar]
- 21. Garcia-Cruz R, Roig I, Robles P, Scherthan H, Garcia Caldes M. ATR, BRCA1 and gammaH2AX localize to unsynapsed chromosomes at the pachytene stage in human oocytes. Reprod BioMed Online 2009; 18:37–44. [DOI] [PubMed] [Google Scholar]
- 22. Lenzi ML, Smith J, Snowden T, Kim M, Fishel R, Poulos BK, Cohen PE. Extreme heterogeneity in the molecular events leading to the establishment of chiasmata during meiosis I in human oocytes. Am J Hum Genet 2005; 76:112–127. [DOI] [PMC free article] [PubMed] [Google Scholar]
- 23. Prieto I, Tease C, Pezzi N, Buesa JM, Ortega S, Kremer L, Martinez A, Martinez AC, Hulten MA, Barbero JL. Cohesin component dynamics during meiotic prophase I in mammalian oocytes. Chromosome Res 2004; 12:197–213. [DOI] [PubMed] [Google Scholar]
- 24. Roig I, Liebe B, Egozcue J, Cabero L, Garcia M, Scherthan H. Female-specific features of recombinational double-stranded DNA repair in relation to synapsis and telomere dynamics in human oocytes. Chromosoma 2004; 113:22–33. [DOI] [PubMed] [Google Scholar]
- 25. Small CL, Shima JE, Uzumcu M, Skinner MK, Griswold MD. Profiling gene expression during the differentiation and development of the murine embryonic gonad. Biol Reprod 2005; 72:492–501. [DOI] [PMC free article] [PubMed] [Google Scholar]
- 26. Houmard B, Small C, Yang L, Naluai-Cecchini T, Cheng E, Hassold T, Griswold M. Global gene expression in the human fetal testis and ovary. Biol Reprod 2009; 81:438–443. [DOI] [PMC free article] [PubMed] [Google Scholar]
- 27. Aerts S, Lambrechts D, Maity S, Van Loo P, Coessens B, De Smet F, Tranchevent LC, De Moor B, Marynen P, Hassan B, Carmeliet P, Moreau Y. Gene prioritization through genomic data fusion. Nat Biotechnol 2006; 24:537–544. [DOI] [PubMed] [Google Scholar]
- 28. Myers CL, Robson D, Wible A, Hibbs MA, Chiriac C, Theesfeld CL, Dolinski K, Troyanskaya OG. Discovery of biological networks from diverse functional genomic data. Genome Biol 2005; 6:R114. [DOI] [PMC free article] [PubMed] [Google Scholar]
- 29. Pan X, Ye P, Yuan DS, Wang X, Bader JS, Boeke JD. A DNA integrity network in the yeast Saccharomyces cerevisiae. Cell 2006; 124:1069–1081. [DOI] [PubMed] [Google Scholar]
- 30. Tanay A, Steinfeld I, Kupiec M, Shamir R. Integrative analysis of genome-wide experiments in the context of a large high-throughput data compendium. Mol Syst Biol 2005; 1:0002. [DOI] [PMC free article] [PubMed] [Google Scholar]
- 31. Ye P, Peyser BD, Pan X, Boeke JD, Spencer FA, Bader JS. Gene function prediction from congruent synthetic lethal interactions in yeast. Mol Syst Biol 2005; 1:0026. [DOI] [PMC free article] [PubMed] [Google Scholar]
- 32. Lu LJ, Xia Y, Paccanaro A, Yu H, Gerstein M. Assessing the limits of genomic data integration for predicting protein networks. Genome Res 2005; 15:945–953. [DOI] [PMC free article] [PubMed] [Google Scholar]
- 33. Guan Y, Myers CL, Lu R, Lemischka IR, Bult CJ, Troyanskaya OG. A genomewide functional network for the laboratory mouse. PLoS Comput Biol 2008; 4:e1000165. [DOI] [PMC free article] [PubMed] [Google Scholar]
- 34. Pena-Castillo L, Tasan M, Myers CL, Lee H, Joshi T, Zhang C, Guan Y, Leone M, Pagnani A, Kim WK, Krumpelman C, Tian W et al. A critical assessment of Mus musculus gene function prediction using integrated genomic evidence. Genome Biol 2008; 9(suppl 1):S2. [DOI] [PMC free article] [PubMed] [Google Scholar]
- 35. Rhodes DR, Tomlins SA, Varambally S, Mahavisno V, Barrette T, Kalyana-Sundaram S, Ghosh D, Pandey A, Chinnaiyan AM. Probabilistic model of the human protein-protein interaction network. Nat Biotechnol 2005; 23:951–959. [DOI] [PubMed] [Google Scholar]
- 36. Keshava Prasad TS, Goel R, Kandasamy K, Keerthikumar S, Kumar S, Mathivanan S, Telikicherla D, Raju R, Shafreen B, Venugopal A, Balakrishnan L, Marimuthu A et al. Human Protein Reference Database: 2009 update. Nucleic Acids Res 2009; 37:D767–D772. [DOI] [PMC free article] [PubMed] [Google Scholar]
- 37. Salwinski L, Miller CS, Smith AJ, Pettit FK, Bowie JU, Eisenberg D. The Database of Interacting Proteins: 2004 update. Nucleic Acids Res 2004; 32:D449–D451. [DOI] [PMC free article] [PubMed] [Google Scholar]
- 38. Chatr-aryamontri A, Ceol A, Palazzi LM, Nardelli G, Schneider MV, Castagnoli L, Cesareni G. MINT: the Molecular INTeraction database. Nucleic Acids Res 2007; 35:D572–D574. [DOI] [PMC free article] [PubMed] [Google Scholar]
- 39. Kerrien S, Alam-Faruque Y, Aranda B, Bancarz I, Bridge A, Derow C, Dimmer E, Feuermann M, Friedrichsen A, Huntley R, Kohler C, Khadake J et al. IntAct—open source resource for molecular interaction data. Nucleic Acids Res 2007; 35:D561–D565. [DOI] [PMC free article] [PubMed] [Google Scholar]
- 40. Stark C, Breitkreutz BJ, Reguly T, Boucher L, Breitkreutz A, Tyers M. BioGRID: a general repository for interaction datasets. Nucleic Acids Res 2006; 34:D535–D539. [DOI] [PMC free article] [PubMed] [Google Scholar]
- 41. Su AI, Wiltshire T, Batalov S, Lapp H, Ching KA, Block D, Zhang J, Soden R, Hayakawa M, Kreiman G, Cooke MP, Walker JR, Hogenesch JB. A gene atlas of the mouse and human protein-encoding transcriptomes. Proc Natl Acad Sci U S A 2004; 101:6062–6067. [DOI] [PMC free article] [PubMed] [Google Scholar]
- 42. Hubbard TJ, Aken BL, Ayling S, Ballester B, Beal K, Bragin E, Brent S, Chen Y, Clapham P, Clarke L, Coates G, Fairley S et al. Ensembl 2009. Nucleic Acids Res 2009; 37:D690–D697. [DOI] [PMC free article] [PubMed] [Google Scholar]
- 43. Ashburner M, Ball CA, Blake JA, Botstein D, Butler H, Cherry JM, Davis AP, Dolinski K, Dwight SS, Eppig JT, Harris MA, Hill DP et al. Gene ontology: tool for the unification of biology. Nat Genet 2000; 25:25–29. [DOI] [PMC free article] [PubMed] [Google Scholar]
- 44. Berglund AC, Sjolund E, Ostlund G, Sonnhammer EL. InParanoid 6: eukaryotic ortholog clusters with inparalogs. Nucleic Acids Res 2008; 36:D263–D266. [DOI] [PMC free article] [PubMed] [Google Scholar]
- 45. Lord PW, Stevens RD, Brass A, Goble CA. Investigating semantic similarity measures across the Gene Ontology: the relationship between sequence and annotation. Bioinformatics 2003; 19:1275–1283. [DOI] [PubMed] [Google Scholar]
- 46. Finn RD, Tate J, Mistry J, Coggill PC, Sammut SJ, Hotz HR, Ceric G, Forslund K, Eddy SR, Sonnhammer EL, Bateman A. The Pfam protein families database. Nucleic Acids Res 2008; 36:D281–D288. [DOI] [PMC free article] [PubMed] [Google Scholar]
- 47. Online Mendelian Inheritance in Man [OMIM]. McKusick-Nathans Institute of Genetic Medicine, Johns Hopkins University, Baltimore, MD, and National Center for Biotechnology Information,National Library of Medicine, Bethesda, MD.1985. World Wide Web (URL: http://www.ncbi.nlm.nih.gov/omim/). (November 10, 2008). [Google Scholar]
- 48. Jansen R, Yu H, Greenbaum D, Kluger Y, Krogan NJ, Chung S, Emili A, Snyder M, Greenblatt JF, Gerstein M. A Bayesian networks approach for predicting protein-protein interactions from genomic data. Science 2003; 302:449–453. [DOI] [PubMed] [Google Scholar]
- 49. Schlabach MR, Luo J, Solimini NL, Hu G, Xu Q, Li MZ, Zhao Z, Smogorzewska A, Sowa ME, Ang XL, Westbrook TF, Liang AC et al. Cancer proliferation gene discovery through functional genomics. Science 2008; 319:620–624. [DOI] [PMC free article] [PubMed] [Google Scholar]
- 50. Silva JM, Marran K, Parker JS, Silva J, Golding M, Schlabach MR, Elledge SJ, Hannon GJ, Chang K. Profiling essential genes in human mammary cells by multiplex RNAi screening. Science 2008; 319:617–620. [DOI] [PMC free article] [PubMed] [Google Scholar]
- 51. Bron C, Kerboscht J. Finding all cliques of an undirected graph. Comm ACM 1973; 16:575–579. [Google Scholar]
- 52. Hirano T. The ABCs of SMC proteins: two-armed ATPases for chromosome condensation, cohesion, and repair. Genes Dev 2002; 16:399–414. [DOI] [PubMed] [Google Scholar]
- 53. Richardson C, Horikoshi N, Pandita TK. The role of the DNA double-strand break response network in meiosis. DNA Repair 2004; 3:1149–1164. [DOI] [PubMed] [Google Scholar]
- 54. Svetlanov A, Baudat F, Cohen PE, de Massy B. Distinct functions of MLH3 at recombination hot spots in the mouse. Genetics 2008; 178:1937–1945. [DOI] [PMC free article] [PubMed] [Google Scholar]
- 55. Bolcun-Filas E, Speed R, Taggart M, Grey C, de Massy B, Benavente R, Cooke HJ. Mutation of the mouse Syce1 gene disrupts synapsis and suggests a link between synaptonemal complex structural components and DNA repair. PLoS Genet 2009; 5:e1000393. [DOI] [PMC free article] [PubMed] [Google Scholar]
- 56. Burgoyne PS, Mahadevaiah SK, Turner JM. The consequences of asynapsis for mammalian meiosis. Nat Rev Genet 2009; 10:207–216. [DOI] [PubMed] [Google Scholar]
- 57. Anderson EL, Baltus AE, Roepers-Gajadien HL, Hassold TJ, de Rooij DG, van Pelt AM, Page DC. Stra8 and its inducer, retinoic acid, regulate meiotic initiation in both spermatogenesis and oogenesis in mice. Proc Natl Acad Sci U S A 2008; 105:14976–14980. [DOI] [PMC free article] [PubMed] [Google Scholar]
- 58. Liu N, Schild D, Thelen MP, Thompson LH. Involvement of Rad51C in two distinct protein complexes of Rad51 paralogs in human cells. Nucleic Acids Res 2002; 30:1009–1015. [DOI] [PMC free article] [PubMed] [Google Scholar]
- 59. Yeo WM, Chow VT. The VP1 structural protein of enterovirus 71 interacts with human ornithine decarboxylase and gene trap ankyrin repeat. Microb Pathog 2007; 42:129–137. [DOI] [PubMed] [Google Scholar]
- 60. Boutet E, Lieberherr D, Tognolli M, Schneider M, Bairoch A. UniProtKB/Swiss-Prot. Methods Mol Biol 2007; 406:89–112. [DOI] [PubMed] [Google Scholar]
Associated Data
This section collects any data citations, data availability statements, or supplementary materials included in this article.