

Abstract
Body composition is known to be associated with several diseases, such as cardiovascular disease, diabetes, cancers, osteoporosis and osteoarthritis. Body composition measurements are useful in assessing the effectiveness of nutritional interventions and monitoring the changes associated with growth and disease conditions. Changes in body composition occur when there is a mismatch between nutrient intake and requirement. Altered body composition is observed in conditions such as wasting and stunting when the nutritional intake may be inadequate. Overnutrition on the other hand leads to obesity. Many techniques are available for body composition assessment, which range from simple indirect measures to more sophisticated direct volumetric measurements. Some of the methods that are used today include anthropometry, tracer dilution, densitometry, dual-energy X-ray absorptiometry, air displacement plethysmography and bioelectrical impedance analysis. The methods vary in their precision and accuracy. Imaging techniques such as nuclear magnetic resonance imaging and computed tomography have become powerful tools due to their ability of visualizing and quantifying tissues, organs, or constituents such as muscle and adipose tissue. However, these methods are still considered to be research tools due to their cost and complexity of use. This review was aimed to describe the commonly used methods for body composition analysis and provide a brief introduction on the latest techniques available.
Keywords: Adiposity, anthropometry, body composition, DEXA, hydrodensitometry, hydrometry, models, muscle mass
Introduction
Human body composition measurements are objective methods of nutritional assessment and are of interest to nutritionists, health professionals and sports scientists. With the increasing prevalence of obesity and lifestyle diseases, there is increased need for body composition methods with greater sensitivity and precision. The assessment of body composition provides insights into both nutritional status and functional capacity of the human body and is useful in nutrition for describing growth and development from birth through to adulthood and for understanding the developmental origins of health and disease, in designing nutritional strategies, and in monitoring of therapeutic interventions1,2. Independent of body fat, which is an indicator of long-term energy storage, skeletal muscles are of great significance, and to understand the metabolic balance between muscle and the fat compartments, body composition needs to be measured. In cancer, there is involuntary loss of body weight (>5% over six months), accompanied often with muscle wasting leading to a condition defined as cachexia3. Sarcopenia, the age-related reduced physical performance, following loss of muscle mass, is usually accompanied by increased fat infiltration of the muscles4 and is diagnosed using muscle strength tests along with measurements of muscle volume5. The increasing prevalence of obesity in elderly accompanied with sarcopaenia (sarcopaenic obesity) acts concurrently to augment disability, morbidity, and mortality. Sarcopaenic obesity is related to increased functional decline, high risk of diseases and mortality. Accurate measurement of muscle mass and strength is important to identify individuals at risk and plan appropriate interventions. Different methods have been developed to determine the body composition with different physical principles, using different models and assumptions. Tomographic imaging techniques such as computed tomography (CT) and magnetic resonance imaging (MRI) are available which involve in vivo measurements of different fat depots and fat infiltration in organs and are considered to be the gold standard for body composition analysis5,6. Each of the methods has advantages, and disadvantages.
The various methods available for assessing body composition are based on two-compartment (2C), three-compartment (3C), four-compartment (4C) or multi-compartment models7.
Models of body composition
Two-compartment (2C) model
The simplest approach in body composition is the 2C model, dividing body weight into fat mass (FM) and fat-free mass (FFM). The anhydrous FM is the chemically extractable fat with an assumed density of 0.9007 g/cm3, whereas the FFM is assumed to have a density of 1.1000 g/cm3 and water content of 73.72 per cent7. The 2C model is based on assumption made from the analyses of three male cadavers8 and the associated errors are more due to the validity of the assumptions rather than the technical accuracy of the measurements. Hydrodensitometry, air displacement plethysmography (ADP) and hydrometry are some of the commonly used methods based on 2C model.
Three-compartment (3C) model
The 3C model of body composition includes a third component where the FFM is further divided into lean tissue mass (LTM) and bone mineral content (BMC). In the 3C model, the FFM is divided into water [total body water (TBW)] and the remaining solids [protein and minerals, fat-free dry mass (FFDM)]. This includes measurements of body density (Db) and TBW, while assuming a constant mineral-to-protein ratio of 0.359. The 3C model, thus, controls for inter-individual variation in FFM hydration. While measuring body composition of healthy adults and older children, the 3C model has shown better results over the 2C model but has to be used with caution in patients with depleted body protein or bone mineral mass, as the estimated values for density, and thus, the final estimate of body FM will not be accurate7. The dual-energy X-ray absorptiometry (DEXA) is a 3C method that provides rapid, non-invasive regional as well as whole-body composition measurement by the transmission of high- and low-energy X-rays through the body.
Four-compartment (4C) model
The 4C model of body composition is obtained by combining many methods to partition body mass into fat, mineral, TBM and protein (residual) and thus, removes the need to make assumptions about the relative proportion of these constituents in the body. Since the 4C model controls for biological variability in both bone mineral and TBW, it is theoretically more valid than the 3C model. Assumptions of 1.34 and 3.075 kg/l7 are made for the density of protein and mineral. The 4C model is considered to be the criterion method of body composition10 measuring the individual constituents of FFM, rather than assuming a constant density of 1.100 g/cm3 and hydration of 0.73. However, each primary measurement will have an inherent measurement error and the cumulative errors associated with measuring many variables could affect the improved accuracy of the 4C model. The propagation of error method11 is used to calculate estimates of the precision of FM from the 4C model, since each primary method precision is propagated into the final 4C model estimate. A precision of ±0.25 kg was obtained from the propagation of error method for FM using the 4C model for a 60 kg individual with 60 per cent TBW12. The 4C method is, however, often limited in clinical settings and large studies, in view of the time, cost and equipment needed for the multiple measurements, and should be used mainly for the validation of body composition methods and for deriving predictive equations.
Multicompartment models
Atomic models of body composition require the direct analysis of the major elements of the body. Neutron activation analysis (NAA) can be used to measure the total body content of elements (calcium, sodium, chloride, phosphorus, nitrogen, hydrogen, oxygen and carbon). The 6C model divides the body into water, nitrogen, calcium, potassium, sodium and chloride13. Although the multicompartment models provide accurate measures of body composition, for validating other methods, the lack of appropriate facilities, the high expense and the exposure to radiation limit their regular use. The different models of body composition are depicted in the Figure.
Figure.
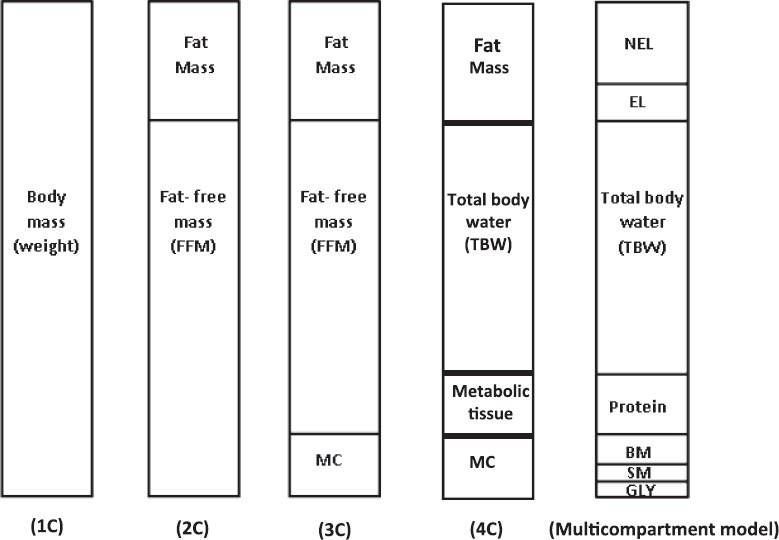
Different types of body composition models. 1C, one-compartment; 2C, two-compartment; 3C, three-compartment; 4C, four-compartment; MC, mineral content; NEL, non-essential lipid; EL, essential lipid; BM, bone mineral; SM, soft-tissue mineral; GLY, glycogen.
Methods of body composition
Field methods
Anthropometry: Anthropometric measurements are non-invasive and help in assessing the nutritional status, identifying individuals at risk, monitoring the efficacy of a nutrition intervention and providing information about the body's stores of fat and muscle. Since these are relatively simple to measure, inexpensive and do not require high level of technical skill, anthropometric measurements are used widely in clinical situations and large epidemiological studies.
The body mass index (BMI) is widely used to estimate body fat as it is simple and inexpensive. The WHO classification is commonly used to categorize BMI14. The percentage body fat (%BF) for a given BMI changes with age, and the rate of this change varies depending on sex, ethnicity and individual differences15. In addition, BMI is not sensitive to the actual distribution of body fat and metabolic risk16,17,18. Indians, both within and outside Asia, are more adipose for a given BMI than other ethnic groups19,20. This is important since total body fat and the location of body fat are strongly associated with insulin sensitivity in Indians. Due to the evidence of the increased adiposity in Indians, it was suggested that the BMI cut-off should be reduced to 23 kg/m2 for non-communicable diseases21. The WHO Expert Committee however, set a BMI of 23 kg/m2 as public health action point22 rather than a cut-off. Recently, the Indian Consensus Group established guidelines and classified a BMI of ≥23kg/m2 and ≥25kg/m2 as overweight and obese, for Asian Indians residing in India23.
Waist circumference: Waist circumference is used in children and adults as an indicator of intra-abdominal fat. Waist circumference is measured with a non-stretchable tape to the nearest 0.1 cm, in a standing position during end-tidal expiration at the midpoint of the lowest rib cage and the iliac crest24. The indicators of risk based on waist circumference are given ≥102 cm in men and ≥88 cm in women14.
Several waist circumference cut-off points have been evaluated in relation to BMI cut-off points and cardiovascular diseases in individuals residing in north India and the proposed action level for adult Asian Indians was set as: action level 1: men, ≥78 cm, women, ≥72 cm; and action level 2: men, ≥90 cm, women, ≥80 cm25.
Waist-hip ratio: The waist-hip ratio (WHR) is used as a surrogate measure of lower and upper body fat distribution and measures where the body fat is stored. Android or excess upper body fat is seen more typically in men, while gynoid or excess lower body fat is seen more in women. A high WHR suggests increased risk of obesity-related health problems. The accuracy of WHR in assessing visceral fat decreases with increasing levels of fatness. WHR is calculated by dividing the waist circumference by the hip circumference and the indicators of risk are ≥1.0 for men and ≥0.85 for women14.
Skinfold (SKF) measurements: The skinfold (SKF) technique is a measure of subcutaneous fat, by estimating Db to derive per cent BF. The commonly used callipers are Holtain, Lange and Harpenden, which measure to the nearest 0.2 mm. Measurements are made at sites such as biceps, triceps, subscapular and suprailiac, which are used in age- and gender-specific equations, to arrive at values of body density26. Body fat is obtained from Db using a population specific conversion formula27.
The estimates of per cent BF and FFM from skinfold method were found to be accurate in Indian adults when hydrodensitometry (HD) was used as reference28. However, when body FM estimates from SKF techniques were compared with the 4C method, the mean error was found to be 6.6 kg in a group of south Indian adults12. The possible sources of error in this method are technician skill, type of callipers and the prediction equation used. This technique should be used with caution in older individuals and obese individuals.
Bioelectrical impedance analysis (BIA): Bioelectrical impedance analysis technique is used to predict body composition based, on the electrical conductive properties of the body29 and involves measuring the impedance (Z) to the flow of a low-electrical current (800 μA), at a fixed frequency (50 kHz). The BIA device can be single frequency, when it operates at a frequency of 50 kHz or multifrequency, when a wide range of frequencies are used. The principle of BIA is that Lean Tissue (LT), consisting of water and electrolytes, is a good electrical conductor, while fat, which does not have water, is a poor conductor. Hydration factor of 73 per cent is used to predict FFM from TBW. The possible sources of error in BIA are differences in limb length, physical activity, nutrition status, hydration level, blood chemistry, ovulation and placement of electrodes30.
Fluid shifts and hydration levels in the body can be assessed using bioimpedance spectroscopy (BIS) or multifrequency BIA which can differentiate TBW into intracellular water (ICW) and extracellular water (ECW) compartments31. BIS can also provide estimates of body cell mass (BCM) by differentiating between ECW and ICF spaces, which were shown to correlate well with estimates from 4C model31. The estimates of FFM from BIS were underestimated in individuals with normal weight and overestimated in obese individuals when compared with DEXA31.
With optimal standardization of methods, instruments and preparation of the individuals, the BIA can provide quick, easy and relatively inexpensive estimates of FFM and TBW in healthy populations and in obese individuals. The BIA instrument is portable, safe, easy to use, relatively low cost with minimal participant burden, thus making it a useful tool for large studies. In south Indian adults, the BIA underestimated %BF by 5.5 per cent when compared to the 4C method12, while it was found to underestimate body fat at lower ranges and overestimate at higher ranges when compared to estimates from deuterium dilution32. Thus, estimates of body fat obtained from the BIA machine should be used with caution. Age- and gender-based equations for Indian populations are needed.
Laboratory methods
Hydrodensitometry [underwater weighing (UWW)]
Hydrodensitometry [underwater weighing (UWW)], or densitometry involves the estimation of Db. The method measures the water displaced by the body, when it is fully submerged and in combination with residual lung volume measurements can provide accurate measure of body volume (BV), from which Db can be estimated. An individual with a higher percentage of FFM will weigh more in water and have a low %BF, since bone and muscle are denser than water, while fat will float. A large amount of FM will make the body lighter in the water and that individual will have a high %BF. The underwater weight of the individual is used to calculate the weight loss. The total %BF can be estimated by assuming a 2C model with varying densities for FM and FFM after accounting for the air volume in the lungs. Estimates of %BF from Db can be obtained using the 2C model. To arrive at an accurate estimate of Db using UWW, the BV should be corrected for the amount of air present in the lungs and gastrointestinal tract at the time of measurement. Residual lung volume is the amount of air remaining in the lungs after a maximal expiration. The UWW method is a valid method for measuring BV and Db and the estimates of %BF from UWW had average errors ranging from −2.8 to 1.8 %BF33 when compared to 4C method. The UWW technique though accurate has disadvantages such as being time-consuming and causing discomfort to the individual.
Air displacement plethysmography (ADP)
The ADP which is similar in principle to UWW measures the Db and hence total body fat and LT. ADP uses the association between pressure and volume to derive BV for an individual seated inside the chamber. BV is estimated as the volume of air in an empty chamber minus the volume of air in the chamber after the person sat in it. The individual is seated in an enclosed chamber, and by altering the volume of the chamber, the volume of the displaced air can be determined from the air pressure change34. The measurement time is about 5-8 min/individual.
The commercial BOD POD instrument (COSMED, Italy), though easy to use, is expensive and only a few facilities have the machine. Both small (≤0.002 g/cc)34 and slightly higher differences (0.003-0.007 g/cc)35,36 in Db have been reported when measured by the BOD POD and UWW. The accuracy of the BOD POD and UWW was found to be similar34,36 when evaluated against 4C methods. When the 4C model was used to validate the BOD POD in south Indian Adults, it was observed that there was underestimation of body FM by about 1.1 per cent12. This suggests that for the Indian population, who seem to be more adipose for a given BMI, the ADP method can accurately estimate the body fat within five per cent of the reference measurement12.
Isotope dilution method (hydrometry)
Hydrometry is based on the dilution principle, where the amount of TBW (solvent) can be estimated if the concentration and amount of the tracer (isotope) are known37. The TBW comprises 40-60 per cent of the human body weight and mainly present in the FFM. Estimates of FFM can be obtained from TBW.
The stable isotopes commonly used are D2O and 18O. Body fluid samples of either saliva, urine or blood are collected first to determine the natural background levels before administration of the dose, and the second, to provide a measure of the concentration of the tracer, taken after 3-4 h, which is sufficient amount of time for the tracer to equilibrate with all water spaces. The enrichment of the isotope can be measured from either isotope ratio mass spectrometry or infrared spectrophotometry. This method has precision and accuracy of 1-2 per cent for measuring TBW38. The hydration factor is assumed to be 73 per cent and the FFM is estimated from TBW using this assumption. Since the percentage of water in the FFM was found to be between 70 and 76 per cent in most species39, it would be ideal to use population-specific hydration factor of FFM. In south Indian adults, the hydration factor of FFM was found to be 0.7112. The estimates of %BF from the TBW method showed small differences (<1% BF) as compared to 4C model9,40. Various factors may contribute to the sources of error in this method and these include variations in the type of fluid measured, isotopic equilibrium time, correction for dilution space and the analysis method used to measure the isotopic enrichment. While the method is accurate, the cost of the isotopes and the technical expertise needed in analysing the results limit the wide use.
Dual-energy X-ray absorptiometry (DEXA)
The DEXA method measures body fat, muscle and total body bone mineral (TBBM) using two X-ray energies. The principle of the DEXA is that the attenuation of X-rays with high and low photon energies is measureable and depends on the properties of the underlying tissue. The variations in the attenuation of X-ray through the tissues are caused by differences in the density and chemical composition of fat, LT and bone. The DEXA is quick, has low radiation exposure and needs little technical skill and preparation by the individual. The images can be split into the components of bone and soft tissue using two different energy levels. While DEXA is the gold standard for bone mineral density measurements41, it is also used to estimate total and regional body fat and LTM.
During a DEXA measurement, the person lies on a bed and an X-ray beam passes in a posterior-to-anterior direction to a detector. The DEXA method has the ability to assess regional as well as total body composition. The DEXA estimates of body FM when compared to 4C model in south Indian men and women, showed a mean error of 1.6 kg12.
The DEXA method assumes that the amount of fat over bone is the same as the amount of fat over bone-free tissue, when, in fact, it varies and this is a major drawback in using DEXA to estimate %BF. DEXA has shown to be more accurate than methods from body density, for estimating total body fat42. The DEXA analysis assumes a constant hydration of lean soft tissue, but hydration varies with age, gender and disease and this could be a possible limitation. The repeatability (CV) in the range of 1-2 per cent BF and 0.5-2 per cent for LT has been reported for DEXA. The DEXA has been used for body composition analysis in a wide range of clinical applications43.
Computed tomography (CT) and computed tomography body composition (CTBC)
A high-resolution, three-dimensional volume image of parts of the body can be obtained from CT, using X-ray projections from different angles of the body. The attenuation differences between X-rays of lean soft tissue and adipose tissue (AT) are used to separate these tissues. The fat in the skeletal muscle tissue44 and in the liver45 can be accurately determined using CT, although it is significantly less accurate for liver fat <5 per cent. Direct volumetric measurements of organs and different AT depots can be obtained using CT. However, body composition measurement using CT is often measured using a two-dimensional analysis of specific axial slices of the body. This is done mainly to minimize the radiation dose46 and also due to the difficulties in the manual segmentation of different compartments in the images.
Magnetic resonance imaging (MRI)
Images of soft tissue in the body can be produced by MRI, which uses the different magnetic properties of the nuclei of elements in the cell, usually hydrogen in water and fat. Several methods based on MRI have been developed for quantification of AT47 and muscles48,49,50. Diffuse fat infiltration in organs and precise regional measurements of AT and LT are estimated using ‘quantitative fat water imaging’, which is based on Dixon imaging51. In this technique, the separation of the signals into water and fat image is made using the magnetic resonance frequencies of protons in fat and water. Since the MRI does not use ionizing radiation, it can be used for three-dimensional volumetric imaging even in neonate and infants. However, due to the limited availability of efficient tools for analyzing three-dimensional image segmentation, body composition using MRI is restricted to one- or two-dimensional slices. Poor prediction of visceral and subcutaneous AT changes during weight loss has been observed using single slice MRI52,53.
Whole-body potassium counter (WBKC)
The cellular 4C model partitions the body into fat, body cell mass (BCM), ECF, and extra cellular solids (ECSs)54. The BCM is the metabolically active tissue55 and contains more than 98 per cent of the body's potassium content. The WBKC is the gold standard to accurately measure the BCM. Besides BCM, the total body potassium (TBK) method can provide estimates of body fat using estimates of weight, BCM and TBW56. The method can also be used as a non-invasive method of estimating body protein and skeletal muscle mass57,58. The measurement of BCM is particularly useful in conditions of changing hydration status, such as in pregnant women, infancy and severe acute malnutrition where the hydration status is affected by oedema59,60,61. The TBK method is the reference measurement to define the protein requirements of pregnancy62 as it is independent of a changing hydration status during pregnancy and free of radiation exposure from imaging techniques.
During the TBK measurements, adult individuals have to lie supine for 30 min on the moveable bed of the WBKC. The bed is rolled under the detectors, to measure the entire body (from superior to inferior) in three segments, at an interval of 10 min each. The TBK is estimated using the constant proportion of 40K to its major stable isotopes. From this, total body nitrogen (TBN) can be calculated, assuming a TBK to nitrogen ratio of 2.15 mmol K/gN63. Total body protein can be estimated as 6.25 × TBN (g)54, from which BCM can be calculated as BCM (kg) = 0.0092 × TBK (mmol)64.
Body composition in infants and children
Newborns and infants
Body composition assessment in newborn infants provides an insight into the distribution of lean and FM to weight in the newborn and an idea of the different factors influencing intrauterine growth. Infant body composition is an early and potentially modifiable risk factor for subsequent metabolic disease and other outcomes65 and could play a role in the developmental origins of health and disease. This is of particular relevance in Indian newborns who have been suggested to be of the ‘thin fat phenotype’66, having similar body fat as compared to European counterparts, despite having lower birth weight, suggesting that they conserve FM at the expense of FFM. These studies however, assessed body composition using anthropometric measurements such as SKFs, mid-arm, and abdominal circumferences. In infancy, the components of FFM change rapidly, and hence, a multicomponent model is ideal for the development of reference data and for validation of new techniques. Pioneer work in evaluating body composition in infants from birth to two years, using multicompartment model was performed by Butte et al67, which still remains one of the few multicompartment datasets in infant body composition. However, multicompartment methods of body composition are not practical in infants, and the commonly used methods to measure infant body compassion include anthropometry, isotope dilution, ADP, BIA, DEXA and MRI.
Anthropometry provides an inexpensive, portable and simple method of body composition in infants; however, the points to be considered include careful calibration of the instruments, reducing inter/intra-observer errors, age and ethnic composition of the population used for the prediction equation68. Deuterium dilution technique has been shown to be a precise and accurate method for assessing body composition in infants69. Body composition of Indian newborn infants was assessed using deuterium dilution technique, and it was observed that %FM was similar to infants of similar age from western populations and %FM and %FFM were constant over the range of birth weights70. The possible errors in using this technique in infants could arise from the inability to accurately document changes in the amount of fluid consumed or the urine/stool passed, between the dose administration and sample collection in the breastfed and also the loss of some of the isotope dose caused by the drooling of some babies, which could make the exact estimation of ingested dose difficult.
ADP is another method used in infants which has good accuracy for volume estimation, provides valid measures of FM and FFM68 and is highly reliable between repeat measurements. The ADP method in comparison with both deuterium dilution and 4C has been shown to provide accurate and reliable estimates of %fat in infants71, suggesting that it is an easy and valid method of body composition assessment in early life.
BIA has been used to measure body composition in infants and infant prediction equations have been developed68. Although the BIA is a non-invasive, relatively cheap, safe, and portable method of body composition assessment, its application to the infant population has shown results with low accuracy at the individual level68. The DEXA method although accurate in other age groups has limited data in children less than two years of age, possibly due to issues of exposure to radiation. Fields et al72 validated DEXA in infants against another body composition technique, but data on reference body composition using DEXA in infants have not yet been published. Factors such as infant movement during measurement, differences observed in manufacturers, hardware, software algorithms, analysis of the scan and techniques of data acquisition may affect body composition estimates, especially in infants who are smaller in size73. MRI protocols feasible for infants have been developed, which are rapid and provide estimates of AT volumes. MRI technique in infants demonstrated that there is reduction in subcutaneous rather than intra-abdominal AT in infants with intrauterine growth restriction68. Although MRI does not involve exposure to radiation, body movement causes artefacts during image acquisition; hence, infants need to be scanned while sleeping, thus making the technique possible mainly in infants below six months of age. In addition, the cost and accessibility concerns make this technique more applicable for basic human biological and clinical studies rather than in large-scale population-based research. The WBKC has been used to determine the body composition and derive normative data for infants from birth to two years of age67.
Children
With the increasing rate of childhood obesity and its relation with health risk, it is critical to accurately measure body fat in children. Growth charts are commonly used to assess nutritional status of children and these charts describe the pattern of growth in a population at a given time point but do not assume any particular optimal level of growth74. BMI follows a curvilinear pattern with age in children, suggesting that no single value can be used as a cut-off to define overweight and obesity. The CDC 2000 Growth Reference Charts have been developed on American children75. The International Obesity Task Force (IOTF) standards are based on BMI categories collected from six international pooled data sets in 2000, on children aged 2-18 yr76. These charts assume that the most appropriate cut-off points for overweight and obesity in children are those corresponding to the BMI of 25 and 30 kg/m2, respectively, in the BMI distribution for adults. The IOTF charts, however, provide only overweight and obesity categories and not percentile levels and are thus not useful for monitoring the BMI progress of individual children. The WHO Growth Standards on children77 address the double burden of malnutrition since it is a valuable tool for identifying both undernutrition and obesity. Age- and gender-specific BMI cut-offs, based on urban Indian affluent children, have been developed by Khadilkar et al78. These are linked to the BMI of 23 and 28 kg/m2 for overweight and obesity for Asians in adult population. These growth curves were revised79 and the cut-offs can be used to identify overweight and obesity. Strong association with risk for coronary heart disease and waist circumference has been observed80, and the waist circumference can be used as an index of obesity and obesity-related health risk among children. Waist percentile curves for south Indian children aged 3-16 yr81 have been developed and can be used to assess abdominal obesity.
Although the BMI is a popular method of measuring obesity in children, it cannot accurately differentiate between fat and lean mass, and this is particularly important since South Asians are considered to be of ‘thin yet fat’ phenotype, having relatively higher fat and lower lean mass for a given BMI82,83. Age-related increase in BMI among children and adolescents has been largely attributed to FFM84. The FM and FFM are normalized for body size to allow for comparisons between children across different ages; the fat mass index (FMI; fat mass/height2) and fat-free mass index (FFMI; fat-free mass/height2) are independent measures of FM and FFM that are normalized for height74. A graphic representation of these indices along with %BF and BMI was suggested to simultaneously examine all the different indices and their associations85.
In children, body fat can be measured using techniques such as SKF, BIA, DEXA and ADP. Body fat percentile curves in children have been generated in western populations86,87 and in urban North/West India88,89 using techniques such as SKF, BIA and DEXA. Smoothed percentile curves have been recently generated for body composition (%BF, FMI and FFMI) in a large number of urban middle-class schoolchildren aged 6-15 yr from Bengaluru and these curves can be used to identify and prevent paediatric overweight/obesity in Indian children90. While body composition reference data are available from high-income and low middle-income countries, evidence suggests that there may be need for population-specific standards and caution is also needed when comparing data from different body composition techniques.
Future - Body composition analysis and the smartphone technology
Body composition analysis using mobile technologies has made data to be readily obtained in real-life settings rather than in specialized laboratories91. New advances have been made in traditional anthropometry with the development of automated optical scanning systems, which can quickly provide body dimensions such as length, breadth and circumference92 and a few validation studies have shown that these optical methods compare well with reference methods, although further refinements of the methods are required. BIA instruments based on smartphone technology are also available93,94. Further innovations in sensor-based technologies of body composition are likely to make these techniques more easily and widely used.
Conclusion
The measurement of body composition is important in nutritional evaluation and interventions. There are a number of techniques available which can be used in different age groups. It is important to consider both accuracy and precision when comparing different methods. Factors such as feasibility, cost, technical skill needed, level of accuracy, participant burden, radiation exposure, time taken, validation in an appropriate population, and availability of reference data have to be considered while choosing a suitable method.
Footnotes
Financial support & sponsorship: None.
Conflicts of Interest: None.
References
- 1.Thibault R, Genton L, Pichard C. Body composition: Why, when and for who? Clin Nutr. 2012;31:435–47. doi: 10.1016/j.clnu.2011.12.011. [DOI] [PubMed] [Google Scholar]
- 2.Andreoli A, Garaci F, Cafarelli FP, Guglielmi G. Body composition in clinical practice. Eur J Radiol. 2016;85:1461–8. doi: 10.1016/j.ejrad.2016.02.005. [DOI] [PubMed] [Google Scholar]
- 3.Morley JE, Thomas DR, Wilson MMG. Cachexia: Pathophysiology and clinical relevance. Am J Clin Nutr. 2006;83:735–43. doi: 10.1093/ajcn/83.4.735. [DOI] [PubMed] [Google Scholar]
- 4.Cruz-Jentoft AJ, Morley JE. Sarcopenia. Chichester, West Sussex, Hoboken NJ: Wiley-Blackwell; 2012. [Google Scholar]
- 5.Cruz-Jentoft AJ, Baeyens JP, Bauer JM, Boirie Y, Cederholm T, Landi F, et al. Sarcopenia: European consensus on definition and diagnosis: Report of the European Working Group on Sarcopenia in older people. Age Ageing. 2010;39:412–23. doi: 10.1093/ageing/afq034. [DOI] [PMC free article] [PubMed] [Google Scholar]
- 6.Thomas EL, Fitzpatrick JA, Malik SJ, Taylor-Robinson SD, Bell JD. Whole body fat: Content and distribution. Prog Nucl Magn Reson Spectrosc. 2013;73:56–80. doi: 10.1016/j.pnmrs.2013.04.001. [DOI] [PubMed] [Google Scholar]
- 7.Ellis KJ. Human body composition: In vivo methods. Physiol Rev. 2000;80:649–80. doi: 10.1152/physrev.2000.80.2.649. [DOI] [PubMed] [Google Scholar]
- 8.Brozek J, Grande F, Anderson JT, Keys A. Densitometric analysis of body composition: Revision of some quantitative assumptions. Ann N Y Acad Sci. 1963;110:113–40. doi: 10.1111/j.1749-6632.1963.tb17079.x. [DOI] [PubMed] [Google Scholar]
- 9.Withers RT, LaForgia J, Pillans RK, Shipp NJ, Chatterton BE, Schultz CG, et al. Comparisons of two-, three-, and four-compartment models of body composition analysis in men and women. J Appl Physiol (1985) 1998;85:238–45. doi: 10.1152/jappl.1998.85.1.238. [DOI] [PubMed] [Google Scholar]
- 10.Baumgartner RN. Body composition in healthy aging. Ann N Y Acad Sci. 2000;904:437–48. doi: 10.1111/j.1749-6632.2000.tb06498.x. [DOI] [PubMed] [Google Scholar]
- 11.Lindberg V. Uncertainties and error propagation. [accessed on September 15, 2018]. Available from: http://www.geol.lsu.edu/jlorenzo/geophysics/uncertainties/Uncertaintiespart2.html#propagationhttp://www.geol.lsu.edu/jlorenzo/geophysics/uncertainties/Uncertaintiespart2.html#propagation .
- 12.Kuriyan R, Thomas T, Ashok S, Jayakumar J, Kurpad AV. A 4-compartment model based validation of air displacement plethysmography, dual energy X-ray absorptiometry, skinfold technique & bio-electrical impedance for measuring body fat in Indian adults. Indian J Med Res. 2014;139:700–7. [PMC free article] [PubMed] [Google Scholar]
- 13.Heyward VH, Wagner DR. Applied body composition assessment. 2nd ed. Champaign, IL: Human Kinetics; 2004. [Google Scholar]
- 14.Obesity, prevention and managing the global epidemic. Report of a WHO consultation on obesity. Geneva: WHO; 1998. World Health Organization. [PubMed] [Google Scholar]
- 15.Gallagher D, Heymsfield SB, Heo M, Jebb SA, Murgatroyd PR, Sakamoto Y, et al. Healthy percentage body fat ranges: An approach for developing guidelines based on body mass index. Am J Clin Nutr. 2000;72:694–701. doi: 10.1093/ajcn/72.3.694. [DOI] [PubMed] [Google Scholar]
- 16.Thomas EL, Frost G, Taylor-Robinson SD, Bell JD. Excess body fat in obese and normal-weight subjects. Nutr Res Rev. 2012;25:150–61. doi: 10.1017/S0954422412000054. [DOI] [PubMed] [Google Scholar]
- 17.Prentice AM, Jebb SA. Beyond body mass index. Obes Rev. 2001;2:141–7. doi: 10.1046/j.1467-789x.2001.00031.x. [DOI] [PubMed] [Google Scholar]
- 18.Tomiyama AJ, Hunger JM, Nguyen-Cuu J, Wells C. Misclassification of cardiometabolic health when using body mass index categories in NHANES 2005-2012. Int J Obes (Lond) 2016;40:883–6. doi: 10.1038/ijo.2016.17. [DOI] [PubMed] [Google Scholar]
- 19.Dudeja V, Misra A, Pandey RM, Devina G, Kumar G, Vikram NK, et al. BMI does not accurately predict overweight in Asian Indians in Northern India. Br J Nutr. 2001;86:105–12. doi: 10.1079/bjn2001382. [DOI] [PubMed] [Google Scholar]
- 20.Deurenberg-Yap M, Chew SK, Deurenberg P. Elevated body fat percentage and cardiovascular risks at low body mass index levels among Singaporean Chinese, Malays and Indians. Obes Rev. 2002;3:209–15. doi: 10.1046/j.1467-789x.2002.00069.x. [DOI] [PubMed] [Google Scholar]
- 21.The Asia-Pacific perspective: Redefining obesity and its treatment. Melbourne: Health Communications Australia; 2000. WHO/IASO/IOTF. [Google Scholar]
- 22.WHO Expert Consultation. Appropriate body-mass index for Asian populations and its implications for policy and intervention strategies. Lancet. 2004;363:157–63. doi: 10.1016/S0140-6736(03)15268-3. [DOI] [PubMed] [Google Scholar]
- 23.Misra A. Ethnic-Specific Criteria for Classification of Body Mass Index: A Perspective for Asian Indians and American Diabetes Association Position Statement. Diabetes Technol Ther. 2015;17:667–71. doi: 10.1089/dia.2015.0007. [DOI] [PMC free article] [PubMed] [Google Scholar]
- 24.Physical status: The use and interpretation of anthropometry. Report of a WHO expert committee. World Health Organ Tech Rep Ser. 1995;854:1–452. [PubMed] [Google Scholar]
- 25.Misra A, Vikram NK, Gupta R, Pandey RM, Wasir JS, Gupta VP. Waist circumference cutoff points and action levels for Asian Indians for identification of abdominal obesity. Int J Obes (Lond) 2006;30:106–11. doi: 10.1038/sj.ijo.0803111. [DOI] [PubMed] [Google Scholar]
- 26.Durnin JV, Womersley J. Body fat assessed from total body density and its estimation from skinfold thickness: Measurements on 481 men and women aged from 16 to 72 years. Br J Nutr. 1974;32:77–97. doi: 10.1079/bjn19740060. [DOI] [PubMed] [Google Scholar]
- 27.Siri WE. Body composition from fluid spaces and density: Analysis of methods 1961. Nutrition. 1993;9:480–91. [PubMed] [Google Scholar]
- 28.Kuriyan R, Petracchi C, Ferro-Luzzi A, Shetty PS, Kurpad AV. Validation of expedient methods for measuring body composition in Indian adults. Indian J Med Res. 1998;107:37–45. [PubMed] [Google Scholar]
- 29.Khalil SF, Mohktar MS, Ibrahim F. The theory and fundamentals of bioimpedance analysis in clinical status monitoring and diagnosis of diseases. Sensors (Basel) 2014;14:10895–928. doi: 10.3390/s140610895. [DOI] [PMC free article] [PubMed] [Google Scholar]
- 30.Bioelectrical impedance analysis in body composition measurement: National Institutes of Health Technology Assessment Conference Statement. Am J Clin Nutr. 1996;64:524S–32S. doi: 10.1093/ajcn/64.3.524S. [DOI] [PubMed] [Google Scholar]
- 31.Lee SY, Gallagher D. Assessment methods in human body composition. Curr Opin Clin Nutr Metab Care. 2008;11:566–72. doi: 10.1097/MCO.0b013e32830b5f23. [DOI] [PMC free article] [PubMed] [Google Scholar]
- 32.Bhat DS, Yajnik CS, Sayyad MG, Raut KN, Lubree HG, Rege SS, et al. Body fat measurement in Indian men: Comparison of three methods based on a two-compartment model. Int J Obes (Lond) 2005;29:842–8. doi: 10.1038/sj.ijo.0802953. [DOI] [PubMed] [Google Scholar]
- 33.Withers RT, LaForgia J, Pillans RK, Shipp NJ, Chatterton BE, Schultz CG, et al. Comparisons of two-, three-, and four-compartment models of body composition analysis in men and women. J Appl Physiol (1985) 1998;85:238–45. doi: 10.1152/jappl.1998.85.1.238. [DOI] [PubMed] [Google Scholar]
- 34.Fields DA, Wilson GD, Gladden LB, Hunter GR, Pascoe DD, Goran MI, et al. Comparison of the BOD POD with the four-compartment model in adult females. Med Sci Sports Exerc. 2001;33:1605–10. doi: 10.1097/00005768-200109000-00026. [DOI] [PubMed] [Google Scholar]
- 35.Wagner DR, Heyward VH, Gibson AL. Validation of air displacement plethysmography for assessing body composition. Med Sci Sports Exerc. 2000;32:1339–44. doi: 10.1097/00005768-200007000-00023. [DOI] [PubMed] [Google Scholar]
- 36.Millard-Stafford ML, Collins MA, Evans EM, Snow TK, Cureton KJ, Rosskopf LB, et al. Use of air displacement plethysmography for estimating body fat in a four-component model. Med Sci Sports Exerc. 2001;33:1311–7. doi: 10.1097/00005768-200108000-00011. [DOI] [PubMed] [Google Scholar]
- 37.Edelman IS, Olney JM, James AH, Brooks L, Moore FD. Body composition: Studies in the human being by the dilution principle. Science. 1952;115:447–54. doi: 10.1126/science.115.2991.447. [DOI] [PubMed] [Google Scholar]
- 38.Scholeller DA. Hydrometry. In: Roche AF, Heymsfield SB, Lohman TG, editors. Human body composition. Champaign, IL: Human Kinetics; 1996. pp. 25–43. [Google Scholar]
- 39.Lohman TG, Harris M, Teixeira PJ, Weiss L. Assessing body composition and changes in body composition. Another look at dual-energy X-ray absorptiometry. Ann N Y Acad Sci. 2000;904:45–54. doi: 10.1111/j.1749-6632.2000.tb06420.x. [DOI] [PubMed] [Google Scholar]
- 40.Fuller NJ, Sawyer MB, Elia M. Comparative evaluation of body composition methods and predictions, and calculation of density and hydration fraction of fat-free mass, in obese women. Int J Obes Relat Metab Disord. 1994;18:503–12. [PubMed] [Google Scholar]
- 41.Garg MK, Kharb S. Dual energy X-ray absorptiometry: Pitfalls in measurement and interpretation of bone mineral density. Indian J Endocrinol Metab. 2013;17:203–10. doi: 10.4103/2230-8210.109659. [DOI] [PMC free article] [PubMed] [Google Scholar]
- 42.Prior BM, Cureton KJ, Modlesky CM, Evans EM, Sloniger MA, Saunders M, et al. In vivo validation of whole body composition estimates from dual-energy X-ray absorptiometry. J Appl Physiol (1985) 1997;83:623–30. doi: 10.1152/jappl.1997.83.2.623. [DOI] [PubMed] [Google Scholar]
- 43.Albanese CV, Diessel E, Genant HK. Clinical applications of body composition measurements using DXA. J Clin Densitom. 2003;6:75–85. doi: 10.1385/jcd:6:2:75. [DOI] [PubMed] [Google Scholar]
- 44.Goodpaster BH, Kelley DE, Thaete FL, He J, Ross R. Skeletal muscle attenuation determined by computed tomography is associated with skeletal muscle lipid content. J Appl Physiol (1985) 2000;89:104–10. doi: 10.1152/jappl.2000.89.1.104. [DOI] [PubMed] [Google Scholar]
- 45.Kramer H, Pickhardt PJ, Kliewer MA, Hernando D, Chen GH, Zagzebski JA, et al. Accuracy of liver fat quantification with advanced CT, MRI, and ultrasound techniques: Prospective comparison with MR spectroscopy. AJR Am J Roentgenol. 2017;208:92–100. doi: 10.2214/AJR.16.16565. [DOI] [PMC free article] [PubMed] [Google Scholar]
- 46.Yu L, Liu X, Leng S, Kofler JM, Ramirez-Giraldo JC, Qu M, et al. Radiation dose reduction in computed tomography: Techniques and future perspective. Imaging Med. 2009;1:65–84. doi: 10.2217/iim.09.5. [DOI] [PMC free article] [PubMed] [Google Scholar]
- 47.Hu HH, Chen J, Shen W. Segmentation and quantification of adipose tissue by magnetic resonance imaging. MAGMA. 2016;29:259–76. doi: 10.1007/s10334-015-0498-z. [DOI] [PMC free article] [PubMed] [Google Scholar]
- 48.Karlsson A, Rosander J, Romu T, Tallberg J, Grönqvist A, Borga M, et al. Automatic and quantitative assessment of regional muscle volume by multi-atlas segmentation using whole-body water-fat MRI. J Magn Reson Imaging. 2015;41:1558–69. doi: 10.1002/jmri.24726. [DOI] [PubMed] [Google Scholar]
- 49.Lareau-Trudel E, Le Troter A, Ghattas B, Pouget J, Attarian S, Bendahan D, et al. Muscle quantitative MR imaging and clustering analysis in patients with facioscapulohumeral muscular dystrophy type 1. PLoS One. 2015;10:e0132717. doi: 10.1371/journal.pone.0132717. [DOI] [PMC free article] [PubMed] [Google Scholar]
- 50.Orgiu S, Lafortuna CL, Rastelli F, Cadioli M, Falini A, Rizzo G, et al. Automatic muscle and fat segmentation in the thigh from T1-weighted MRI. J Magn Reson Imaging. 2016;43:601–10. doi: 10.1002/jmri.25031. [DOI] [PubMed] [Google Scholar]
- 51.Dixon WT. Simple proton spectroscopic imaging. Radiology. 1984;153:189–94. doi: 10.1148/radiology.153.1.6089263. [DOI] [PubMed] [Google Scholar]
- 52.Thomas EL, Bell JD. Influence of undersampling on magnetic resonance imaging measurements of intra-abdominal adipose tissue. Int J Obes Relat Metab Disord. 2003;27:211–8. doi: 10.1038/sj.ijo.802229. [DOI] [PubMed] [Google Scholar]
- 53.Shen W, Chen J, Gantz M, Velasquez G, Punyanitya M, Heymsfield SB, et al. A single MRI slice does not accurately predict visceral and subcutaneous adipose tissue changes during weight loss. Obesity (Silver Spring) 2012;20:2458–63. doi: 10.1038/oby.2012.168. [DOI] [PMC free article] [PubMed] [Google Scholar]
- 54.Wang Z, Shen W, Kotler DP, Heshka S, Wielopolski L, Aloia JF, et al. Total body protein: A new cellular level mass and distribution prediction model. Am J Clin Nutr. 2003;78:979–84. doi: 10.1093/ajcn/78.5.979. [DOI] [PubMed] [Google Scholar]
- 55.Moore FD. The body cell mass and its supporting environment: Body composition in health and disease. Philadelphia, London: W. B. Saunders Co; 1963. [Google Scholar]
- 56.Wang Z, Deurenberg P, Wang W, Pietrobelli A, Baumgartner RN, Heymsfield SB, et al. Hydration of fat-free body mass: New physiological modeling approach. Am J Physiol. 1999;276:E995–E1003. doi: 10.1152/ajpendo.1999.276.6.E995. [DOI] [PubMed] [Google Scholar]
- 57.Wang Z, Zhu S, Wang J, Pierson RN., Jr Heymsfield SB. Whole-body skeletal muscle mass: Development and validation of total-body potassium prediction models. Am J Clin Nutr. 2003;77:76–82. doi: 10.1093/ajcn/77.1.76. [DOI] [PubMed] [Google Scholar]
- 58.Wang Z, Heshka S, Wang J, Heymsfield SB. Total body protein mass: Validation of total body potassium prediction model in children and adolescents. J Nutr. 2006;136:1032–6. doi: 10.1093/jn/136.4.1032. [DOI] [PubMed] [Google Scholar]
- 59.Garrow JS. Total body-potassium in kwashiorkor and marasmus. Lancet. 1965;2:455–8. doi: 10.1016/s0140-6736(65)91420-0. [DOI] [PubMed] [Google Scholar]
- 60.Nichols BL, Alleyne GA, Barnes DJ, Hazlewood CD. Relationship between muscle potassium and total body potassium in infants with malnutrition. J Pediatr. 1969;74:49–57. doi: 10.1016/s0022-3476(69)80007-7. [DOI] [PubMed] [Google Scholar]
- 61.Murphy AJ, Ellis KJ, Kurpad AV, Preston T, Slater C. Total body potassium revisited. Eur J Clin Nutr. 2014;68:153–4. doi: 10.1038/ejcn.2013.262. [DOI] [PubMed] [Google Scholar]
- 62.Protein and amino acid requirements in human nutrition. World Health Organ Tech Rep Ser 935. Geneva: WHO; 2007. [accessed on September 25, 2018]. Joint WHO/FAO/UNU Expert Consultation. Available from: http://www.who.int/iris/handle/10665/43411 . [PubMed] [Google Scholar]
- 63.King JC, Calloway DH, Margen S. Nitrogen retention, total body 40 K and weight gain in teenage pregnant girls. J Nutr. 1973;103:772–85. doi: 10.1093/jn/103.5.772. [DOI] [PubMed] [Google Scholar]
- 64.Wang Z, St. Onge MP, Lecumberri B, Pi-Sunyer FX, Heshka S, Wang J. Body cell mass: Model development and validation at the cellular level of body composition. Am J Physiol Endocrinol Metab. 2004;286:E123–8. doi: 10.1152/ajpendo.00227.2003. [DOI] [PubMed] [Google Scholar]
- 65.Ibáñez L, Ong K, Dunger DB, de Zegher F. Early development of adiposity and insulin resistance after catch-up weight gain in small-for-gestational-age children. J Clin Endocrinol Metab. 2006;91:2153–8. doi: 10.1210/jc.2005-2778. [DOI] [PubMed] [Google Scholar]
- 66.Yajnik CS, Fall CHD, Coyaji KJ, Hirve SS, Rao S, Barker DJP, et al. Neonatal anthropometry: The thin-fat indian baby. The Pune Maternal Nutrition Study. Int J Obes Relat Metab Disord. 2003;27:173–80. doi: 10.1038/sj.ijo.802219. [DOI] [PubMed] [Google Scholar]
- 67.Butte NF, Hopkinson JM, Wong WW, Smith EO, Ellis KJ. Body composition during the first 2 years of life: An updated reference. Pediatr Res. 2000;47:578–85. doi: 10.1203/00006450-200005000-00004. [DOI] [PubMed] [Google Scholar]
- 68.Demerath EW, Fields DA. Body composition assessment in the infant. Am J Hum Biol. 2014;26:291–304. doi: 10.1002/ajhb.22500. [DOI] [PMC free article] [PubMed] [Google Scholar]
- 69.Wells JC, Hawton K, Darch T, Lunn PG. Body composition by 2H dilution in Gambian infants: Comparison with UK infants and evaluation of simple prediction methods. Br J Nutr. 2009;102:1776–82. doi: 10.1017/S0007114509991255. [DOI] [PubMed] [Google Scholar]
- 70.Jain V, Kurpad AV, Kumar B, Devi S, Sreenivas V, Paul VK, et al. Body composition of term healthy Indian newborns. Eur J Clin Nutr. 2016;70:488–93. doi: 10.1038/ejcn.2015.152. [DOI] [PubMed] [Google Scholar]
- 71.Ward LC, Poston L, Godfrey KM, Koletzko B. Assessing early growth and adiposity: Report from an EarlyNutrition academy workshop. Ann Nutr Metab. 2013;63:120–30. doi: 10.1159/000350702. [DOI] [PubMed] [Google Scholar]
- 72.Fields DA, Demerath EW, Pietrobelli A, Chandler-Laney PC. Body composition at 6 months of life: Comparison of air displacement plethysmography and dual-energy X-ray absorptiometry. Obesity (Silver Spring) 2012;20:2302–6. doi: 10.1038/oby.2012.102. [DOI] [PubMed] [Google Scholar]
- 73.Koo WW, Hammami M, Hockman EM. Validation of bone mass and body composition measurements in small subjects with pencil beam dual energy X-ray absorptiometry. J Am Coll Nutr. 2004;23:79–84. doi: 10.1080/07315724.2004.10719346. [DOI] [PubMed] [Google Scholar]
- 74.Wells JC. Toward body composition reference data for infants, children, and adolescents. Adv Nutr. 2014;5:320S–9S. doi: 10.3945/an.113.005371. [DOI] [PMC free article] [PubMed] [Google Scholar]
- 75.Kuczmarski RJ, Ogden CL, Grummer-Strawn LM, Flegal KM, Guo SS, Wei R, et al. CDC growth charts: United States. Adv Data. 2000;((314)):1–27. [PubMed] [Google Scholar]
- 76.Cole TJ, Bellizzi MC, Flegal KM, Dietz WH. Establishing a standard definition for child overweight and obesity worldwide: International survey. BMJ. 2000;320:1240–3. doi: 10.1136/bmj.320.7244.1240. [DOI] [PMC free article] [PubMed] [Google Scholar]
- 77.WHO Multicentre Growth Reference Study Group. WHO child growth standards based on length/height, weight and age. Acta Paediatr. 2006;450((Suppl)):76–85. doi: 10.1111/j.1651-2227.2006.tb02378.x. [DOI] [PubMed] [Google Scholar]
- 78.Khadilkar VV, Khadilkar AV, Borade AB, Chiplonkar SA. Body mass index cut-offs for screening for childhood overweight and obesity in Indian children. Indian Pediatr. 2012;49:29–34. doi: 10.1007/s13312-012-0011-y. [DOI] [PubMed] [Google Scholar]
- 79.Khadilkar VV, Khadilkar AV. Revised Indian Academy of Pediatrics 2015 growth charts for height, weight and body mass index for 5-18-year-old indian children. Indian J Endocrinol Metab. 2015;19:470–6. doi: 10.4103/2230-8210.159028. [DOI] [PMC free article] [PubMed] [Google Scholar]
- 80.Savva SC, Tornaritis M, Savva ME, Kourides Y, Panagi A, Silikiotou N, et al. Waist circumference and waist-to-height ratio are better predictors of cardiovascular disease risk factors in children than body mass index. Int J Obes Relat Metab Disord. 2000;24:1453–8. doi: 10.1038/sj.ijo.0801401. [DOI] [PubMed] [Google Scholar]
- 81.Kuriyan R, Thomas T, Lokesh DP, Sheth NR, Mahendra A, Joy R, et al. Waist circumference and waist for height percentiles in urban South Indian children aged 3-16 years. Indian Pediatr. 2011;48:765–71. doi: 10.1007/s13312-011-0126-6. [DOI] [PubMed] [Google Scholar]
- 82.Pandit D, Chiplonkar S, Khadilkar A, Khadilkar V, Ekbote V. Body fat percentages by dual-energy X-ray absorptiometry corresponding to body mass index cutoffs for overweight and obesity in Indian children. Clin Med Pediatr. 2009;3:55–61. doi: 10.4137/cmped.s3446. [DOI] [PMC free article] [PubMed] [Google Scholar]
- 83.Nightingale CM, Rudnicka AR, Owen CG, Cook DG, Whincup PH. Patterns of body size and adiposity among UK children of South Asian, black African-Caribbean and white European origin: Child heart and health study in England (CHASE study) Int J Epidemiol. 2011;40:33–44. doi: 10.1093/ije/dyq180. [DOI] [PMC free article] [PubMed] [Google Scholar]
- 84.Freedman DS, Wang J, Maynard LM, Thornton JC, Mei Z, Pierson RN, et al. Relation of BMI to fat and fat-free mass among children and adolescents. Int J Obes (Lond) 2005;29:1–8. doi: 10.1038/sj.ijo.0802735. [DOI] [PubMed] [Google Scholar]
- 85.Wells JC. A hattori chart analysis of body mass index in infants and children. Int J Obes Relat Metab Disord. 2000;24:325–9. doi: 10.1038/sj.ijo.0801132. [DOI] [PubMed] [Google Scholar]
- 86.McCarthy HD, Cole TJ, Fry T, Jebb SA, Prentice AM. Body fat reference curves for children. Int J Obes (Lond) 2006;30:598–602. doi: 10.1038/sj.ijo.0803232. [DOI] [PubMed] [Google Scholar]
- 87.Laurson KR, Eisenmann JC, Welk GJ. Body fat percentile curves for U.S. children and adolescents. Am J Prev Med. 2011;41:S87–92. doi: 10.1016/j.amepre.2011.06.044. [DOI] [PubMed] [Google Scholar]
- 88.Khadgawat R, Marwaha RK, Tandon N, Mehan N, Upadhyay AD, Sastry A, et al. Percentage body fat in apparently healthy school children from Northern India. Indian Pediatr. 2013;50:859–66. doi: 10.1007/s13312-013-0237-3. [DOI] [PubMed] [Google Scholar]
- 89.Khadilkar AV, Sanwalka NJ, Chiplonkar SA, Khadilkar VV, Pandit D. Body fat reference percentiles on healthy affluent Indian children and adolescents to screen for adiposity. Int J Obes (Lond) 2013;37:947–53. doi: 10.1038/ijo.2013.19. [DOI] [PubMed] [Google Scholar]
- 90.Kuriyan R, Selvan S, Thomas T, Jayakumar J, Lokesh DP, Phillip MP, et al. Body composition percentiles in urban South Indian children and adolescents. Obesity (Silver Spring) 2018;26:1629–36. doi: 10.1002/oby.22292. [DOI] [PubMed] [Google Scholar]
- 91.Villa F, Magnani A, Maggioni MA, Stahn A, Rampichini S, Merati G, et al. Wearable multi-frequency and multi-segment bioelectrical impedance spectroscopy for unobtrusively tracking body fluid shifts during physical activity in real-field applications: A preliminary study. Sensors (Basel) 2016;16 doi: 10.3390/s16050673. pii: E673. [DOI] [PMC free article] [PubMed] [Google Scholar]
- 92.Bourgeois B, Ng BK, Latimer D, Stannard CR, Romeo L, Li X, et al. Clinically applicable optical imaging technology for body size and shape analysis: Comparison of systems differing in design. Eur J Clin Nutr. 2017;71:1329–35. doi: 10.1038/ejcn.2017.142. [DOI] [PMC free article] [PubMed] [Google Scholar]
- 93.Choi A, Kim JY, Jo S, Jee JH, Heymsfield SB, Bhagat YA, et al. Smartphone-based bioelectrical impedance analysis devices for daily obesity management. Sensors (Basel) 2015;15:22151–66. doi: 10.3390/s150922151. [DOI] [PMC free article] [PubMed] [Google Scholar]
- 94.Heymsfield SB, Kim JY, Bhagat YA, Zheng J, Insoo Kim, Ahyoung Choi, et al. Mobile evaluation of human energy balance and weight control: Potential for future developments. Conf Proc IEEE Eng Med Biol Soc. 2015;2015:8201–4. doi: 10.1109/EMBC.2015.7320298. [DOI] [PubMed] [Google Scholar]