Abstract
Purpose
Frailty classifications of older patients with cancer have been developed to assist physicians in selecting cancer treatments and geriatric interventions. They have not been compared, and their performance in predicting outcomes has not been assessed. Our objectives were to assess agreement among four classifications and to compare their predictive performance in a large cohort of in- and outpatients with various cancers.
Patients and Methods
We prospectively included 1,021 patients age 70 years or older who had solid or hematologic malignancies and underwent a geriatric assessment in one of two French teaching hospitals between 2007 and 2012. Among them, 763 were assessed using four classifications: Balducci, International Society of Geriatric Oncology (SIOG) 1, SIOG2, and a latent class typology. Agreement was assessed using the κ statistic. Outcomes were 1-year mortality and 6-month unscheduled admissions.
Results
All four classifications had good discrimination for 1-year mortality (C-index ≥ 0.70); discrimination was best with SIOG1. For 6-month unscheduled admissions, discrimination was good with all four classifications (C-index ≥ 0.70). For classification into three (fit, vulnerable, or frail) or two categories (fit v vulnerable or frail and fit or vulnerable v frail), agreement among the four classifications ranged from very poor (κ ≤ 0.20) to good (0.60 < κ ≤ 0.80). Agreement was best between SIOG1 and the latent class typology and between SIOG1 and Balducci.
Conclusion
These four frailty classifications have good prognostic performance among older in- and outpatients with various cancers. They may prove useful in decision making about cancer treatments and geriatric interventions and/or in stratifying older patients with cancer in clinical trials.
INTRODUCTION
The burden of cancer increases with aging worldwide.1,2 Older patients with cancer raise therapeutic challenges, because they constitute a heterogeneous population with various combinations of comorbidities, disabilities, and geriatric syndromes that contribute to frailty. However, there is no consensus about the best means of measuring frailty. The two main approaches are the cumulative deficit model developed by Rockwood et al and the physical phenotype described by Fried.3 Neither has been validated in the geriatric oncology setting. The International Society of Geriatric Oncology (SIOG) recommends a geriatric assessment (GA) to detect previously unidentified impairments, predict severe treatment-related toxicity and overall mortality, and improve cancer treatment selection.4 Balducci et al5 reported a system for classifying older patients with cancer based on their GA findings. They identified three groups: fit, vulnerable, and frail. Fit patients may benefit from standard cancer treatment, vulnerable patients from adapted care, and frail patients from palliative care.6 Another classification, developed by Droz et al,7 is used in the SIOG guidelines for older men with prostate cancer (named SIOG1 in this study); in its updated version (SIOG2), only patients with an abnormal G8 screening test are evaluated.8 Again, patients are categorized into one of three groups: fit, vulnerable, or frail. These classifications are based on clinical expertise and consensus.5-8 They have not been compared, and their performance in predicting mortality and unscheduled admissions has not been assessed.9-11 Recently, we used a statistical approach—latent class (LC) analysis—to combine GA components into homogeneous health profiles seen among older patients with cancer.12 We identified four health profiles: relatively healthy (LC1), malnourished (LC2), cognitively and/or mood impaired (LC3), and globally impaired (LC4).
Our objectives were to compare these four frailty classifications in terms of both agreement and performance in predicting 1-year overall mortality and 6-month unscheduled admissions. We studied a large cohort of in- and outpatients with various cancers before treatment. We also assessed performance among subgroups defined by tumor site and metastatic status.
PATIENTS AND METHODS
Population
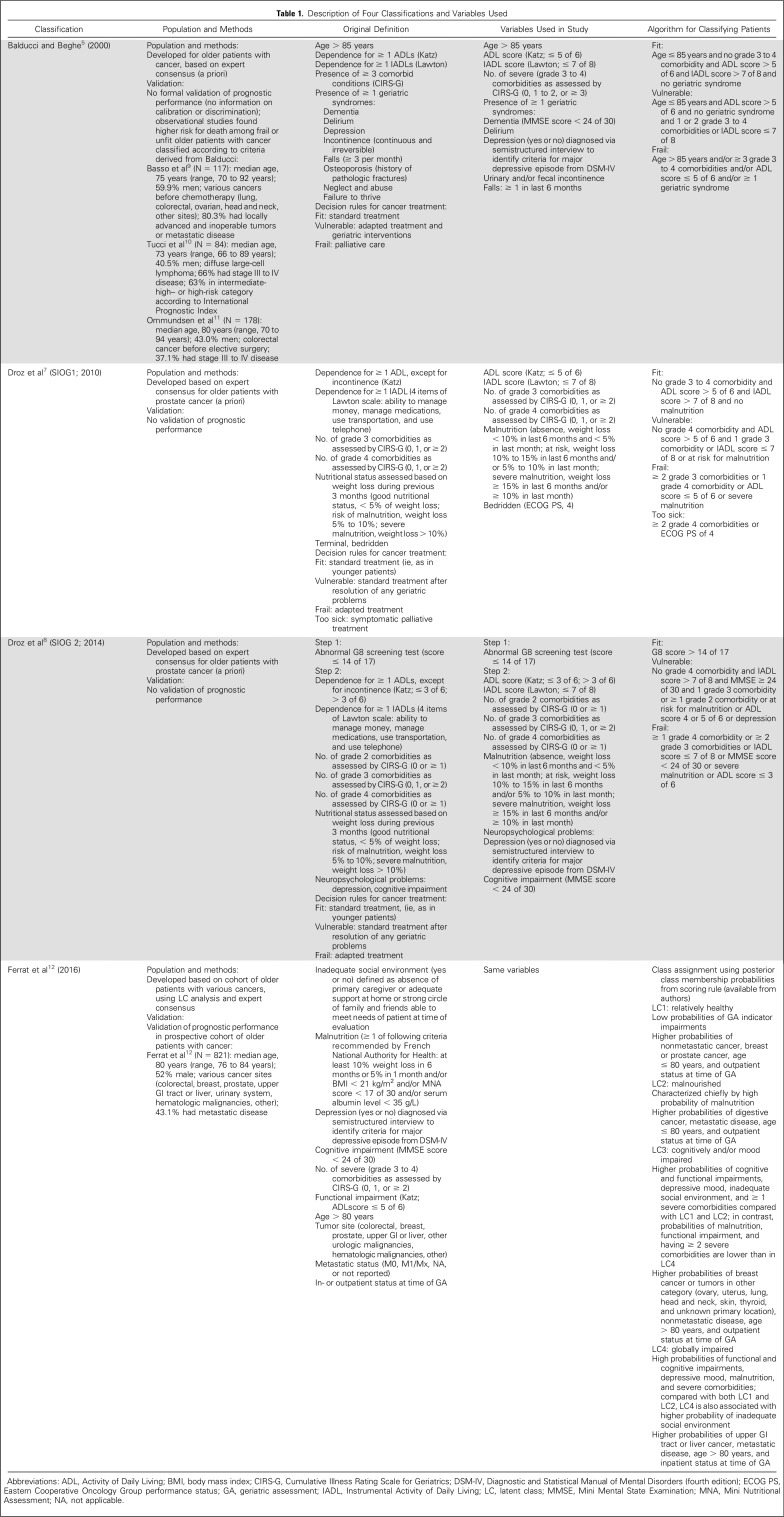
We used data from ELCAPA (Elderly Cancer Patients), a prospective cohort survey of consecutive patients age 70 years or older who had newly diagnosed cancer and were referred to one of the geriatric oncology clinics of two teaching hospitals in the Paris urban area, France, before cancer treatment decisions were made.13 For our study (ELCAPA14), we selected the 763 patients recruited between 2007 and 2012 for whom the data used in all four classifications were available (Table 1).
Table 1.
Description of Four Classifications and Variables Used
Geriatric Assessment and Data Collection
At baseline, all patients underwent a GA, as described previously.14 Domains and indicators used in the Balducci, SIOG1, SIOG2, and LC typology (LCT) classifications are listed in Table 1.5-8,12,14-19 Data were not available for three of the geriatric syndromes used in Balducci, namely, osteoporosis, neglect and abuse, and failure to thrive, which were therefore disregarded. For other variables unavailable in our database, we used substitutes (Table 1). We considered the following confounders: outpatient or inpatient status at the GA, year of patient inclusion, planned treatment decision (palliative, curative, or not reported), and age (median, ≤ 80 v > 80 years). In addition, given the previously reported greater prognostic value of metastatic status in breast and prostate malignancies, we also considered a composite variable combining tumor site and metastatic status, with nonmetastatic colorectal cancer as the reference category.20
Outcomes
The ability to predict overall 1-year mortality and 6-month unscheduled admissions was assessed for each classification. Vital status was determined from the medical records or public records office; unscheduled admissions were determined from medical records.
Statistical Analysis
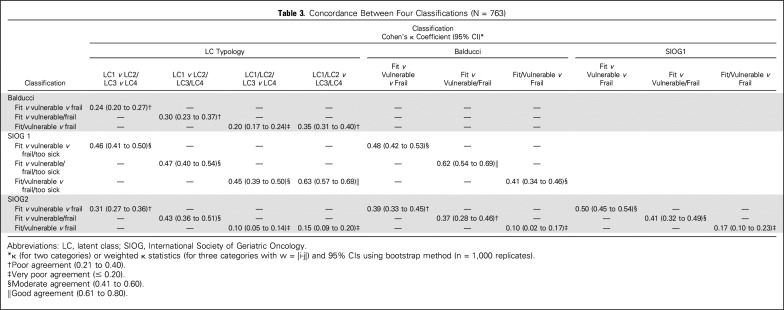
Categorical variables are described as numbers and percentages and quantitative variables as mean (standard deviation [SD]) or median (range) depending on distribution. To assess agreement among the four classifications, we used the κ or weighted κ statistic, as appropriate21,22; 95% CIs were computed using the bootstrap method with 1,000 replicates. Level of agreement was assessed as follows: κ ≤ 0.20, very poor; κ of 0.21 to 0.40, poor; κ of 0.41 to 60, moderate; κ of 0.61 to 80, good; and κ of 0.81 to 1.00, excellent. For all four classifications, we first considered three categories: fit, vulnerable, and frail. In the SIOG1 classification, patients in the too-sick and frail groups were pooled in the frail category. For the LCT, relatively healthy (LC1) patients were categorized as fit, malnourished (LC2) and those with cognitive and/or mood impairments (LC3) as vulnerable, and those with global impairment (LC4) as frail.12 Then, we simplified the classification into two categories, by pooling fit and vulnerable patients and comparing them with frail patients and by pooling vulnerable and frail patients and comparing them with fit patients. For these last analyses, LC3 patients were categorized as either vulnerable or frail.12
The log-rank test was used for global comparisons of mortality across categories. The proportional hazards assumption was assessed using Schoenfeld residual plots and tests.23 This assumption was met for all variables in the final models except in- or outpatient status. Stratified Cox models were developed to deal with this time-dependent variable. Models were adjusted for age, year of inclusion, final planned treatment strategy, and the composite variable combining tumor site and metastatic status.20 Hazard ratios (HRs) and their 95% CIs were estimated. We assessed calibration (level of agreement between observed and predicted 1-year survival probabilities) using graphs and the slope test.24 P values greater than .05 indicated good calibration. Discrimination (ability to separate patients with v without the outcome) was assessed using Harrell’s C-index with bootstrapped 95% CIs and the Royston-Sauerbrei D statistic (95% CI).25 C-index values of 0.60 to 0.69, 0.70 to 0.79, and 0.80 to 0.89 suggest moderate, good, and very good discrimination, respectively.26 Higher D statistic values indicate better discrimination; no threshold is available.
Prevalences of 6-month unscheduled admissions were compared globally across categories using the χ2 test. Then, we developed logistic models adjusted for age, year of inclusion, in- or outpatient status, tumor site and metastatic status, and final planned treatment strategy. Odds ratios (ORs) and their 95% CIs were estimated. Calibration and discrimination were assessed by the Hosmer-Lemeshow test and the area under the receiver operating characteristic curve.27,28 We compared the prognostic value of the models using the Akaike information criterion and calibration and discrimination indices.29
Subgroup Analyses
We performed analyses to assess the prognostic performance of the classifications in subgroups of patients with colorectal (n = 146), breast (n = 136), or prostate cancer (n = 98). Models were adjusted for age, year of inclusion, and metastatic status. Final planned treatment strategy was not included in the models, because of its collinearity with metastatic status. We also performed analyses in subgroups of patients with nonmetastatic (n = 311) or metastatic disease (n = 328). All tests were two sided, and P values of .05 or less were considered significant. The false discovery rate method was chosen to adjust for pairwise comparisons. Analyses were performed using STATA software (version 13.0; STATA, College Station, TX).
RESULTS
Study Population
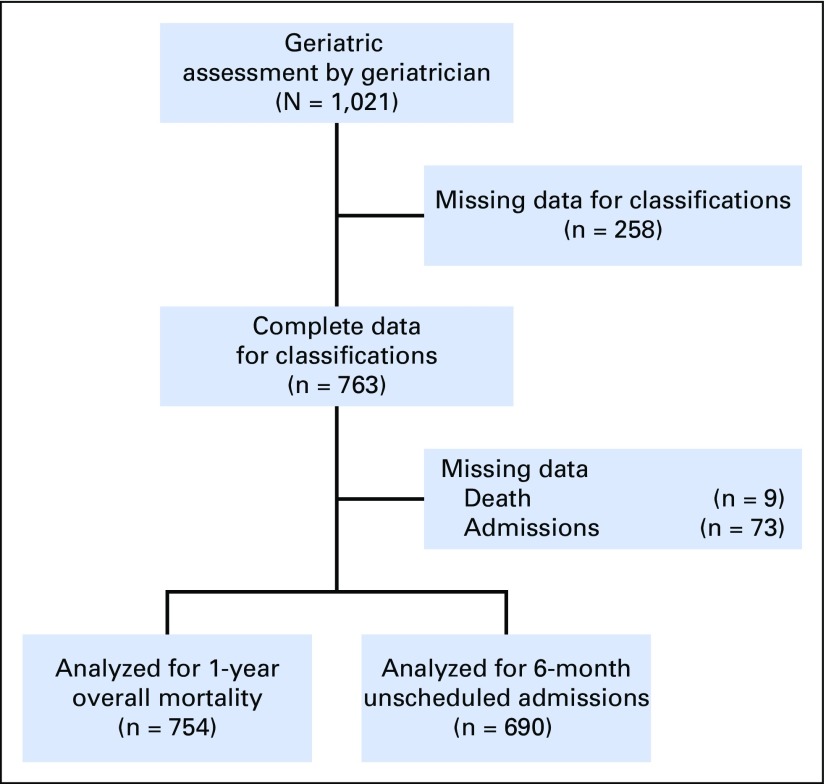
Of the 763 patients, 754 had information about vital status and 690 about 6-month unscheduled admissions (Fig 1). Mean age was 80 (SD, ± 5.7) years, 63.6% were outpatients, 52.4% were men, 19.1% had colorectal cancer, and 46.3% had metastatic disease. Other characteristics are listed in Appendix Table A1 (online only).
Fig 1.
Flow diagram of participants.
Agreement Among the Four Classifications
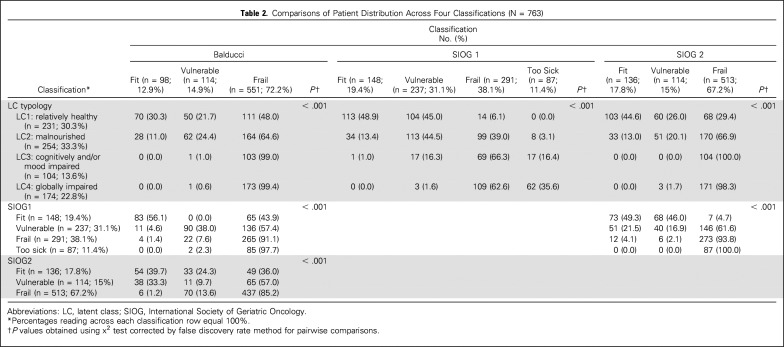
By univariable analysis, patient distribution differed significantly across the four classifications (all P < .001; Table 2). When we considered the following categories (fit, vulnerable, or frail; fit v vulnerable or frail; and fit or vulnerable v frail), agreement was very poor to poor between LCT and Balducci and between Balducci and SIOG2 (Table 3). Agreement was very poor to moderate between LCT and SIOG2 and between SIOG1 and SIOG2. Agreement was moderate to good between LCT and SIOG1 and between Balducci and SIOG1.
Table 2.
Comparisons of Patient Distribution Across Four Classifications (N = 763)
Table 3.
Concordance Between Four Classifications (N = 763)
Prognostic Performance of the Four Classifications
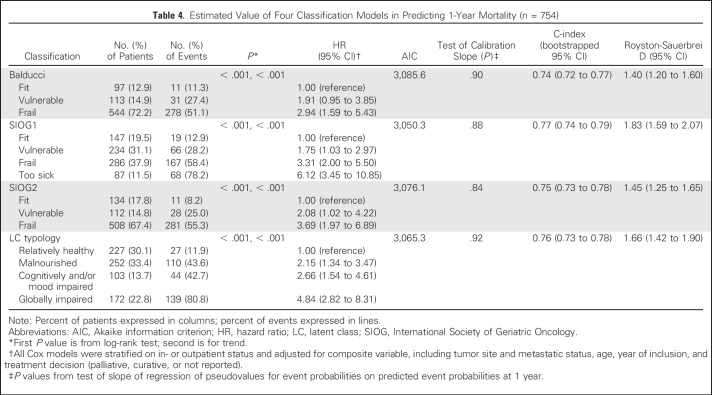
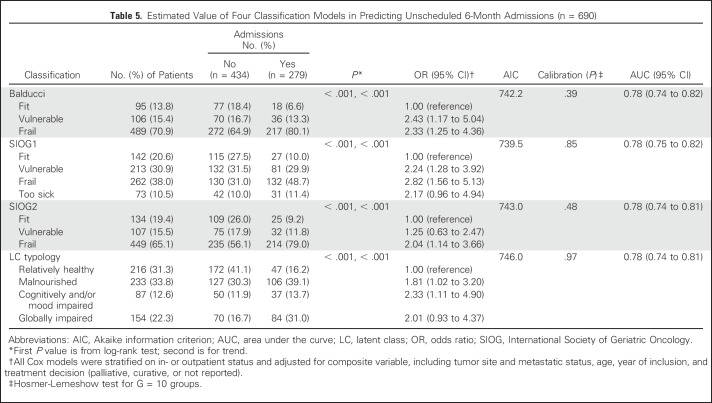
Univariable analysis showed significant associations linking each of the four classifications to overall 1-year mortality and to 6-month unscheduled admissions (all P < .001; Tables 4 and 5). Risks for death and admission increased steadily from the lowest to highest category with all classifications (trend P < .001).
Table 4.
Estimated Value of Four Classification Models in Predicting 1-Year Mortality (n = 754)
Table 5.
Estimated Value of Four Classification Models in Predicting Unscheduled 6-Month Admissions (n = 690)
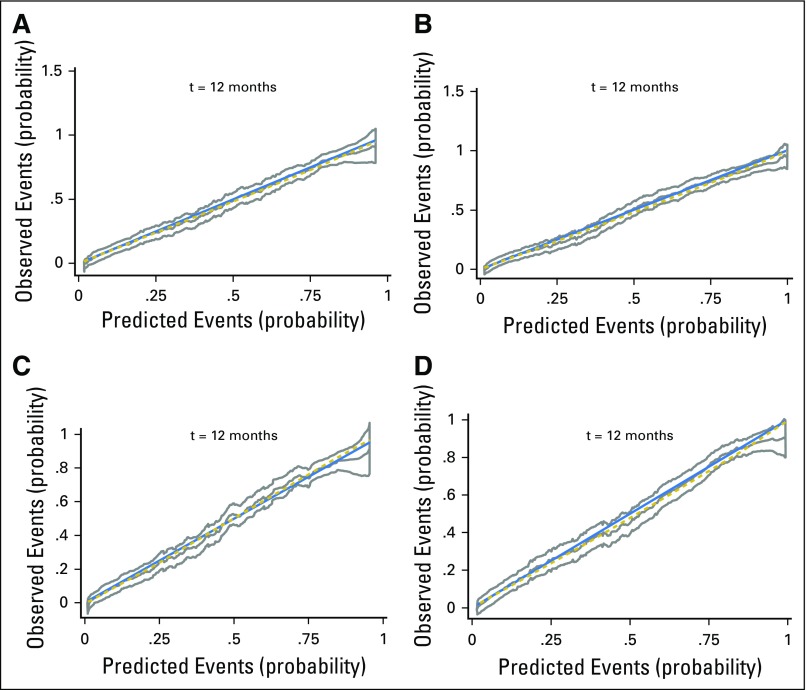
Vulnerable and frail or frail/too-sick patients according to Balducci or SIOG1 or SIOG2 had a higher 1-year mortality rate compared with fit patients (Table 4). Similarly, with LCT, 1-year mortality was higher in the LC2 (malnourished), LC3 (cognitively and/or mood impaired), and LC4 (globally impaired) categories. All four multivariable models showed good calibration (all P > .20; Table 4; Appendix Fig A1, online only) and good discrimination (C-index ≥ 0.70). Discrimination and calibration were best with SIOG1, followed by LCT.
The risk of 6-month unscheduled admissions was higher in the vulnerable, frail, and frail/too-sick categories according to Balducci or SIOG1 and in the LC2, LC3, and LC4 categories (Table 5), compared with fit patients. With SIOG2, only frail patients were at higher risk for this outcome. All four multivariable models had good calibration (all P > .20) and discrimination (C-index ≥ 0.70). Discrimination was similar for the four models.
Subgroup Analyses
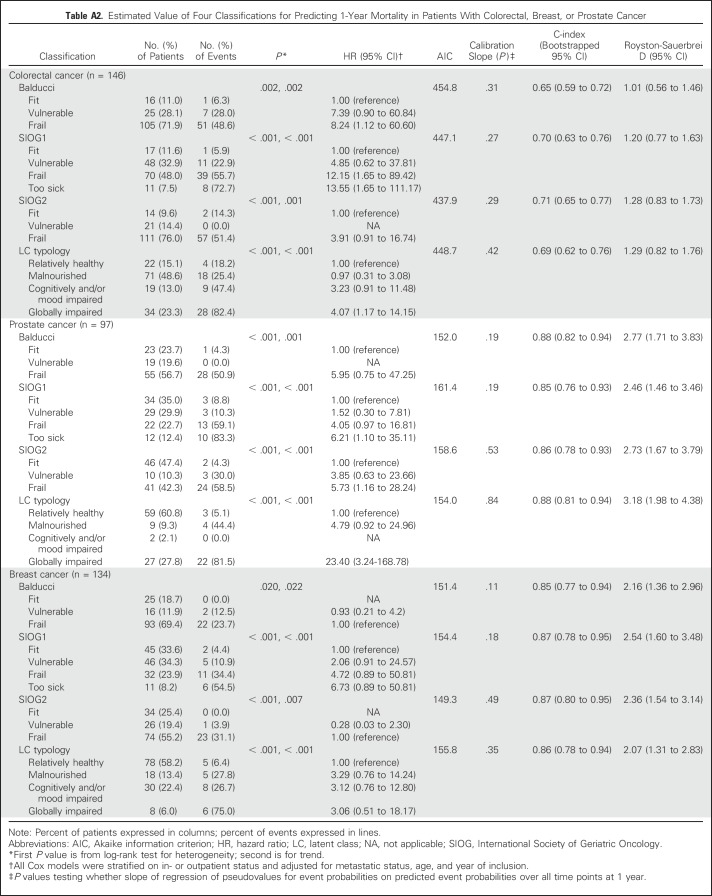
Discrimination indices varied according to tumor site (Appendix Tables A2 and A3, online only). For 1-year overall mortality, discrimination was moderate to good in patients with colorectal cancer and very good in those with breast or prostate cancer, with all four classifications. SIOG1 and SIOG2 performed best in patients with colorectal or breast cancer, whereas performance indices were slightly better for LCT in patients with prostate cancer.
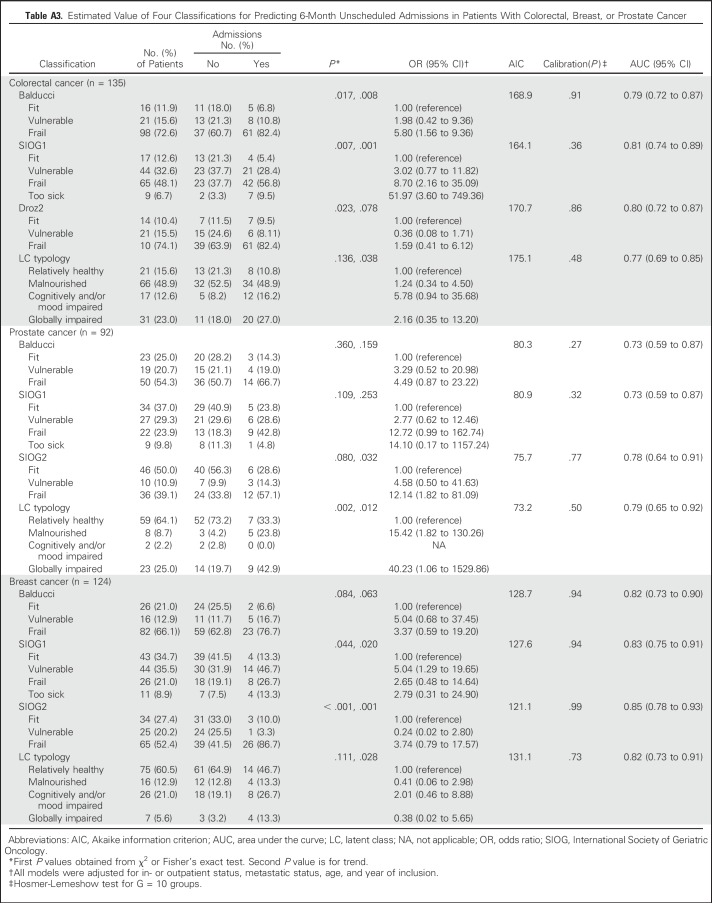
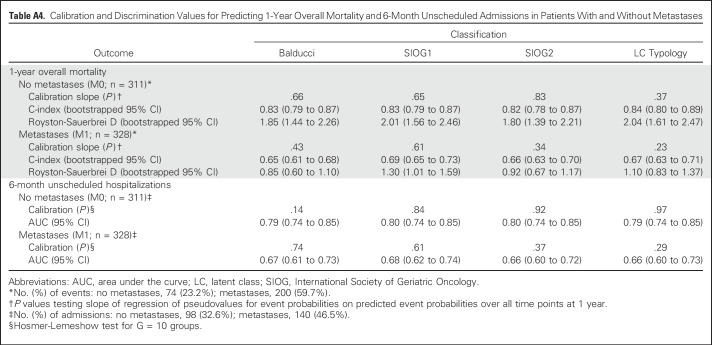
For admissions, discrimination was good in patients with colorectal or prostate cancer and very good in those with breast cancer, with all four classifications. SIOG1 and SIOG2 performed best in patients with colorectal or breast cancer, whereas LCT and SIOG2 had slightly better performance indices in patients with prostate cancer. All models displayed good calibration. Discrimination was very good for mortality (C-index = 0.82 to 0.84) and good for hospitalizations (C-index = 0.79 to 0.80) in patients without metastases but only moderate for both outcomes (C-index = 0.65 to 0.69) in patients with metastases (Appendix Table A4, online only).
DISCUSSION
The four frailty classifications performed well in predicting 1-year mortality, with slightly better performance for SIOG1, followed by LCT. Performance in predicting 6-month unscheduled admissions was similar for the four classifications. However, agreement among the four classifications was poor to moderate.
Performance of the classifications varied across tumor sites. For predicting mortality, discrimination was very good for prostate and breast cancers and lower for colorectal cancer. For predicting unscheduled admissions, discrimination was very good in patients with breast cancer. None of the four classifications performed best for all three tumor sites.
To our knowledge, no previous study has compared the prognostic performance of these four frailty classifications in geriatric oncology patients. In keeping with our findings, previous studies have reported that older patients with various types of cancer were at higher risk of death if they were categorized as unfit or frail using Balducci.9-11 Among patients categorized as fit by SIOG1, SIOG2, and LCT, 40% to 50% were classified as frail by Balducci. This discrepancy is probably ascribable to differences in the GA components used to define frailty (eg, malnutrition [not used in Balducci] and older age [used only in Balducci and LCT]). The Balducci classification may tend to overdiagnose frailty, because the risk for mortality seems lower in frail patients using Balducci (51%) than in frail patients according to the three other classifications (55% to 81%).
Although the four classifications showed limited agreement overall, they performed well in predicting both study outcomes, with SIOG1 and LCT performing best. This finding may be explained by the good prognostic value of the GA parameters used. SIOG1 was developed for older men with prostate cancer but performed well in our overall population and in our subgroups, especially those with breast or prostate cancer, suggesting that the GA components used in this classification may predict poor outcomes for many tumor sites.7 In keeping with this possibility, several studies have shown that malnutrition, Activities of Daily Living, Instrumental Activities of Daily Living, and comorbidities are associated with death in older patients with cancer.20,30,31 Because malnutrition has a strong prognostic value in older patients with cancer, its absence from the Balducci classification may explain the slightly lower performance of this tool in predicting 1-year mortality. Reported benefits of nutritional intervention include better treatment response and fewer chemotherapy adverse effects.31,32
As compared with SIOG1, SIOG2 involves two steps (patients with a G8 score > 14 are considered fit and not evaluated further) and no longer includes a too-sick category.8 We found that these changes failed to significantly improve prognostic performance. However, because the GA is time consuming and not available everywhere, SIOG2 may be useful in busy practices. The slightly better discrimination of SIOG1, which does not include chronologic age, suggests that this parameter may have no place in the core set. Finally, the comparison between the four classifications suggests that the optimal set of GA components may include at least disability, number of severe comorbidities, and malnutrition.
Discrimination varied with tumor site and metastatic status. Discrimination was poorer in groups with a worse prognosis (ie, those with colorectal cancer; 1-year mortality, 40% v 30% and 18% in prostate and breast cancers, respectively) and metastatic disease (60% v 23% in nonmetastatic disease). Poorer discrimination in colorectal cancer has also been reported with the G8.33-35 Prognostic performance is known to vary with patient characteristics and outcomes.36,37 However, there is no obvious explanation for the consistently poorer discrimination among patients with a worse prognosis. Conceivably, specific frailty factors associated with prognosis may be missing, and/or cutoffs of GA parameters or frailty may require adjustment according to tumor site and stage. For example, severity of malnutrition is probably more relevant in colorectal cancer than presence or absence of malnutrition. Also, the prognostic performance of GA parameters may be better for tumors associated with relatively long life expectancies, leading to better discrimination compared with tumors of higher lethality.36,38
Our findings suggest these four classifications developed by expert consensus (SIOG1, SIOG2, and Balducci) or statistical modeling (LCT) provide prognostic information useful in guiding treatment decisions, stratifying patients in clinical trials, and detecting impairments amenable to intervention. However, decisions should also take into account physician and patient preferences and risk of toxicities. Cancer treatment decision rules based on the Balducci and SIOG classifications have been suggested. However, the discrepancies and performance variability across classifications indicate a need for better characterization of frailty according to tumor site and disease stage. GA parameters assessing malnutrition severity and mobility, if possible with their change over time, may deserve to be added.39,40 The final step would consist in randomized trials to assess the impact of classifications on decision making and patient outcomes such as mortality and toxicities.37,38
The diversity of our patient population reflects everyday practice and supports the general applicability of our findings. The assessment of GA domains using validated scales indicates that our results are probably applicable to other health care institutions. We adjusted the main analyses for confounders including the final treatment decision, which may have affected the two study outcomes. Our analyses in the three subgroups of patients with the most common cancers strengthen the external validity of our findings.
Regarding limitations, the absence of three of the geriatric syndromes described in the Balducci classification and the use of substitutes for other unavailable variables may have resulted in classification bias. However, the substitutes were similar to the original variables. Finally, data on toxicities were not available.
In conclusion, despite poor to moderate agreement among the four frailty classifications of older patients with cancer (Balducci, SIOG1, SIOG2, and LCT), performance in predicting 1-year overall mortality and 6-month unscheduled admissions was consistently good when evaluated in a large cohort of in- and outpatients with untreated cancer at various sites. The observed variations in agreement and performance across tumor sites suggest means of optimizing performance and better characterizing frailty. Studies of clinical impact are needed to determine whether classifications deserve to be integrated into the cancer treatment decision-making process.
ACKNOWLEDGMENT
We thank Antoinette Wolfe for editing the manuscript.
Appendix
The ELCAPA (Elderly Cancer Patients) Study Group is composed of three geriatricians (P. Caillet, M. Laurent, and E. Paillaud), one oncologist (Ch. Tournigand), one radiation oncologist (J.-L. Lagrange), three epidemiologists (F. Canouï-Poitrine, S. Bastuji-Garin, and E. Audureau), one pharmacist (P.A. Natella), one biostatistician (L. Segaux), one clinical research medical physician (N. Reinald), and two clinical research assistants (R. Ibrahim and E. Jan).
Table A1.
Patient Demographic and Clinical Characteristics (N = 763)
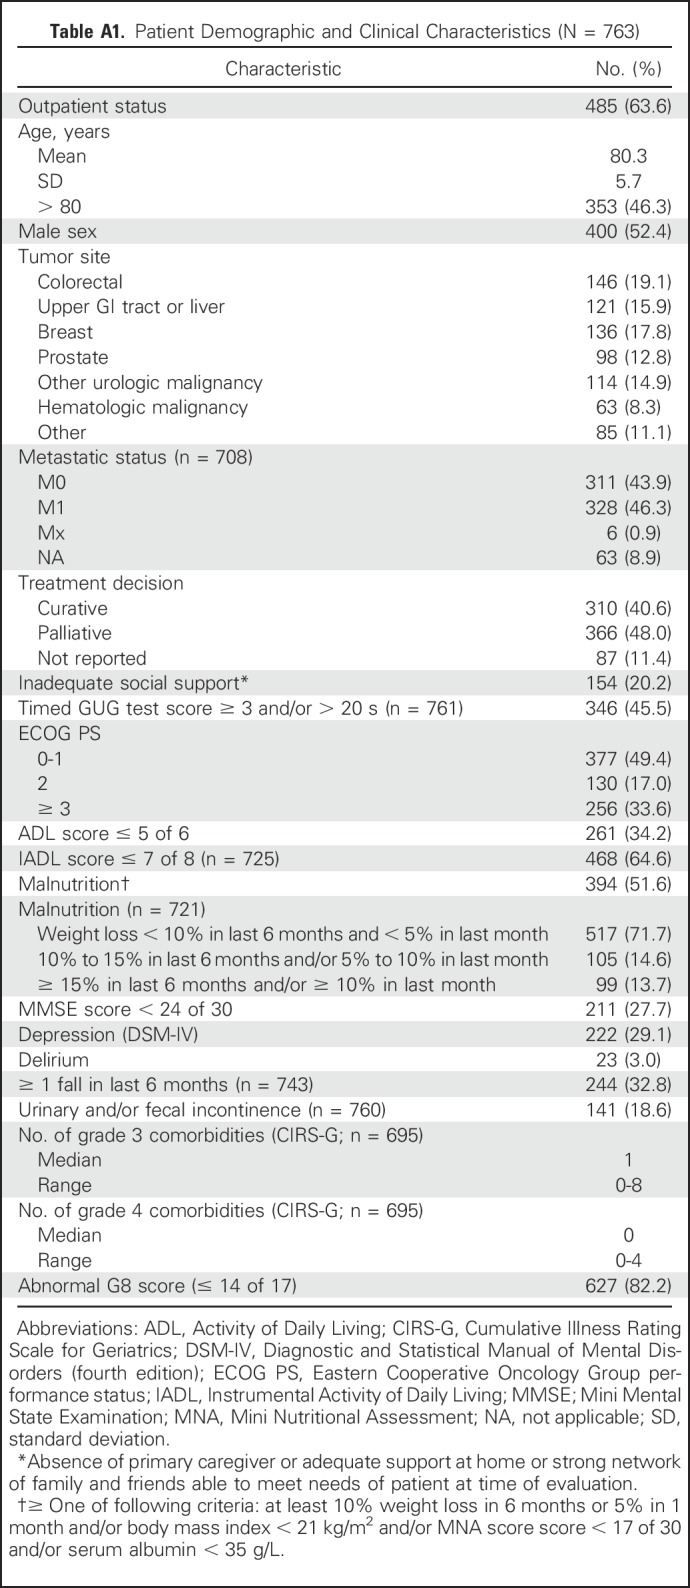
Table A2.
Estimated Value of Four Classifications for Predicting 1-Year Mortality in Patients With Colorectal, Breast, or Prostate Cancer
Table A3.
Estimated Value of Four Classifications for Predicting 6-Month Unscheduled Admissions in Patients With Colorectal, Breast, or Prostate Cancer
Table A4.
Calibration and Discrimination Values for Predicting 1-Year Overall Mortality and 6-Month Unscheduled Admissions in Patients With and Without Metastases
Fig A1.
Calibration curves with their 95% CIs and tests of slope of the four classification models used to predict 1-year overall mortality in overall population: (A) Balducci, (B) SIOG1 (C) SIOG2, and (D) latent class typology.
Footnotes
Written on behalf of the Elderly Cancer Patients (ELCAPA) Study Group.
Supported by a grant from the Institut National du Cancer and Canceropôle Ile-de-France.
The Institut National du Cancer and Canceropôle Ile-de-France had no role in the design or conduct of the study; collection, management, analysis, or interpretation of the data; preparation, review, or approval of the manuscript; or decision to submit the manuscript for publication.
AUTHOR CONTRIBUTIONS
Conception and design: Emilie Ferrat, Elena Paillaud, Philippe Caillet, Etienne Audureau, Florence Canouï-Poitrine, Sylvie Bastuji-Garin
Provision of study materials or patients: Philippe Caillet, Marie Laurent, Christophe Tournigand
Collection and assembly of data: Emilie Ferrat, Philippe Caillet, Marie Laurent, Christophe Tournigand
Data analysis and interpretation: Emilie Ferrat, Elena Paillaud, Philippe Caillet, Christophe Tournigand, Jean-Léon Lagrange, Jean-Pierre Droz, Lodovico Balducci, Etienne Audureau, Florence Canouï-Poitrine, Sylvie Bastuji-Garin
Manuscript writing: All authors
Final approval of manuscript: All authors
Accountable for all aspects of the work: All authors
AUTHORS' DISCLOSURES OF POTENTIAL CONFLICTS OF INTEREST
Performance of Four Frailty Classifications in Older Patients With Cancer: Prospective Elderly Cancer Patients Cohort Study
The following represents disclosure information provided by authors of this manuscript. All relationships are considered compensated. Relationships are self-held unless noted. I = Immediate Family Member, Inst = My Institution. Relationships may not relate to the subject matter of this manuscript. For more information about ASCO’s conflict of interest policy, please refer to www.asco.org/rwc or ascopubs.org/jco/site/ifc.
Emilie Ferrat
No relationship to disclose
Elena Paillaud
No relationship to disclose
Philippe Caillet
No relationship to disclose
Marie Laurent
No relationship to disclose
Christophe Tournigand
Honoraria: Roche, Eli Lilly, Bayer HealthCare Pharmaceuticals
Research Funding: Roche
Jean-Léon Lagrange
Honoraria: Takeda Pharmaceuticals
Travel, Accommodations, Expenses: Takeda Pharmaceuticals
Jean-Pierre Droz
Honoraria: Sanofi
Consulting or Advisory Role: Sanofi
Travel, Accommodations, Expenses: Sanofi
Lodovico Balducci
Honoraria: Amgen
Consulting or Advisory Role: TEVA Pharmaceuticals Industries
Speakers’ Bureau: Amgen, Johnson & Johnson, Astellas Pharma, TEVA Pharmaceuticals Industries
Etienne Audureau
No relationship to disclose
Florence Canouï-Poitrine
No relationship to disclose
Sylvie Bastuji-Garin
No relationship to disclose
REFERENCES
- 1.Stewart BW, Wild CP, editors. World Cancer Report 2014. Lyon, France: International Agency for Research on Cancer; 2014. [Google Scholar]
- 2.Binder-Foucard F, Bossard N, Delafosse P, et al. Cancer incidence and mortality in France over the 1980-2012 period: Solid tumors. Rev Epidemiol Sante Publique. 2014;62:95–108. doi: 10.1016/j.respe.2013.11.073. [DOI] [PubMed] [Google Scholar]
- 3.Hurria A, Dale W, Mooney M, et al. Designing therapeutic clinical trials for older and frail adults with cancer: U13 conference recommendations. J Clin Oncol. 2014;32:2587–2594. doi: 10.1200/JCO.2013.55.0418. [DOI] [PMC free article] [PubMed] [Google Scholar]
- 4.Wildiers H, Heeren P, Puts M, et al. International Society of Geriatric Oncology consensus on geriatric assessment in older patients with cancer. J Clin Oncol. 2014;32:2595–2603. doi: 10.1200/JCO.2013.54.8347. [DOI] [PMC free article] [PubMed] [Google Scholar]
- 5.Balducci L, Beghe C. The application of the principles of geriatrics to the management of the older person with cancer. Crit Rev Oncol Hematol. 2000;35:147–154. doi: 10.1016/s1040-8428(00)00089-5. [DOI] [PubMed] [Google Scholar]
- 6.Balducci L, Extermann M. Management of cancer in the older person: A practical approach. Oncologist. 2000;5:224–237. doi: 10.1634/theoncologist.5-3-224. [DOI] [PubMed] [Google Scholar]
- 7.Droz JP, Balducci L, Bolla M, et al. Management of prostate cancer in older men: Recommendations of a working group of the International Society of Geriatric Oncology. BJU Int. 2010;106:462–469. doi: 10.1111/j.1464-410X.2010.09334.x. [DOI] [PMC free article] [PubMed] [Google Scholar]
- 8.Droz JP, Aapro M, Balducci L, et al. Management of prostate cancer in older patients: Updated recommendations of a working group of the International Society of Geriatric Oncology. Lancet Oncol. 2014;15:e404–e414. doi: 10.1016/S1470-2045(14)70018-X. [DOI] [PubMed] [Google Scholar]
- 9.Basso U, Tonti S, Bassi C, et al. Management of frail and not-frail elderly cancer patients in a hospital-based geriatric oncology program. Crit Rev Oncol Hematol. 2008;66:163–170. doi: 10.1016/j.critrevonc.2007.12.006. [DOI] [PubMed] [Google Scholar]
- 10.Tucci A, Ferrari S, Bottelli C, et al. A comprehensive geriatric assessment is more effective than clinical judgment to identify elderly diffuse large cell lymphoma patients who benefit from aggressive therapy. Cancer. 2009;115:4547–4553. doi: 10.1002/cncr.24490. [DOI] [PubMed] [Google Scholar]
- 11.Ommundsen N, Wyller TB, Nesbakken A, et al. Frailty is an independent predictor of survival in older patients with colorectal cancer. Oncologist. 2014;19:1268–1275. doi: 10.1634/theoncologist.2014-0237. [DOI] [PMC free article] [PubMed] [Google Scholar]
- 12.Ferrat E, Audureau E, Paillaud E, et al. Four distinct health profiles in older patients with cancer: Latent class analysis of the prospective ELCAPA cohort. J Gerontol A Biol Sci Med Sci. 2016;71:1653–1660. doi: 10.1093/gerona/glw052. [DOI] [PMC free article] [PubMed] [Google Scholar]
- 13.Caillet P, Canoui-Poitrine F, Vouriot J, et al. Comprehensive geriatric assessment in the decision-making process in elderly patients with cancer: ELCAPA study. J Clin Oncol. 2011;29:3636–3642. doi: 10.1200/JCO.2010.31.0664. [DOI] [PubMed] [Google Scholar]
- 14.Katz S, Ford AB, Moskowitz RW, et al. Studies of illness in the aged: The index of ADL—A standardized measure of biological and psychosocial function. JAMA. 1963;185:914–919. doi: 10.1001/jama.1963.03060120024016. [DOI] [PubMed] [Google Scholar]
- 15.Folstein MF, Folstein SE, McHugh PR. “Mini-mental state”: A practical method for grading the cognitive state of patients for the clinician. J Psychiatr Res. 1975;12:189–198. doi: 10.1016/0022-3956(75)90026-6. [DOI] [PubMed] [Google Scholar]
- 16.Haute Autorité de Santé Nutritional Support Strategy for Protein-Energy Malnutrition in the Elderly. http://www.has-sante.fr/portail/upload/docs/application/pdf/malnutrition_elderly_guidelines.pdf
- 17.American Psychiatric Association . Diagnostic and Statistical Manual of Mental Disorders. ed 4. Washington, DC: American Psychiatric Association; 1994. [Google Scholar]
- 18.Miller MD, Towers A. A Manual of Guidelines for Scoring the Cumulative Illness Rating Scale for Geriatrics (CIRS-G) Pittsburgh, PA: University of Pittsburgh; 1991. [Google Scholar]
- 19.Lawton MP, Brody EM. Assessment of older people: Self-maintaining and instrumental activities of daily living. Gerontologist. 1969;9:179–186. [PubMed] [Google Scholar]
- 20.Ferrat E, Paillaud E, Laurent M, et al. Predictors of 1-year mortality in a prospective cohort of elderly patients with cancer. J Gerontol A Biol Sci Med Sci. 2015;70:1148–1155. doi: 10.1093/gerona/glv025. [DOI] [PubMed] [Google Scholar]
- 21.Trikalinos AT, Balion CM.Chapter 9 Options for summarizing medical test performance in the absence of a “gold standard”in Chang SM, Matchar DB, Smetana GW, et al.(eds)Methods Guide for Medical Test Reviews Rockville, MD: Agency for Healthcare Research and Quality; 2012 [PubMed] [Google Scholar]
- 22.Cohen J. A coefficient of agreement for nominal scales. Educ Psychol Meas. 1960;20:27–46. www.garfield.library.upenn.edu/classics1986/A1986AXF2600001.pdf [Google Scholar]
- 23.Grambsch PM, Therneau TM. Proportional hazards tests and diagnostics based on weighted residuals. Biometrika. 1994;81:515–526. www.ics.uci.edu/∼staceyah/112-203/Grambsch_Therneau-Biometrika-1994.pdf [Google Scholar]
- 24.Royston P, Altman DG. External validation of a Cox prognostic model: Principles and methods. BMC Med Res Methodol. 2013;13:33. doi: 10.1186/1471-2288-13-33. [DOI] [PMC free article] [PubMed] [Google Scholar]
- 25.Royston P, Sauerbrei W. A new measure of prognostic separation in survival data. Stat Med. 2004;23:723–748. doi: 10.1002/sim.1621. [DOI] [PubMed] [Google Scholar]
- 26.Yourman LC, Lee SJ, Schonberg MA, et al. Prognostic indices for older adults: A systematic review. JAMA. 2012;307:182–192. doi: 10.1001/jama.2011.1966. [DOI] [PMC free article] [PubMed] [Google Scholar]
- 27.Hosmer DW, Lemeshow S. Applied Logistic Regression. New York, NY: John Wiley and Sons; 1989. [Google Scholar]
- 28.Hanley JA, McNeil BJ. The meaning and use of the area under a receiver operating characteristic (ROC) curve. Radiology. 1982;143:29–36. doi: 10.1148/radiology.143.1.7063747. [DOI] [PubMed] [Google Scholar]
- 29.Bozdogan H. Model selection and Akaike’s information criterion (AIC): The general theory and its analytical extensions. Psychometrika. 1987;52:345–370. http://link.springer.com/article/10.1007/BF02294361 [Google Scholar]
- 30.Puts MT, Hardt J, Monette J, et al. Use of geriatric assessment for older adults in the oncology setting: A systematic review. J Natl Cancer Inst. 2012;104:1133–1163. doi: 10.1093/jnci/djs285. [DOI] [PMC free article] [PubMed] [Google Scholar]
- 31.Extermann M, Hurria A. Comprehensive geriatric assessment for older patients with cancer. J Clin Oncol. 2007;25:1824–1831. doi: 10.1200/JCO.2007.10.6559. [DOI] [PubMed] [Google Scholar]
- 32.Blanc-Bisson C, Fonck M, Rainfray M, et al. Undernutrition in elderly patients with cancer: Target for diagnosis and intervention. Crit Rev Oncol Hematol. 2008;67:243–254. doi: 10.1016/j.critrevonc.2008.04.005. [DOI] [PubMed] [Google Scholar]
- 33.Hamaker ME, Jonker JM, de Rooij SE, et al. Frailty screening methods for predicting outcome of a comprehensive geriatric assessment in elderly patients with cancer: A systematic review. Lancet Oncol. 2012;13:e437–e444. doi: 10.1016/S1470-2045(12)70259-0. [DOI] [PubMed] [Google Scholar]
- 34.Liuu E, Canouï-Poitrine F, Tournigand C, et al. Accuracy of the G-8 geriatric-oncology screening tool for identifying vulnerable elderly patients with cancer according to tumour site: The ELCAPA-02 study. J Geriatr Oncol. 2014;5:11–19. doi: 10.1016/j.jgo.2013.08.003. [DOI] [PubMed] [Google Scholar]
- 35.Martinez-Tapia C, Canoui-Poitrine F, Bastuji-Garin S, et al. Optimizing the G8 screening tool for older patients with cancer: Diagnostic performance and validation of a six-item version. Oncologist. 2016;21:188–195. doi: 10.1634/theoncologist.2015-0326. [DOI] [PMC free article] [PubMed] [Google Scholar]
- 36.Bamias A, Tzannis K, Beuselinck B, et al. Development and validation of a prognostic model in patients with metastatic renal cell carcinoma treated with sunitinib: A European collaboration. Br J Cancer. 2013;109:332–341. doi: 10.1038/bjc.2013.341. [DOI] [PMC free article] [PubMed] [Google Scholar]
- 37.Moons KG, Altman DG, Vergouwe Y, et al. Prognosis and prognostic research: application and impact of prognostic models in clinical practice. BMJ. 2009;338:b606. doi: 10.1136/bmj.b606. [DOI] [PubMed] [Google Scholar]
- 38.Corre R, Greillier L, Le Caër H, et al. Use of a comprehensive geriatric assessment for the management of elderly patients with advanced non–small-cell lung cancer: The phase III randomized ESOGIA-GFPC-GECP 08-02 study. J Clin Oncol. 2016;34:1476–1483. doi: 10.1200/JCO.2015.63.5839. [DOI] [PubMed] [Google Scholar]
- 39.Pamoukdjian F, Lévy V, Sebbane G, et al. Slow gait speed is an independent predictor of early death in older cancer outpatients: Results from a prospective cohort study J Nutr Health Aging 2016. DOI:10.1007/s12603-016-0734-x [DOI] [PubMed] [Google Scholar]
- 40.Soubeyran P, Fonck M, Blanc-Bisson C, et al. Predictors of early death risk in older patients treated with first-line chemotherapy for cancer. J Clin Oncol. 2012;30:1829–1834. doi: 10.1200/JCO.2011.35.7442. [DOI] [PubMed] [Google Scholar]


