

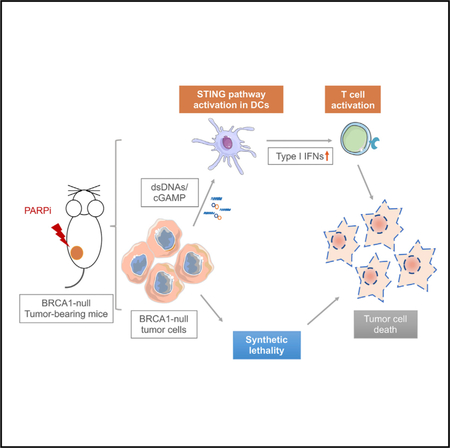
SUMMARY
PARP inhibitors have shown promising clinical activities for patients with BRCA mutations and are changing the landscape of ovarian cancer treatment. However, the therapeutic mechanisms of action for PARP inhibition in the interaction of tumors with the tumor microenvironment and the host immune system remain unclear. We find that PARP inhibition by olaparib triggers robust local and systemic antitumor immunity involving both adaptive and innate immune responses through a STING-dependent antitumor immune response in mice bearing Brca1-deficient ovarian tumors. This effect is further augmented when olaparib is combined with PD-1 blockade. Our findings thus provide a molecular mechanism underlying antitumor activity by PARP inhibition and lay a foundation to improve therapeutic outcome for cancer patients.
In Brief
Ding et al. show that PARP inhibition in Brca1-deficient tumors elicits strong antitumor immunity involving activation of both innate and adaptive immune responses, a process that is dependent on STING pathway activation. In addition, they show that addition of PD-1 blockade augments the therapeutic efficacy of PARP inhibitor treatment.
Graphical Abstract
INTRODUCTION
Targeted therapy based on inhibiting DNA damage repair offers potential therapeutic approaches for patients with tumors lacking fully competent DNA damage response functions. Among the variety of types of DNA damage, the most deleterious is DNA double-strand breaks (DSBs). DSBs can be repaired via either homologous recombination (HR) or non-homologous end joining (NHEJ). The key components of HR, the tumor suppressor genes BRCA1 and BRCA2, are frequently mutated in breast and ovarian cancers. The resulting BRCA-deficient cells rely on poly(ADP-ribose) polymerase (PARP)-mediated DNA repair for survival and are thus sensitive to PARP inhibition (Foulkes and Shuen, 2013). On the basis of this concept of synthetic lethality between PARP inhibition and BRCA1 or BRCA2 mutation seen in tumor cells (Bryant et al., 2005; Farmer et al., 2005), therapies based on PARP inhibitors have been tested clinically and approved for the treatment of breast cancer and ovarian cancer with BRCA mutations (Lord and Ashworth, 2017). However, the mechanisms underlying the therapeutic effects of PARP inhibitors in BRCA-deficient tumors in vivo have not been fully elucidated.
Recently, increasing evidence has suggested an important interaction between tumor DNA damage and the immune system during the treatment of cancers. Upon recognition of pathogenic or self-DNA, the cytosolic DNA sensor cyclic GMP-AMP (cGAMP) synthetase (cGAS) produces the second messenger cGAMP, which in turn activates stimulator of interferon genes (STING) signaling and subsequent production of type I interferons (IFNs) and pro-inflammatory cytokines (Ishikawa and Barber, 2008; Li and Chen, 2018). The cGAS-cGAMP-STING pathway plays a vital role not only in protecting the cell against a variety of pathogens but also in the antitumor immune responses in cancers (Barber, 2015; Li and Chen, 2018). Recent studies also reported that a STING-dependent cytosolic DNA sensing pathway mediates the efficacy of radiation therapy and chemotherapy (Deng et al., 2014; Parkes et al., 2016). Thus, it is important to investigate the role of PARP inhibition in the context of DNA damage and immune responses.
In this study, we demonstrate that PARP inhibition elicits an antitumor immune response in Brca1-deficient ovarian tumors by induction of both intratumoral and peripheral effector CD4+ and CD8+ T cells. Our study further reveals that antigen- presenting cells (APCs), such as dendritic cells (DCs), can sense double-stranded DNA (dsDNA) fragments and/or cGAMP derived from Brca1-deficient cells upon PARP inhibition and drive a STING-dependent type I IFN signal that mediates, in part, the therapeutic efficacy of PARP inhibition in Brca1-deficient tumors. Therefore, in addition to synthetic lethality, our study reveals a mechanism of therapeutic effect of PARP inhibition in Brca1-deficient tumors that is mediated by host immune responses.
RESULTS
Therapeutic Efficacy of Olaparib in Brca1-Deficient Ovarian Tumor Involves T Cell-Mediated Cytotoxicity, which Is Further Enhanced by the Addition of PD-1 Blockade
To explore the involvement of immune responses to PARP inhibition in HR-deficient cancer, we generated a pair of syngeneic genetically engineered mouse models (GEMMs) of high-grade serous ovarian cancer (HGSOC) in the FVB background driven via either concurrent loss of p53 and Brca1 and overexpression of c-Myc (termed PBM) or concurrent loss of p53 and Pten and overexpression of c-Myc (termed PPM) to reflect oncogenic events frequently found in human ovarian cancer (Cancer Genome Atlas Research Network, 2011) (Figures 1A, 1B, and S1A-S1C). Both PBM and PPM tumors display histological features resembling HGSOC in human tumors, characterized by nuclear atypia and pleomorphism (Vang et al., 2009) (Figures 1B and S1B). PBM tumor cells expressing luciferase were engrafted into the ovarian bursa of a cohort of FVB female mice to monitor tumor growth and immunological events upon olaparib treatment in a physiological tissue environment. Treatment of PBM tumor-bearing mice with olaparib significantly delayed tumor progression compared with mice in the control group (Figure S1D). We performed gene set enrichment analysis (GSEA) of a panel of 4,604 cancer- and immune-related genes in PBM tumor tissues harvested from tumor-bearing mice after 18 days of treatment with olaparib or vehicle. Strikingly, GSEA showed markedly upregulated expression of genes associated with immune response, T cell activation, and IFN-γ response in tumors treated with olaparib compared with vehicle (Figure 1C). To determine whether these immune responses play a role in the antitumor activity of olaparib in PBM in vivo, we engrafted Rag1−/− (FVB background) and wild-type FVB mice with PBM tumors and treated tumor-bearing mice with olaparib. The results showed that the therapeutic effect of olaparib is partially abrogated (Figure 1D), suggesting that the adaptive immune system is indeed participated in the antitumor activity of olaparib. We further used anti-CD8a antibody in the allograft model of PBM in wildtype FVB host mice to show that olaparib-induced tumor inhibition was significantly mitigated by CD8 neutralization (Figure 1E), suggesting that cytotoxic T cell-mediated cellular killing is important for the antitumor efficacy of olaparib.
Figure 1. Therapeutic Efficacy of Olaparib and PD-1 Blockade in a Brca1-Null GEMM of HGSOC.

(A) Genetic loss of Tp53 and Brca1 and amplification and overexpression of Myc co-occur in HGSOC in clinical samples (The Cancer Genome Atlas [TCGA] database).
(B) Generation of a Brca1-null genetically engineered mouse model (GEMM) of HGSOC (Trp53−/−,Brca1−/−,Myc; termed PBM). A representative H&E staining shows serous carcinoma nature of the PBM tumor. Scale bar, 25 μm.
(C) GSEA showing upregulated immune response and T cell activation in olaparib-treated PBM tumors. Nominal p < 0.001, false discovery rate q < 0.001.
(D) Orthotopically transplanted PBM tumors in Rag1−/− or wild-type (WT) mice treated with olaparib or vehicle control (WT, n = 6/group; Rag1−/−, n = 5/group).
(E) PBM tumor-bearing FVB mice were treated with olaparib with or without an anti-CD8 neutralizing antibody (n = 8 tumors per group).
(F) Experimental scheme (top) and representative bioluminescence imaging analysis of mice bearing orthotopic PBM tumor allografts (luciferized) treated with various agents as indicated after 21 days of treatment.
(G) Tumor burden of PBM tumor-bearing mice treated with indicated agents was measured by bioluminescence (number of analyzed mice is indicated in the brackets).
In (D), (E), and (G), tumor burden is quantified by the intensity of bioluminescence signal in the regions of interest (ROIs) determined at each imaging time point. Arrows indicate treatment start date. Data are represented as mean ± SEM. *p < 0.05, **p < 0.01, and ***p < 0.001.
Although olaparib is effective in treating Brca1-deficient tumors, PBM tumors treated with olaparib have increased expression of the immune-inhibitory ligand PD-L1 on tumor cells (Figures S1E and S1F), consistent with previous observations (Jiao et al., 2017). We therefore subjected cohorts of PBM- bearing mice to combination therapy with olaparib and PD-1 blockade. While PD-1 antibody alone had no effect on the growth of the PBM tumors, combination of olaparib and PD-1 antibody treatment resulted in sustained control of tumor growth (Figures 1F and 1G). Consistently, treatment with olaparib significantly prolonged the survival of PBM tumor-bearing mice and the survival was further extended by the addition of PD-1 blockade (Figure S1G). These data suggest that, while olaparib is effective in treating PBM tumors, activation of immune-inhibitory pathway(s) limits the effectiveness of PARP inhibition, which can be overcome by incorporating immune checkpoint blockade in the treatment regimen. Interestingly, however, all PBM-bearing mice treated with olaparib alone or in combination with PD-1 blockade eventually succumbed to the disease (Figure S1G). In contrast, in Brca-proficient PPM tumors, olaparib alone or in combination with PD-1 antibody treatment had little effect on the tumor progression (Figure S1H), suggesting that molecular mechanisms associated with Brca deficiency in the tumor dictate the response to this therapy. These results recapitulate the efficacy of PARP inhibition in the clinic for BRCA-deficient ovarian cancer (Ledermann, 2016; Lord and Ashworth, 2017) and indicate a benefit of the addition of immune checkpoint blockade to PARP inhibition. Our study also indicates that although multiple PARP inhibitors have been approved for the treatment of BRCA1-deficient ovarian cancers, eradication of this type of cancer remains a challenge.
Olaparib Provokes Robust Intratumoral and Systemic Immune Response in Brca1-Deficient Ovarian Tumors
The findings that an antitumor immune response is elicited by olaparib in Brca1-deficient tumors prompted us to assess tumor infiltrating immune cells in PBM-bearing mice upon treatment. Increased immune cell (CD45+) infiltration into the tumors was observed upon treatment with olaparib (Figure S2A). Further analysis revealed that olaparib alone not only significantly increased the number of intratumoral effector CD4+ and CD8+ T cells (Figures 2A and 2B) but also reduced expression of PD-1/Tim-3 and PD-1/Lag-3 co-inhibitory receptors on CD8+ T cells (Figures S2B and S2L). Increase of effector CD8+ T cells was also observed in the malignant ascites of the peritoneal cavity of PBM-bearing mice treated with olaparib (Figures S2C and S2L). The frequency of intratumoral FoxP3+ Tregs was not changed in mice treated with olaparib, PD-1 antibody, or the combination of these two agents (Figure S2D). Intratumoral CD4+ and CD8+ T cells have significantly increased IFNγ and TNFα production upon olaparib treatment (Figures 2C and2D), addition of PD-1 antibody led to further increased production of these cytokines in these CD8+ T cells (Figure 2D). The latter finding may explain the observation that combined treatment of olaparib and PD-1 antibody exerted a greater antitumor activity compared with olaparib single treatment. We next assessed the changes of intratumoral myeloid-derived cells as part of the tumor microenvironment in response to olaparib treatment in PBM-bearing mice. Analysis of DCs in the tumor microenvironment showed increased levels of CD80, CD86, and major histocompatibility complex (MHC) class II expression upon olaparib treatment (Figures 2E and S2M), indicating that these tumor- associated DCs have increased costimulatory and antigen-presenting machinery upon olaparib treatment. Moreover, CD103+ DCs, a subset of APCs known to be potent stimulators of effector T cell trafficking and priming of T cell immunity (Broz et al., 2014; Salmon et al., 2016), were increased at the tumor site upon olaparib treatment (Figure 2E). Olaparib treatment also reduced the population of CD11b+Ly6CloLy6Ghi cells (Figure S2E). These cells inhibited CD8+ T cells proliferation using a CellTrace Violet Cell Proliferation assay (Figure S2F), suggesting that they are granulocytic myeloid-derived suppressor cells (gMDSCs). Previous studies have shown gMDSCs were enriched in the microenvironment of ovarian tumor (Cubillos-Ruiz et al., 2010, 2015). In contrast, intratumoral immune responses were not found in PPM tumor-bearing mice upon olaparib alone or in combination with PD-1 blockade (Figures S2G-S2I). Together, these data suggest that olaparib treatment triggered a robust antitumor immunity in the PBM tumor microenvironment involving both adaptive and innate immune responses with activation of lymphoid and myeloid-derived cells.
Figure 2. Olaparib Elicits Intratumoral and Systemic Immune Responses in PBM Tumor-Bearing Mice.

(A) Flow cytometric analysis of intratumoral CD4+ and CD8+ T cell population in PBM tumors treated with indicated agents.
(B) Intratumoral CD4+ and CD8+ effector T cells (CD44highCD62Llow) in PBM tumors analyzed by flow cytometry.
(C and D) Flow cytometric analysis of effector cytokine production of intratumoral CD4+ (C) and CD8+ (D) T cell in PBM tumors treated with indicated agents.
(E) Flow cytometric analysis of cell surface markers (CD80, CD86, MHCII, CD103) of intratumoral CD11c+ DCs in PBM tumors.
(F and G) Flow cytometric analysis of blood samples from PBM tumor-bearing mice treated indicated agents.
(F) Analysis of monocytic MDSCs (mMDSCs) and granulocytic MDSCs (gMDSCs).
(G) Analysis of TNFα and interferon (IFN)γ production CD8+ T cells.
Data are represented as mean ± SD. Each dot represents data obtained from one mouse. *p < 0.05, **p < 0.01, and ***p < 0.001.
We next investigated the systemic immune response upon treatment with olaparib and its combination with PD-1 blockade in PBM tumor-bearing mice. Analysis of myeloid-derived suppressor cells (MDSCs) in the peripheral blood showed that both gMDSCs and monocytic MDSCs (mMDSCs) decreased after olaparib and/or PD-1 antibody treatment (Figure 2F). In addition, CD8+T cells in the blood have increased production of IFNγ and TNFα in PBM tumor-bearing mice treated with olaparib (Figure 2G). Olaparib treatment also resulted in an increase of CD8+ T cells along with a decreased expression of PD-1, Tim-3, and Lag-3 co-inhibitory receptors on CD8+ T cells in the spleens of PBM-bearing mice (Figures S2J and S2K). Interestingly, although PD-1 antibody treatment did not change the number of CD8+ T cells, it significantly reduced the expression of PD-1, Tim-3, and Lag-3 co-inhibitory receptors on CD8+ T cells in the spleens of these mice (Figures S2J and S2K). Together, these data indicate that olaparib elicits both strong intratumoral and systemic immune responses in mice bearing Brca1-deficient tumors.
Olaparib-Treated Brca1-Deficient Tumor Cells Activate the STING Pathway in DCs in a Co-culture System
It has been reported that PARP inhibition induces cell-cycle arrest in S/G2, and proliferation inhibition with accumulation of mitotic chromosome bridges and micronuclei formation (Maya- Mendoza et al., 2018). Recent studies have also reported dsDNA breakage and micronuclei formation after radiotherapy and chemotherapies leading to cGAS-STING signaling pathway-dependent inflammatory responses in tumors (Harding et al., 2017; Mackenzie et al., 2017). We therefore assessed the cytosolic dsDNAs and micronuclei in tumor cells upon olaparib treatment. As expected, PBM cells, but not PPM cells, have increased cytosolic dsDNAs and micronuclei upon olaparib treatment (Figures 3A, S3A, and S3B).
Figure 3. Olaparib-Treated Brca1-Deficient Tumor Cells Trigger STING Pathway Activation in DCs in a Co-culture system.

(A) Staining of cytosolic double-strand DNA (dsDNA) in PBM tumor cells treated with DMSO or olaparib (2.5 μM, 24 hr). Scale bar, 25 μm. Quantification data are presented as mean ± SEM of three independent experiments (n = 10–14 fields, ≥400 cells counted per condition).
(B) Illustration of a co-culture system with BMDCs and olaparib-treated cells.
(C) Flow cytometric analysis of STING pathway activation (p-TBK1+p-IRF3+) in BMDCs co-cultured with olaparib-treated PBM tumor cells, in the presence or absence of a STING inhibitor BX795.
(D) RT-qPCR analysis of IFN-β and CXCL10 expression in BMDCs collected from BMDC/PBM co-culture.
(E) Analysis of IFN-β level in the BMDC/PBM co-culture media by ELISA.
(F and G) Human DCs co-cultured with olaparib-treated human ovarian cancer cell lines UWB1.289 and UWB1.289+BRCA1. (F) Flow cytometric analysis of phosphorylated TBK1 and IRF3 and (G) RT-qPCR analysis of IFN-β expression in human DCs from co-culture.
(H and I) WT and STING−/− BMDCs co-cultured with WT or Brca1-null ID8 tumor cells pretreated with DMSO or olaparib. (H) Flow cytometric analysis of p-TBK1+p-IRF3+ and (I) RT-qPCR analysis of IFN-β expression level in DCs from co-culture with ID8 cells.
Data are represented as mean ± SD; n = 3. *p < 0.05, **p < 0.01, and ***p < 0.001.
Similar to numerous tumor cells with defective STING signaling as reported previously (Xia et al., 2016a, 2016b), our PBM and PPM tumor cells also have low baseline cGAS or STING expression and have little STING signaling activity upon olaparib treatment (Figure S3C). Mouse bone marrow-derived DCs (BMDCs) have much higher levels of baseline cGAS and STING and activation of the STING signaling when treated with the STING agonist DMXAA (5,6-dimethylxanthenone-4-acetic acid) (Prantner et al., 2012) (Figure S3C). DMXAA induced a strong IFN-β production from BMDCs in culture, which was abolished by addition of BX795, an aminopyrimidine that inhibits TBK1/IKKε, and hence inhibits the STING-dependent signaling pathway (Kim et al., 2013) (Figure S3D). We therefore performed co-culture of olaparib-treated tumor cells with BMDCs to investigate whether tumor-derived dsDNA can activate the STING signaling in DCs (Figure 3B). Our results show that BMDCs, when co-cultured with olaparib-treated PBM cells, have markedly increased expression of IFN-β and CXCL10 as well as increased phosphorylation of TBK1 and IRF3 (p-TBK1+p-IRF3+) compared with BMDCs co-cultured with PBM cells treated with DMSO control (Figures 3B–3E and S3K). These effects were abrogated by addition of a TBK1 inhibitor BX795 to the culture (Figures 3B–3E). However, this STING pathway-dependent activation of BMDCs was not observed in the co-culture of BMDCs with PPM tumor cells treated with olaparib (Figure S3E). Increased levels of p-TBK1+p-IRF3+ and IFN-β were also detected in human DCs co-cultured with BRCA1-deficient human ovarian cancer cells UWB1.289, but not with BRCA1-proficient UWB1.289 cells reexpressing BRCA1, upon olaparib treatment (Figures 3F, 3G and S3L). Furthermore, we found that olaparib treatment at 2.5 μM for 24 hr did not induce substantial cell death in PBM cells, and the addition of apoptosis inhibitor zVAD had little effect on the activation of DCs co-cultured with PBM tumor cells treated with olaparib (Figure S3F), suggesting that dsDNAs and/or cGAMP produced from viable Brca1-null cells treated with olaparib can activate the STING pathway in DCs.
To further demonstrate the importance of STING signaling in DCs for olaparib-induced immune response in Brca1-null tumors, we used STING-knockout (KO) mice (Stinggt/gt, C57BL/6J) and confirmed that their BMDCs have defective STING function (Figure S3G). Wealso used ID8 cell line, a murine ovarian cancer model in the C57BL/6J background. Because ID8 cells have wild-type Brca1, we generated a Brca1-null ID8 line using CRISPR/Cas9. Increased p-TBK1+p-IRF3+ and IFN-β were found only in BMDCs derived from wild-type mice, not from STING-KO mice, when cocultured with olaparib-treated Brca1-null ID8 (Figures 3H and 3I).
We next examined whether the STING-dependent activation of DCs is specific to PARP inhibition in the context of Brca1 deficiency. We first performed an IC50 (half maximal inhibitory concentration) evaluation of a panel of drugs including two PARP inhibitors (olaparib and talazoparib) and two cytotoxic agents (gemcitabine and paclitaxel) on three pairs of Brca1-proficient and Brca1-deficent models (Figure S3H). In comparison with Brca1-proficient counterparts, all Brca1-deficient lines are much more sensitive to PARP inhibitors (Figure S3H). In contrast, there are no substantial differences in IC50 values between Brca1-proficient and Brca1-deficient cells for gemcitabine or paclitaxel (except PPM and PBM cells treated with gemcitabine). Further analysis also indicated that activation of STING pathway occurred in BMDCs when co-cultured with olaparib-treated Brca-deficient tumor cells but not in gemcitabine-treated tumor cells (Figure S3I). Interestingly, the phosphorylation of TBK1 and IRF3 was increased in BMDCs when co-cultured with both Brca1-deficient and Brca1-proficient ID8 cells treated with paclitaxel (Figure S3J). Together, these results indicate changes specifically caused by PARP inhibition in Brca1-deficient cells.
Activation of the STING Pathway Is Required for the Antitumor Efficacy of Olaparib in Brca1-Deficient Tumors
To investigate whether the STING-mediated immune response is important for the antitumor efficacy of olaparib in Brca1-deficient tumors in vivo, we first demonstrated an increased p-TBK1+p-IRF3+ in intratumoral APCs, including DCs and macrophages, of PBM tumors after olaparib treatment (Figures 4A and S4A). Increased expression of IFN-β and CXCL10 was also detected in olaparib-treated PBM tumors (Figure 4B). Moreover, cytokine profiling of the sera collected from PBM tumor-bearing mice treated with olaparib revealed increased levels of multiple cytokines, including CXCL9 and CXCL10, as well as IFN-β (Figure S4B). In contrast, these hallmarks of STING pathway activation (Tanaka and Chen, 2012; Wu and Chen, 2014) were not observed in Brca1-proficient PPM tumors upon olaparib treatment (Figures S4C and S4D). These data suggest that activation of the STING pathway in response to PARP inhibition is specific to Brca1-deficient tumors.
Figure 4. Activation of the STING Pathway Is Required for Olaparib-Triggered Antitumor Immunity in Brca1-Deficient Tumors.

(A) Flow cytometric analysis of p-TBK1+p-IRF3+ DCs and macrophages from PBM tumors.
(B) Expression of IFN-β and CXCL10 in PBM tumor tissues harvested from PBM tumor-bearing mice treated with vehicle control or olaparib by RT-qPCR analysis (control, n = 7; olaparib, n = 5).
(C) Tumor growth in mice bearing orthotopic allografts of luciferized PBM tumors treated with olaparib with or without BX795 (control, n = 8; olaparib, n = 9; BX795, n = 7; olaparib + BX795, n = 7).
(D) Tumor growth in mice bearing orthotopic allografts of luciferized PBM tumors treated with olaparib with or without anti-IFNAR1 (control, n = 10; olaparib, n = 9; anti-IFNAR1, n = 7; olaparib + anti-IFNAR1, n = 8).
(E) Measurements of tumor weights. Brca1-null ID8 cells were subcutaneously injected to WT or STING−/− mice and treated with olaparib or vehicle control.
(F) Flow cytometric analysis of p-TBK1 in intratumoral DCs of Brca1-null ID8 tumor from (E). Arrows indicate treatment start date.
Data are represented as mean ± SD (A and B) or mean ± SEM (C-F). Each dot represents data obtained from one mouse. *p < 0.05, **p < 0.01, and ***p < 0.001.
We proceeded to assess the importance of STING-mediated immunity in antitumor activity of PARP inhibition on Brca1-deficient tumors with BX795 and a blocking antibody against IFNAR1. Both BX795 and anti-IFNAR1antibody attenuated the antitumor activity of olaparib on PBM tumors (Figures 4C and4D), indicating that activation of the STING pathway and type I IFN responses are important for the antitumor activity of olaparib in Brca-deficient tumors. To further demonstrate that the STING pathway is critical for PARP inhibition-induced antitumor immunity in Brca1-deficient tumors, Brca1-null ID8 cells were subcutaneously injected into wild-type (WT) and STING-KO mice. Our results show that olaparib significantly inhibited the tumor growth in WT mice but had little effect on tumor growth in STING-KO hosts (Figure 4E). An increased abundance of intratumoral p-TBK1+DCs was detected only in ID8/Brca1-null tumors from WT host, not from STING-KO mice, after olaparib treatment (Figure 4F). Together, our findings suggest that activation of the STING pathway in tumor-associated APCs through recognition of DNA fragments and/or cGAMP from Brca1-deficient tumors is an underlying mechanism for immune-mediated antitumor activity of PARP inhibition.
DISCUSSION
Large-scale genomic studies have demonstrated that approximately 50% of HGSOCs harbor genetic and epigenetic alterations in HR pathway genes, most commonly in BRCA1 and BRCA2 (Cancer Genome Atlas Research Network, 2011). Loss of HR causes genomic instability and hyperdependence on alternative DNA repair mechanisms and is associated with exquisite sensitivity to PARP inhibitors, which exhibit synthetic lethality with BRCA loss of function. This synthetic lethal interaction is being exploited therapeutically in ovarian cancer whereby three PARP inhibitors, i.e., olaparib, rucaparib and niraparib, have received regulatory approval as monotherapy either in patients with germline or somatic BRCA1/2 mutations, or as maintenance therapy after platinum chemotherapy in platinum-sensitive recurrent disease (Matulonis et al., 2016; Mirza et al., 2016; Swisher et al., 2017). The efficacy of PARP inhibitors against HR-deficient cells can be explained by various mechanisms, including inhibition of base excision repair, trapping of PARP- DNA complexes at the replication fork, enhancement of toxic NHEJ in PARP1-deficient cells, and inhibition of PARP1/Polθ- mediated alternative end joining (Konstantinopoulos et al.,2015). Underlying HR deficiency is important for the cytotoxicity of PARP inhibitors, and this is highlighted by the fact that the most prevalent mechanism of PARP inhibitor resistance in HR-deficient tumors is secondary genetic and epigenetic events that functionally revert the original HR alteration and restore HR proficiency (Kondrashova et al., 2017; Sakai et al., 2008; Swisher et al., 2008).
Here, we report an alternative and important mechanism of PARP inhibitor action in vivo that involves coordinated activation of robust local and systemic antitumor immune responses and is similarly dependent on underlying HR deficiency. Unlike the previously known DNA repair-specific mechanisms of PARP inhibitor activity that were unraveled in vitro mostly using cell line models, the mechanism in this study was identified using a pair of GEMMs of HGSOCs, a Brca1-deficient (PBM model) and a Brca1-WT (PPM, HR-proficient model). Specifically, we showed that olaparib treatment increased the number of intratumoral CD4+ and CD8+ T cells and significantly increased the production of IFNγ and TNFα from these cells. This increased activation of intratumoral CD4+ and CD8+T cells was associated with increased recruitment of DCs displaying potent antigen presentation capacity in the tumor microenvironment and was accompanied by significantly reduced MDSCs in the tumor tissue, the spleen, and the blood. All these immune responses elicited by olaparib were specific to the HR deficiency context, as they were observed in the Brca1-deficient tumors but not in the HR-proficient tumors. Mechanistically, these coordinated robust local and systemic antitumor immune responses following PARP inhibition occurred via activation of the STING pathway in APCs and were mediated by sensing of tumor-derived DNA or cGAMP. However, the molecular requirements of cGAS and STING in Brca1-deficient tumor cells in the context of STING-mediated antitumor responses are yet to be determined.
Importantly, Brca1-deficient PBM tumors treated with olaparib alone had significantly increased expression of the immune-inhibitory ligand PD-L1 on tumor cells both in vivo and in vitro, and addition of immune checkpoint blockade by PD-1 antibody to olaparib resulted in sustained suppression of PBM tumors and extended survival compared with olaparib alone where delayed tumor growth was observed. These data suggest that although olaparib is effective in treating HR-deficient PBM tumors, activation of the PD-1/PD-L1 immune-inhibitory pathway limits its activity, and this limitation can be overcome by incorporating an anti-PD-1 antibody into the treatment regimen. This observation has important clinical implications because although patients with HR-deficient HGSOCs initially respond to PARP inhibitors, a substantial fraction of these patients eventually develop progressive tumors, which represents a significant problem in the clinic. Our study suggests that addition of PD-1 blockade may prolong the activity of PARP inhibition by overcoming the increased expression of PD-L1 on tumor cells that occurs after treatment with PARP inhibitors alone. In this regard, combinations of PARP inhibitors with immune checkpoint inhibitors targeting the PD-1 pathway are already undergoing clinical trial evaluation in ovarian cancer, and the results of these studies are eagerly awaited. Of note, our study highlights the importance of investigating the STING pathway as a biomarker of efficacy in these trials. Finally, although the combination of PARP inhibitors with PD-1 blockades may represent an effective strategy to improve the clinical outcome of ovarian cancer, control of this disease remains a challenge.
STAR★METHODS
CONTACT FOR REAGENT AND RESOURCE SHARING
Further information and requests for resources and reagents should be directed to and will be fulfilled by the Lead Contact, Jean J. Zhao (Jean_Zhao@dfci.harvard.edu).
EXPERIMENTAL MODEL AND SUBJECT DETAILS
Mice
All animal experiments described in this study were performed according to the animal protocols approved by the DFCI Institutional Animal Care and Use Committee. Brca1loxP/loxP mouse line was kindly provided by Dr. Jos Jonkers’s laboratory (Netherlands Cancer Institute, Amsterdam, the Netherlands). Trp53loxP/loxP mouse line was obtained from National Cancer Institute Mouse Repository. PtenloxP/loxP mouse line was kindly provided by Dr. Hong Wu (Peking University, Beijing, China). All these mouse lines were back- crossed for more than 10 generations to the FVB/N background before intercrossed to make homozygous mouse lines. Ovarian surface epithelial (OSE) cells were isolated from 6-to 8-week-old female mice (Trp53−/−; Brca1−/−; c-Myc or Trp53−/−; Pten−/−; c-Myc) and cultured in vitro for transplantation and ovarian tumor generation. STING knock out mice (C57BL/6J-Tmem173gt/J, Stock No: 017537) were purchased from the Jackson Laboratory. Mouse tumor allografts for evaluation of treatment were generated by injection of ovarian tumor cells into 6- to 8-week-old female FVB/NJ or C57BL/6J mice from the Jackson Laboratory.
Cell Lines
The 293T cell line was obtained from the American Type Culture Collection (ATCC, Manassas, VA) and cultured in DMEM supplemented with 10% FBS and 100 μg/ml penicillin-streptomycin. PPM and PBM cells were generated from primary ovarian tumors and cultured in MOT media (DMEM/F12, 0.6% FBS, 10ng/ml EGF, hydrocortisone 1 μg/ml, cholera toxin 1ng/ml, 100 μg/ml penicillin-streptomycin, 5 μM Y27632). UWB1.289 and UWB1.289+BRCA1 were purchased from ATCC and cultured in complete growth medium (50% ATCC-formulated RPMI-1640 medium, 50% MEGM medium and 3% fetal bovine serum). All cell lines were cultured at 37°C in a fully humidified atmosphere of 5% CO2.
METHOD DETAILS
Mouse Experiments
Generation of Brca1-deficient and -proficient HGSOC GEMMs
The ovaries were washed twice with phosphate-buffered and incubated in DMEM/F12 (Ham’s) medium containing collagenase and dispase (StemCell Technologies, Inc.) for 40 min at 37°C. The epithelial cells were pelleted by centrifugation at 800 × g and cultured in DMEM/F12 (Life Technologies) supplemented with 4% (vol/vol) FBS, 1% penicillin/streptomycin, 10 ng/mL EGF, 5 μg/mL insulin, 5 μg/mL transferrin, and 5 ng/mL sodium selenite. Ovarian surface epithelial (OSE) cells were cultured for 48 hr and then introduced with Adeno-Cre (University of Iowa) and lentiviruses expressing c-Myc (Addgene #36980) or control GFP. Two days post-infection, OSE cells were collected and implanted into recipient mice. About 5×10⁵ OSE cells (Trp53−/−;Brca1−/−; c-Myc−/−;) were injected into the right ovarian bursal cavities of 6- to 7-week-old female nude mice. The left ovarian bursa of each mouse was injected with GFP expressing OSE cells (Trp53−/−; Brca1−/−; GFP). PBM (Trp53−/−; Brca1−/−; c-Myc) ovarian tumor developed within three to six months after implantation. The primary ovarian tumors were then digested and orthotopically transplanted to FVB/NJ mice. PPM GEM model (Trp53−/−; Pten−/−; c-Myc) was developed with OSE cells isolated from homozygous Trp53loxP/loxP/ PtenloxP/loxP FVB/NJ mice using the same strategy for generation of PBM GEM model. For histological analysis, tumor pieces were fixed in 10% Formalin overnight and transferred to 70% ethanol. Embedding, sectioning and H&E staining was performed by Harvard rodent histopathology core. The histological characteristics of high grade ovarian tumor were confirmed by two independent pathologists at Harvard medical school.
Lentiviral Production and Transduction
The pLenti-blasticidin-Luciferase vector or pWPXL-c-Myc were co-transfected with pCMV-delta8.9 and pVSVG at the ratio of 2:2:1 into HEK293T cells by PEI (1 μg/μl) (4:1 to DNA). The medium was changed 24hr after transfection and the viral supernatants were collected 48hr later by filtering through a 0.45-μm filter and ultracentrifugation (SW28, 16,600 rpm, 2 h). Viral pellets were resuspended in RPMI-1640 media and aliquoted and stored at −80°C for future use.
Tumor Growth and Treatment
Single cells were obtained by digestion of primary ovarian tumors in collagenase buffer and then cultured in MOT media (DMEM/F12, 0.6% FBS, 10ng/ml EGF, hydrocortisone 1 μg/ml, cholera toxin 1ng/ml, 100 μg/ml penicillin-streptomycin, 5 μM Y27632). Tumor cells were transduced with lentiviral vector encoding Luciferase (pLenti-blasticidin-Luciferase) and then subjected to 3 days antibiotic selection with blasticidin 2 μg/ml. These luciferased tumors were transplanted orthotopically into syngeneic FVB/NJ mice to generated tumors for drug evaluation.
Olaparib(AZD2281) was used by diluting 100 mg/ml stocks in DMSO with 10% 2-hydroxyl-propyl-ß-cyclodextrine/PBS and administered daily by i.p. injection at dose of 50mg/kg body weight. Anti-PD-1 antibody (clone, 332.8H3) was diluted in PBS (250 μg/100μl/mouse) and injected by i.p. every 3 days. Anti-IFNAR1 antibody (Cat# BE0241; clone, MAR1–5A3; InVivoMab) was diluted in PBS (200 μg/100 μl/mouse) and injected by i.p. every 3 days. Tumor-bearing mice were equivalently divided into control and treatment groups according to the luminescent intensity. The endpoints were determined by tumor burden and ascites. For the CD8 depletion experiment, mice were injected intraperitoneally with anti-CD8 antibody (400 μg; clone YTS 169.4, BioXcell) 24 and 48h before beginning olaparib treatment (50 mg/kg/day) and every 4 days thereafter.
Bioluminescence Imaging
Mice were injected i.p. with D-luciferin (Gold Biotechnology) (~120 mg/kg) and the luciferase signal was detected 10 min later by IVIS imaging system (PerkinElmer). Images were obtained and analyzed with Living Image Software.
Flow Cytometry Analysis
Tumors were first mechanically disrupted by chopping and chemically digested in collagenase buffer (8 mL DMEM, 0.1 mL 1M HEPES, 0.5 mL FBS, 0.2 mL Pen/Strep,1mL 10Xcollagenase/hyaluronidase (stemcell technologies), 0.2 mL 1mg/mL DNase I (Stemcell technologies) at 37°C for 45 min. Single-cell suspensions of spleen and lymph node were obtained by mashed through 70 um strainer using plunger of a 3 or 5 mL syringe. Single cell suspensions were treated with red blood lysis buffer (4 mL NH4Cl + 1 mL PBS with 2% calf serum) and washed with FACS buffer. Single cells suspensions were incubated with LIVE/DEAD Fixable Aqua Dead Cell Stain (Life Technologies, Cat# L34965) for 30 min and then blocked with anti-CD16/32 (Biolegend, clone 93) for 20 min on ice. Samples were then incubated with appropriate antibodies for 30 min on ice. Foxp3 staining buffer set (eBioscience, Cat# 00–5523-00) was applied for intracellular markers staining. For the intracellular cytokine analysis, cells were stimulated with Leukocyte Activation Cocktail (BD Biosciences, Cat# 550583) at 37°C for 5 hours prior to FACS staining. The following antibodies were used in this study: antibodies were purchased from BioLegend unless otherwise indicated: CD45 (clone 30-F11), TCRβ (clone H57–597), CD4 (clone RM4–5), CD8 (clone 53–6.7), CD44 (clone IM7), CD62L (MEL-14), CD25 (PC61), IFNγ (clone XMG1.2), TNFα (clone MP6-XT22), PD-1 (clone 29F.1A12), TIM-3 (clone RMT3–23), LAG-3 (clone C9B7W), CD11b (clone M1/70), CD11c (clone BM8), F4/80 (clone BM8), Gr-1 (clone RB6-BC5), Ly-6C (clone HK1.4), Ly-6G (clone 1A8), MHC II (clone M5/114.15.2), CD80 (clone 16–10A1), CD86 (clone GL-1), MHC I (clone KH114), FoxP3 (clone FJK-16s; eBioscience), Phospho-IRF-3 (Ser396) (clone D6O1M, Cell signaling technology) and Phospho-TBK1/NAK (Ser172) (clone D52C2, Cell signaling technology). Flow cytometry was performed on an LSRII (BD Biosciences) or Fortessa HTS (BD Biosciences) at DFCI Flow Cytometry Core, and all the data were analyzed using FlowJo software.
Cytosolic dsDNA Staining
PBM and PPM cells were cultured on chambered cell culture slides (BD Falcon). Cells were treated with 2.5 μM Olaparib or vehicle control (DMSO) for 24 hours. Following the treatment, cells were incubated with culture media containing PicoGreen dsDNA stain (200-fold dilution, Life Technologies). After one hour incubation, cells were fixed with 4% paraformaldehyde in PBS (Santa Cruz Biotechnology) for 10 minutes. Cells were then washed twice with PBS and stained with 300nM DAPI (Thermo Fisher Scientific) for 10 minutes. Coverslips were mounted using ProLong Diamond Antifade Mountant (Thermo Fisher Scientific). Staining was imaged using a Leica SP5X laser scanning confocal microscope.
Cytokine array analysis and ELISAs
Blood was obtained by retro-orbital sampling at intermediate time points or experimental end points. Blood cells and sera were separated by centrifugation at 1,500 g for 5 min at 4°C. Sera were sent out to Eve Technologies for cytokine array analysis (Chemokine Array 31-Plex and Mouse Procarta IFN 2-plex Featured Assay). Sera were applied to ELISA according to manufacturer’s instructions. For in vitro experiments, cell culture supernatants were obtained by centrifugation at 1,500 g for 5 min at 4°C to remove all the debris and cells and then subjected to ELISA. IFN-β was detected by the LEGEND MAX Mouse IFN-β ELISA Kit (Biolengend).
Generation of Brca-1 deficient ID8 cells and tumors
Brca-1 deficient ID8 cells were generated using a CRISPR double nickase plasmid. ID8 cells cultured in a 6-well plate were transfected with 2 μg/well of BRCA1 double nickase plasmid (sc-419362-NIC, Santa Cruz Biotechnology) or control double nickase plasmid (SC-437281, Santa Cruz Biotechnology) using lipofectamine 3000 (Invitrogen). 48 hr post-transfection, cells were passaged ontoa 10cm plate. After24h, puromycin (3 μg/mL) was added to the culture for selection. Puromycin resistant cells were selected and expanded. Due to a lack of a reliable mouse BRCA1 antibody for western blot, cells were analyzed by DNA sequencing to confirm the disruption of functional Brca1 allele. To generate ID8 tumors, cultured ID8 cells were harvested and resuspended in serum free DMEM. Cells were then mixed with Matrigel (Corning). A total volume of 0.1 mL containing 5 × 10⁶ ID8 cells and 40% Matrigel were injected subcutaneously into the flank of C57BL/6J mice.
Measurement of IC50 Value in Tumor Cells
Tumor cells were seeded in 96-well plates at a density of 1000–3000/well and allowed to adhere overnight. Cells were then exposed to appropriate concentrations of therapeutic agents (or vehicle control) with continuous exposure for 72 h. Growth inhibition was measured by CellTiter Aqueous MTS reagent from Promega by comparing the absorbance at 490 nm of drug-treated cells to that of untreated controls set at 100%. IC50 values were calculated using non-linear regression model (logarithmic inhibitor versus normalized response-variable slope) in Graphpad Prism 7.
In Vitro Coculture of Tumor Cells and DCs
Bone marrow cells were isolated from FVB/NJ mice and cultured in RPMI-1640 containing 10%FBS and 20ng/ml GM-CSF. BMDCs (bone marrow derived dendritic cells) were harvested for in vitro coculture assay on day 7 to day 10. About 3×10⁵ PBM or PPM tumor cells were cultured in 6-well plate for 24 hr and then treated with DMSO or olaparib. After 24 hr incubation with DMSO, olaparib or olaparib in combination with other drugs (cell cycle inhibitor or apoptosis inhibitor), drugs were removed and tumor cells were washed twice with PBS. BMDCs were added and cocultured with PBM or PPM cells at the ratio of 1:1 in 1.5 mL culture media in the presence of GM-CSF (20ng/ml) and lipofectamine (2 μl) for 24 hr. Cocultured cells were harvested for flow cytometry analysis and floating cells (percentage of BMDCs is about 90%) were collected for mRNA analysis. Cell culture supernatants were collected for detection of IFN-β by ELISA. BMDCs generated from C57BL/6J mice were applied for the coculture of BMDCs with ID8 tumor cells. Human dendritic cells purchased from Lonza were used for the coculture of human DCs with DMSO or olaparib-treated human ovarian cancer cells (UWB1.289 and UWB1.289+BRCA1).
RNA Extraction and Quantitative Real-time PCR
About 50 to 100 mg of tumor samples were homogenized in 1 mL of TRIZOL reagent supplied with 200 μL of stainless steel beads and 0.2 mL of chloroform was added to the samples. Samples were vortexed vigorously for 15 s and then incubated at room temperature for 2 to 3 minutes. After centrifugation at 12,000 x g for 15 minutes at 4°C, upper aqueous phase of the samples was carefully removed to a new tube and the total RNA was purified by RNeasy Mini Kit (QIAGEN) according to the manufacturer’s instruction. For the in vitro cultured cell samples, total RNA was isolated by RNeasy Mini Kit. The qPCR was performed on an Applied Biosystems 7300 machine after the total RNA was reverse transcribed to cDNA using the SuperScript III First-Strand Synthesis System (Invitrogen). Primers used for qPCR were as follows: p53-F 5′-CCCGAGTATCTGGAAGACAG-3′, p53-R 5′-ATAGGTCGGCGGTT CAT-3′; Brca1-F 5′-TGAAGACTGCTCGCAGAGTGATA-3′; Brca1-R 5′-AGCTTCCAGGTGAGCCATTTC-3′; Myc-F 5’-CAGAGGAG GAACGAGCTGAAGCGC-3′, Myc-R 5′-TTATGCACCAGAGTTTCGAAGCTGTTCG-3′; Pten-F 5′-AGACCATAACCCACCACAGC-3′, Pten-R 5′-TAGGGCCTCTTGTGCCTTTA-3′ ;IFN-β-F 5′ -TCCGAGCAGAGATCTTCAGGAA-3′, IFN-β-R 5′-TGCAACCACCACT CATTC-TGAG-3′; Cxcl10-F 5′-GCCGTCATTTTCTGCCTCA-3′; Cxcl10-R 5′-CGTCCTTGCGAGAGGG ATC-3′; 18SrRNA-F 5′-CTTA GAGGGACAAGTGGCG-3′,18SrRNA-R 5′-ACGCTGAGCCAGTC-GTGTA-3′; Gapdh-F 5′-ACAACTTTGGCATTGTGGAA-3′, Gapdh-R 5′-GATGCAGGGATGATGTTCTG-3′.
Gene Set Enrichment Analyses (GSEA)
RNA was isolated from tumor samples as described above, sequenced on the Ion Torrent platform per manufacturer’s instructions using a custom AmpliSeq panel targeting 4604 murine genes relevant to our studies, and raw data was processed using the Torrent Suite and AmpliSeqRNA plugin to give read counts per gene. Differential gene expression analyses were carried out using DESeq2 with default parameters to obtain log2 fold change (MAP) and adjusted p values (Benjamini-Hochberg procedure) (Love et al., 2014). Genes were ranked by log2 fold change (MAP), and GSEA were carried out using the GSEAPreranked tool (Mootha et al., 2003; Subramanian et al., 2005). PCA were carried out using DESeq2.
QUANTIFICATION AND STATISTICAL ANALYSIS
Statistical analysis was performed using Prism 7 (Graphpad Software Inc.). Two-tailed Student’s t test for normally distributed data and Mann-Whitney nonparametric test for skewed data that deviate from normality were used to compare two conditions. One-way ANOVA with Bonferroni’s post hoc test for normally distributed data and Kruskal-Wallis nonparametric test for skewed data were used to compare three or more means. Differences with p < 0.05 were considered statistically significant.
DATA AVAILABILITY
Transcriptomic data that support the findings of this study have been deposited in the Gene Expression Omnibus The accession number for the data reported in this paper is [GEO]: GSE120500.
Supplementary Material
KEY RESOURCES TABLE
| REAGENT or RESOURCE | SOURCE | IDENTIFIER |
| Antibodies | ||
| FITC anti-mouse CD45 (clone 30-F11) | BioLegend | Cat# 103108; RRID: AB_312973 |
| FITC anti-human CD45 (clone HI30) | BioLegend | Cat# 304006; RRID: AB_314394 |
| PerCP/Cy5.5 anti-mouse TCR β chain (clone H57–597) | BioLegend | Cat# 109228; RRID: AB_1575173 |
| APC/Cy7 anti-mouse CD4 (clone RM4–5) | BioLegend | Cat# 100526; RRID: AB_312727 |
| Alexa Fluor 700 anti-mouse CD8a (clone 53–6.7) | BioLegend | Cat# 100730; RRID: AB_493703 |
| Brilliant Violet 605 anti-mouse/human CD44 (clone IM7) | BioLegend | Cat# 103047; RRID: AB_2562451 |
| Brilliant Violet 711 anti-mouse CD62L (clone MEL-14) | BioLegend | Cat# 104445; RRID: AB_2564215 |
| PE anti-mouse IFN-γ (clone XMG1.2) | BioLegend | Cat# 505808; RRID: AB_315402 |
| APC anti-mouse TNF-α (clone MP6-XT22) | BioLegend | Cat# 506308; RRID: AB_315429 |
| PE/Cy7 anti-mouse CD11c (clone N418) | BioLegend | Cat# 117318; RRID: AB_493568 |
| Brilliant Violet 650 anti-human CD11c (clone 3.9) | BioLegend | Cat# 301638; RRID: AB_2563797 |
| APC/Cy7 anti-mouse I-A/I-E (clone M5/114.15.2) | BioLegend | Cat# 107628; RRID: AB_2069377 |
| PE anti-mouse CD80 (clone 16–10A1) | BioLegend | Cat# 104708; RRID: AB_313129 |
| Pacific Blue anti-mouse CD86 (clone GL-1) | BioLegend | Cat# 105022; RRID: AB_313145 |
| Brilliant Violet 605 anti-mouse CD103 (clone 2E7) | BioLegend | Cat# 121433; RRID: AB_2629724 |
| Brilliant Violet 650 anti-mouse/human CD11b (clone M1/70) | BioLegend | Cat# 101228; RRID: AB_893232 |
| APC anti-mouse Ly-6C (clone HK1.4) | BioLegend | Cat# 128015; RRID: AB_1732087 |
| Pacific Blue anti-mouse Ly-6G (clone 1A8) | BioLegend | Cat#127612; RRID: AB_2251161 |
| APC/Cy7 anti-human HLA-DR (clone L243) | BioLegend | Cat# 307618; RRID: AB_493586 |
| PE anti-mouse/human phospho-TBK1 (Ser172) (clone D52C2) | Cell Signaling Tech. | Cat# 13498S |
| PE anti-mouse/human phospho-TBK1 (Ser172) (clone J133–587) | BD Biosciences | Cat # 558604; RRID: AB_647214 |
| Alexa Fluor 647 anti-mouse/human phospho-IRF-3 (Ser396) (clone D6O1M) |
Cell Signaling Tech. | Cat# 10327S |
| PD-L1 antibody (10F.9G2) | BioLegend | Cat# 124321; RRID: AB_2563635 |
| InVivomAb anti-mouse CD8a neutralizing antibody (clone YTS 169.4) |
BioXcell | Cat# BE0117 |
|
InVivomAb anti-mouse IFNAR-1 neutralizing antibody (clone MAR1–5A3) |
BioXcell | Cat# BE0241 |
| Anti-PD-1 antibody (clone, 332.8H3) | Dr. Gordon Freeman's lab at Dana-Farber Cancer Institute |
N/A |
| Bacterial and Virus Strains | ||
| Ad5CMVCre | University of Iowa | VVC-U of Iowa-5 |
| Ad5CMVCre-eGFP | University of Iowa | VVC-U of Iowa-1174 |
| Chemicals, Peptides, and Recombinant Proteins | ||
| Olaparib | MedChem Express | Cat# HY-10162 |
| BX-795 hydrochloride | Sigma Aldrich | Cat# SML0694 |
| (2-Hydroxypropyl)-β-cyclodextrin (HPCD) | MedChem Express | Cat# HY-101103 |
| D-Luciferin, Potassium Salt | Gold BioTechnology | Cat# LUCK |
| Paraformaldehyde solution 4% in PBS | Santa Cruz | Cat# sc-281692 |
| 7-AAD Viability Staining Solution | BioLegend | Cat# 420404 |
| FITC Annexin V | BioLegend | Cat# 640906 |
| CDK1 inhibitor IV, RO-3306 | Calbiochem | Cat# 217699 |
| Mouse Recombinant GM-CSF | StemCell Technologies, Inc. | Cat #78017.1 |
| Collagenase/hyaluronidase | StemCell Technologies, Inc. | Cat# 07912 |
| DNase I | StemCell Technologies, Inc. | Cat# 07900 |
| Critical Commercial Assays | ||
| Quant-iT PicoGreen dsDNA Reagent | Life Technologies | Cat# P7581 |
| Mouse IFN beta ELISA Kit | Thermo Fisher Scientific | Cat# EN424001 |
| Annexin V Binding Buffer | BioLegend | Cat# 422201 |
| MEGM Bullet Kit | Lonza | Cat# CC-3150 |
| Dynabeads Mouse T-Activator CD3/CD28 for T Cell Expansion and Activation |
GIBCO | Cat#11452D |
| CellTrace Violet Cell Proliferation Kit, for flow cytometry | Life Technologies | Cat# C34557 |
| Deposited Data | ||
| Transcriptome data | GEO | GSE120500 |
| Experimental Models: Cell Lines | ||
| UWB1.289 | American Type Culture Collection | Cat# CRL-2945; RRID: CVCL_B079 |
| UWB1.289+BRCA1 | American Type Culture Collection | Cat# CRL-2946; RRID: CVCL_B078 |
| NHDC-Human Dendritic Cells | Lonza | Cat# CC-2701 |
| Experimental Models: Organisms/Strains | ||
| C57BL/6J-Tmem173 gt/J | The Jackson Laboratory | Stock No: 017537 |
| FVB/NJ mice | The Jackson Laboratory | Stock No: 001800 |
| C57BL/6J mice | The Jackson Laboratory | Stock No: 000664 |
| Brca1loxP/loxP mice | Dr. Jos Jonkers's laboratory | N/A |
| Trp53loxP/loxP mice | National Cancer Institute Mouse Repository |
N/A |
| PtenloxP/loxP mice | Dr. Hong Wu's laboratory | N/A |
| PBM | This paper | FVB/NJ |
| PPM | This paper | FVB/NJ |
| Recombinant DNA | ||
| BRCA1 Double Nickase Plasmid (m) | Santa Cruz Biotechnology | Cat# SC-419362-NIC |
| Software and Algorithms | ||
| PRISM 7 software | Graphpad | https://www.graphpad.com/scientific-software/prism/ |
| GSEA (v2.2.2) | Broad Institute | http://software.broadinstitute.org/gsea/index.jsp |
| Flowjo (version 10.1) | FlowJo, LLC | https://www.flowjo.com/solutions/flowjo/ |
Highlights.
T cell-mediated cytotoxicity is important for therapeutic activity of PARP inhibition
Olaparib-treated Brca1-deficient tumor cells activate the STING pathway in APCs
STING pathway activation is required for the antitumor efficacy of PARP inhibition
PD-1 blockade enhances the antitumor efficacy of olaparib in Brca1-deficient tumors
ACKNOWLEDGMENTS
We thank Judith Agudo for critical reading of the manuscript. We thank Xin Cheng, Thanh Von, Johann Bergholz, and Kayley N. Abell-Hart in the Zhao lab at Dana-Farber Cancer Institute (DFCI) for experimental assistance. The authors gratefully acknowledge support from Friends of DFCI (L.D.), KL2/Catalyst Medical Research Investigator Training grant 5KL2TR001100–05 (E.H.S.), the Ovarian Cancer Research Fund Alliance (to U.A.M.), the Breast Cancer Research Foundation BCRF-18–104 and BCRF-18–179 (U.A.M., P.A.K., and J.J.Z.), the Men’s Collaborative of DFCI Fund (U.A.M. and J.J.Z.), the Sandra Fishman Research Fund of DFCI (U.A.M.), and NIH/National Cancer Institute (NCI) grants P01 AI056299 (G.J.F.), P50 CA101942 (G.J.F.), CA187918 (T.M.R. and J.J.Z.), and CA210057 (J.J.Z.).
Footnotes
SUPPLEMENTAL INFORMATION
Supplemental Information includes four figures and can be found with this article online at https://doi.org/10.1016/j.celrep.2018.11.054.
DECLARATION OF INTERESTS
J.F.L. has been on advisory boards for Clovis and Mersana Therapeutics. G.J.F. has patents on the PD-1 pathway licensed by Bristol-Myers Squibb, Roche, Merck, EMD-Serono, Boehringer-Ingelheim, AstraZeneca, DAKO, and Novartis and has served on advisory boards for Roche, Bristol-Myers Squibb, Xios, and Origimed. T.M.R. has a consulting relationship with Novartis, is a founder of Crimson Biotech and Geode Therapeutics, and is a member of the corporate boards of iKang Healthcare, Crimson Biotech, and Geode Therapeutics. P.A.K. has served on the advisory boards of Vertex, Pfizer, Merck, and AstraZeneca. U.A.M. has served on the advisory boards of 2X Oncology, Fujifilm, Immunogen, Mersana, Geneos, and Merck. L.D., Q.W., H.-J.K., and J.J.Z. are co-inventors of DFCI 2409.001 (DFS-203.60). J.J.Z. is a founder and board director of Crimson Biotech and Geode Therapeutics.
REFERENCES
- Barber GN (2015). STING: infection, inflammation and cancer. Nat. Rev. Immunol 15, 760–770. [DOI] [PMC free article] [PubMed] [Google Scholar]
- Broz ML, Binnewies M, Boldajipour B, Nelson AE, Pollack JL, Erle DJ, Barczak A, Rosenblum MD, Daud A, Barber DL, et al. (2014). Dissecting the tumor myeloid compartment reveals rare activating antigen-presenting cells critical for T cell immunity. Cancer Cell 26, 938. [DOI] [PubMed] [Google Scholar]
- Bryant HE, Schultz N, Thomas HD, Parker KM, Flower D, Lopez E, Kyle S, Meuth M, Curtin NJ, and Helleday T (2005). Specific killing of BRCA2-deficienttumourswith inhibitors of poly(ADP-ribose) polymerase. Nature 434, 913–917. [DOI] [PubMed] [Google Scholar]
- Cancer Genome Atlas Research Network(2011). Integrated genomic analyses of ovarian carcinoma. Nature 474, 609–615. [DOI] [PMC free article] [PubMed] [Google Scholar]
- Cubillos-Ruiz JR, Rutkowski M, and Conejo-Garcia JR (2010). Blocking ovarian cancer progression by targeting tumor microenvironmental leukocytes. Cell Cycle 9, 260–268. [DOI] [PMC free article] [PubMed] [Google Scholar]
- Cubillos-Ruiz JR, Silberman PC, Rutkowski MR, Chopra S, Perales-Pu-chalt A, Song M, Zhang S, Bettigole SE, Gupta D, Holcomb K, et al. (2015). ER stress sensor XBP1 controls anti-tumor immunity by disrupting dendritic cell homeostasis. Cell 161, 1527–1538. [DOI] [PMC free article] [PubMed] [Google Scholar]
- Deng L, Liang H, Xu M, Yang X, Burnette B, Arina A, Li XD, Mauceri H, Beckett M, Darga T, et al. (2014). STING-dependent cytosolic DNA sensing promotes radiation-induced type I interferon-dependent antitumor immunity in immunogenic tumors. Immunity 41, 843–852. [DOI] [PMC free article] [PubMed] [Google Scholar]
- Farmer H, McCabe N, Lord CJ, Tutt AN, Johnson DA, Richardson TB, Santarosa M, Dillon KJ, Hickson I, Knights C, et al. (2005). Targeting the DNA repair defect in BRCA mutant cells as a therapeutic strategy. Nature 434,917–921. [DOI] [PubMed] [Google Scholar]
- Foulkes WD, and Shuen AY (2013). In brief: BRCA1 and BRCA2. J. Pathol 230,347–349. [DOI] [PubMed] [Google Scholar]
- Harding SM, Benci JL, Irianto J, Discher DE,Minn AJ, and Greenberg RA (2017). Mitotic progression following DNA damage enables pattern recognition within micronuclei. Nature 548, 466–470. [DOI] [PMC free article] [PubMed] [Google Scholar]
- Ishikawa H, and Barber GN (2008). STING is an endoplasmic reticulum adaptor that facilitates innate immune signalling. Nature 455, 674–678. [DOI] [PMC free article] [PubMed] [Google Scholar]
- Jiao S, Xia W, Yamaguchi H, Wei Y, Chen M-K, Hsu J-M, Hsu JL, Yu W-H, Du Y, Lee H-H, et al. (2017). PARP inhibitor upregulates PD-L1 expression and enhances cancer-associated immunosuppression. Clin. Cancer Res 23, 3711–3720. [DOI] [PMC free article] [PubMed] [Google Scholar]
- Kim S, Li L, Maliga Z, Yin Q, Wu H, and Mitchison TJ (2013). Anticancer flavonoids are mouse-selective STING agonists. ACS Chem. Biol 8, 1396–1401. [DOI] [PMC free article] [PubMed] [Google Scholar]
- Kondrashova O, Nguyen M, Shield-Artin K, Tinker AV, Teng NNH, Harrell MI, Kuiper MJ, Ho GY, Barker H, Jasin M, et al. ; AOCS Study Group (2017). Secondary somatic mutations restoring RAD51C and RAD51D associated with acquired resistance to the PARP inhibitor rucaparib in highgrade ovarian carcinoma. Cancer Discov 7, 984–998. [DOI] [PMC free article] [PubMed] [Google Scholar]
- Konstantinopoulos PA, Ceccaldi R, Shapiro GI, and D’Andrea AD (2015). Homologous recombination deficiency: exploiting the fundamental vulnerability of ovarian cancer. Cancer Discov 5, 1137–1154. [DOI] [PMC free article] [PubMed] [Google Scholar]
- Ledermann JA (2016). PARP inhibitors in ovarian cancer. Ann. Oncol 27 (Suppl 1), i40–i44. [DOI] [PubMed] [Google Scholar]
- Li T, and Chen ZJ (2018). The cGAS-cGAMP-STING pathway connects DNA damage to inflammation, senescence, and cancer. J. Exp. Med 215, 1287–1299. [DOI] [PMC free article] [PubMed] [Google Scholar]
- Lord CJ, and Ashworth A (2017). PARP inhibitors: synthetic lethality in the clinic. Science 355, 1152–1158. [DOI] [PMC free article] [PubMed] [Google Scholar]
- Love MI, Huber W, and Anders S (2014). Moderated estimation of fold change and dispersion for RNA-seq data with DESeq2. Genome Biol 15, 550. [DOI] [PMC free article] [PubMed] [Google Scholar]
- Mackenzie KJ, Carroll P, Martin CA, Murina O, Fluteau A, Simpson DJ, Olova N, Sutcliffe H, Rainger JK, Leitch A, et al. (2017). cGAS surveillance of micronuclei links genome instability to innate immunity. Nature 548, 461–465. [DOI] [PMC free article] [PubMed] [Google Scholar]
- Matulonis UA, Penson RT, Domchek SM, Kaufman B, Shapira-Frommer R, Audeh MW, Kaye S, Molife LR, Gelmon KA, Robertson JD, et al. (2016). Olaparib monotherapy in patients with advanced relapsed ovarian cancer and a germline BRCA1/2 mutation: a multistudy analysis of response rates and safety. Ann. Oncol 27, 1013–1019. [DOI] [PubMed] [Google Scholar]
- Maya-Mendoza A, Moudry P, Merchut-Maya JM, Lee M, Strauss R, and Bartek J (2018). High speed of fork progression induces DNA replication stress and genomic instability. Nature 559, 279–284. [DOI] [PubMed] [Google Scholar]
- Mirza MR, Monk BJ, Herrstedt J, Oza AM, Mahner S, Redondo A, Fabbro M, Ledermann JA, Lorusso D, Vergote I, et al. ; ENGOT-OV16/ NOVA Investigators (2016). Niraparib maintenance therapy in platinum-sensitive, recurrent ovarian cancer. N. Engl. J. Med 375, 2154–2164. [DOI] [PubMed] [Google Scholar]
- Mootha VK, Lindgren CM, Eriksson KF, Subramanian A, Sihag S, Lehar J, Puigserver P, Carlsson E, Ridderstråle M, Laurila E, et al. (2003). PGC-1alpha-responsive genes involved in oxidative phosphorylation are coordinately downregulated in human diabetes. Nat. Genet 34, 267–273. [DOI] [PubMed] [Google Scholar]
- Parkes EE, Walker SM, Taggart LE, McCabe N, Knight LA, Wilkinson R, McCloskey KD, Buckley NE, Savage KI, Salto-Tellez M, et al. (2016). Activation of STING-dependent innate immune signaling by S-phase-specific DNA damage in breast cancer. J. Natl. Cancer Inst 109, 109. [DOI] [PMC free article] [PubMed] [Google Scholar]
- Prantner D, Perkins DJ, Lai W, Williams MS, Sharma S, Fitzgerald KA, and Vogel SN (2012). 5,6-Dimethylxanthenone-4-acetic acid (DMXAA) activates stimulator of interferon gene (STING)-dependent innate immune pathways and is regulated by mitochondrial membrane potential. J. Biol. Chem 287, 39776–39788. [DOI] [PMC free article] [PubMed] [Google Scholar]
- Sakai W, Swisher EM, Karlan BY, Agarwal MK, Higgins J, Friedman C, Villegas E, Jacquemont C, Farrugia DJ, Couch FJ, et al. (2008). Secondary mutations as a mechanism of cisplatin resistance in BRCA2-mutated cancers. Nature 451, 1116–1120. [DOI] [PMC free article] [PubMed] [Google Scholar]
- Salmon H, Idoyaga J, Rahman A, Leboeuf M, Remark R, Jordan S, Casanova-Acebes M, Khudoynazarova M, Agudo J, Tung N, et al. (2016). Expansion and activation of CD103(+) dendritic cell progenitors at the tumor site enhances tumor responses to therapeutic PD-L1 and BRAF inhibition. Immunity 44, 924–938. [DOI] [PMC free article] [PubMed] [Google Scholar]
- Subramanian A, Tamayo P, Mootha VK, Mukherjee S, Ebert BL, Gillette MA, Paulovich A, Pomeroy SL, Golub TR, Lander ES, and Mesirov JP (2005). Gene set enrichment analysis: a knowledge-based approach for interpreting genome-wide expression profiles. Proc. Natl. Acad. Sci. USA 102, 15545–15550. [DOI] [PMC free article] [PubMed] [Google Scholar]
- Swisher EM, Sakai W, Karlan BY, Wurz K, Urban N, and Taniguchi T (2008). Secondary BRCA1 mutations in BRCA1-mutated ovarian carcinomas with platinum resistance. Cancer Res 68, 2581–2586. [DOI] [PMC free article] [PubMed] [Google Scholar]
- Swisher EM, Lin KK, Oza AM, Scott CL, Giordano H, Sun J, Konecny GE, Coleman RL, Tinker AV, O’Malley DM, et al. (2017). Rucaparib in relapsed, platinum-sensitive high-grade ovarian carcinoma (ARIEL2 Part 1): an international, multicentre, open-label, phase 2 trial. Lancet Oncol 18, 75–87. [DOI] [PubMed] [Google Scholar]
- Tanaka Y, and Chen ZJ (2012). STING specifies IRF3 phosphorylation by TBK1 in the cytosolic DNA signaling pathway. Sci. Signal 5, ra20. [DOI] [PMC free article] [PubMed] [Google Scholar]
- Vang R, Shih IeM., and Kurman RJ (2009). Ovarian low-grade and highgrade serous carcinoma: pathogenesis, clinicopathologic and molecular biologic features, and diagnostic problems. Adv. Anat. Pathol 16, 267–282. [DOI] [PMC free article] [PubMed] [Google Scholar]
- Wu J, and Chen ZJ (2014). Innate immune sensing and signaling of cytosolic nucleic acids. Annu. Rev. Immunol 32, 461–488. [DOI] [PubMed] [Google Scholar]
- Xia T, Konno H, Ahn J, and Barber GN (2016a). Deregulation of STING signaling in colorectal carcinoma constrains DNA damage responses and correlates with tumorigenesis. Cell Rep 14, 282–297. [DOI] [PMC free article] [PubMed] [Google Scholar]
- Xia T, Konno H, and Barber GN (2016b). Recurrent loss of STING signaling in melanoma correlates with susceptibility to viral oncolysis. Cancer Res 76, 6747–6759. [DOI] [PubMed] [Google Scholar]
Associated Data
This section collects any data citations, data availability statements, or supplementary materials included in this article.
Supplementary Materials
Data Availability Statement
Transcriptomic data that support the findings of this study have been deposited in the Gene Expression Omnibus The accession number for the data reported in this paper is [GEO]: GSE120500.