

Abstract
Objectives. To demonstrate how we applied the capture–recapture method for population estimation directly in a rural Appalachian county (Cabell County, WV) to estimate the number of people who inject drugs (PWID).
Methods. We conducted 2 separate 2-week periods of data collection in June (“capture”) and July (“recapture”) 2018. We recruited PWID from a syringe services program and in community locations where PWID were known to congregate. Participants completed a survey that included measures related to sociodemographics, substance use, and HIV and hepatitis C virus prevention.
Results. In total, 797 surveys were completed; of these surveys, 49.6% (n = 395) reflected PWID who reported injection drug use in the past 6 months and Cabell County residence. We estimated that there were 1857 (95% confidence interval = 1147, 2567) PWID in Cabell County. Among these individuals, most reported being White (83.4%), younger than 40 years (70.9%), and male (59.5%). The majority reported injecting heroin (82.0%), methamphetamine (71.0%), and fentanyl (56.3%) in the past 6 months.
Conclusions. Capture–recapture methods can be applied in rural settings to estimate the size of PWID populations.
The opioid epidemic has had far-reaching consequences across the United States. Provisional data suggest that more than 72 000 overdose fatalities occurred in 2017. Among these deaths, an estimated 49 068 involved opioids.1 This epidemic has had disproportionate impacts in rural communities. For example, in October 2017, the Centers for Disease Control and Prevention (CDC) announced that the rates of overdose fatalities in rural areas surpassed those of urban areas.2 The opioid epidemic has also fueled outbreaks of HIV and hepatitis C virus (HCV) infections among people who inject drugs (PWID). One such outbreak occurred in Scott County, Indiana, where 181 new cases of HIV were identified between November 2014 and October 2015.3 Ninety-two percent of these cases were coinfected with HCV. These new infections were linked to the injection of prescription opioids and syringe sharing.3,4
In the wake of the Scott County outbreak, 220 counties in 26 states were identified as vulnerable to similar outbreaks. Notably, predominantly rural states bore a disproportionate burden of risk vulnerability. For example, 28 of the 55 counties in West Virginia were identified as vulnerable to opioid injection–related HIV and HCV outbreaks.5 Considering the breadth of the opioid epidemic, it is imperative that communities implement response strategies that are scaled to meet population-level needs. Unfortunately, few areas have up-to-date information regarding the size and characteristics of local PWID populations; this creates significant challenges for strategic resource allocation (e.g., naloxone distribution programs, sterile injection equipment provision) and tailored program planning.
A variety of population estimation methodologies can be used to estimate the size of vulnerable populations.6 The capture and recapture (CRC) method has been widely used in public health, including among PWID, sex workers, and refugee populations.7–13 The CRC method can be applied directly via primary data collection with the target population or indirectly through use of existing data sources that contain members of the target population, such as disease registries and medical records.6 Direct applications of the CRC method involve 2 periods of data collection (the capture and recapture phases) in which members of the target population are counted. During the recapture phase, individuals who also participated in the capture phase are counted as “recaptures.” Count data for each study phase along with the number of recaptures can then be used to calculate a population size estimate.6 Although there are many examples of CRC methods being used to quantify the size and characteristics of vulnerable populations, most of these studies have used indirect approaches or occurred in urban environments.7,9–17 Little literature describes how this method can be applied directly in rural areas and among PWID populations.
This is an important gap in the research. Indirectly applying the CRC method in rural communities may be challenging because PWID are a hidden population and typically very few data sources (e.g., drug treatment registries) in rural communities can be used to calculate a population estimate. We have demonstrated how we applied direct CRC methods in a rural Appalachian community vulnerable to an opioid injection–related HIV and HCV outbreak (Cabell County, WV) to quantify the size and characteristics of the local PWID population.
METHODS
We conducted our CRC population estimation study in June and July 2018 in Cabell County, West Virginia. As of July 2017, there were an estimated 76 062 residents in Cabell County who were aged 18 years or older.18 Although Cabell County contains the city of Huntington, the US Census Bureau classifies 86.2% of its land space as rural.19 Cabell County also leads the state of West Virginia in heroin-related overdose fatalities and was identified as vulnerable to an HIV AND HCV outbreak.5,20
Strategic Partner
We partnered with the Cabell-Huntington Health Department (CHHD) to implement our CRC population estimation study. The CHHD serves Cabell County and the City of Huntington, West Virginia, as a combined county and municipal local health department. In 2015, the CHHD partnered with more than 30 local community agencies and organizations to decrease the societal and personal harms associated with opioid use. A primary role for the health department was in the creation of a harm-reduction program, including syringe access services. Since opening in September 2015, the Cabell-Huntington Harm Reduction Program (CHHRP) has served an estimated 5000 individuals, dispensed nearly 12 000 doses of naloxone, and referred hundreds of individuals to substance use disorder treatment (M. E. Kilkenny, e-mail communication, August 28, 2018). The CHHRP is housed at the CHHD and operates 6 hours per day (9:00 am to 3:00 pm), Monday through Friday. The CHHD was an ideal partner for our CRC study because of their existing relationships with the local PWID population, unique position as the only harm-reduction services provider in the county, and their ability to serve as a data collection site during the capture phase (e.g., at the CHHRP).
Inclusion Criteria
Before implementing our CRC population estimation study, we engaged the CHHD in discussions surrounding local experiences PWID may have with law enforcement, accessing health care services, engaging in research studies, and disclosing personal information (e.g., drug use). We also discussed these topics with local PWID and those in recovery. From these conversations, we determined that PWID would be most receptive to our study if all data were collected anonymously. Furthermore, we determined that people may be reluctant to disclose injection drug use during the screening process because of stigma. As a result, we set our inclusion criteria broadly: (1) to be at least 18 years old, and (2) to have ever used drugs by any route of administration.
Survey Administration
We collected data anonymously through audio computer-assisted self-interview in which questions and answers were read to participants (in a female voice) via headphones to reduce bias.21–23 Everyone approached for participation in the study received a verbal description of the study and were given the opportunity to ask questions. Staff then verbally screened those who expressed interest in participating for eligibility. The survey included a diversity of measures, including those related to sociodemographics, substance use, experiences with drug treatment, and HIV and HCV risk behaviors (e.g., syringe sharing).
Data Collection Procedures
Capture phase.
The capture phase occurred in June 2018 at the CHHRP and lasted 2 continuous weeks. We asked individuals who went to the CHHRP to participate in our study. Additionally, during the capture phase, the CHHD hosted a 1-day HIV testing event that was publicized at local community-based organizations frequented by PWID. We informed people who took part in the 1-day HIV testing event about our study, and we invited those who expressed interest to be screened for participation. During the capture phase, all participants received a bright green bag filled with snacks as an incentive for their participation.
Recapture phase.
The recapture phase focused on recruiting PWID from community locations where PWID congregate and commenced 2 weeks after the completion of the capture phase in July 2018. We identified recruitment locations via discussions with local stakeholders, including representatives from the CHHD, PWID who resided in Cabell County, and individuals in recovery who lived or worked in Cabell County. To supplement these data, we conducted a series of geospatial analyses to understand the relative distribution of injection drug use–related activities throughout Cabell County.
Using data provided by the West Virginia Department of Health and Human Resources, we created a heat map of overdose fatalities that occurred in 2016 in Cabell County. We created a heat map that reflected where the CHHD collected discarded syringes. We then reviewed publicly accessible media reports for mentions of drug crimes in Cabell County. We then analyzed location data from these reports, when available, in conjunction with the 2 heat maps to understand potential locations for participant recruitment. Collectively, these data sources afforded an in-depth understanding of where and when we could access the PWID population.
During the recapture phase, participants received a $10 grocery gift card as an incentive for their participation. Notably, participants completed the survey during the recapture phase at a variety of venues, including public parks, transit locations, green spaces, neighborhoods known for drug-related activities, parking lots (apartments and businesses), gas stations, homeless encampments, on the stoops of abandoned properties, and on sidewalks. Staff also provided participants with collapsible stools to sit on (when needed) and umbrellas for shade to improve participant comfort while completing the survey.
Identifying recounts.
To accurately calculate the population size estimate, the survey included items that ascertained whether the participant had previously completed the survey. During the capture phase, we asked participants, “Have you ever completed this survey before and received a bright green bag with food in it from the Cabell-Huntington Health Department?” In addition to this item, we asked participants in the recapture phase, “Have you ever completed this survey before and received a $10 gift card to Kroger [a local grocery]?” We identified those who endorsed previously receiving the green snack bag during the capture phase and those who endorsed having previously received a grocery gift card during the recapture phase as repeat phase participants and removed them from the analyses to avoid duplication. We categorized those who endorsed having received the green bag during the recapture phase as “recounts,” meaning individuals who completed the survey during the capture and recapture phase.
Analyses
We analyzed data using SAS version 9.3 (SAS Institute, Cary, NC). We completed calculations for the population estimate using Microsoft Excel (Microsoft Corp., Redmond, WA) and executed them in accordance with the World Health Organization (WHO) and Joint United Nations Programme on HIV and AIDS (UNAIDS) Guidelines on Estimating the Size of Populations Most at Risk to HIV.6 We limited analyses to PWID who indicated Cabell County residence and injection drug use in the past 6 months.
RESULTS
In total, 797 surveys were completed; of these surveys, 49.6% (n = 395) reflected PWID who reported injection drug use in the past 6 months and residence in Cabell County. Among these 395 surveys, we identified 21 recaptures and had to exclude 1 survey, as the tablet overheated and the participant was unable to answer items regarding his or her previous participation in the study, leaving 373 unique PWID (Table 1).
TABLE 1—
Summary of People Who Inject Drugs (PWID) Population Estimation Data by Study Phase and Associated PWID Population Estimate: Cabell County, West Virginia, June–July 2018
| No. of PWID in Cabell County | |
| Capture phase | 194 |
| Recapture phase | 201 |
| Total captures | 395 |
| Recaptures | 21 |
| Excludeda | 1 |
| Total unique PWID | 373 |
| Population estimate (95% CI) | 1857 (1147, 2567) |
Note. CI = confidence interval.
The tablet overheated, and so the participant was unable to answer items regarding his or her previous participation in the study.
Of those 373 unique PWID who resided in Cabell County, most reported being White (83.4%), younger than 40 years (70.9%), male (59.5%), single (52.7%), unemployed (66.0%), and having health insurance (73.2%). Additionally, 28.3% reported having never completed high school and 30.6% reported having been arrested in the past 6 months. Current living situations varied, with 36.7% living in a place they own or rent followed by 21.2% living on the street and 20.6% residing at a family or friends house. Despite their current living situation, most participants considered themselves homeless (57.1%) and reported having gone to bed hungry at least 1 night per week (64.3%). These results are summarized in Table 2.
TABLE 2—
Sociodemographics of People Who Inject Drugs (PWID) Residing in Cabell County, West Virginia: June–July 2018
| Characteristic | No. (%) |
| Race/ethnicity | |
| Non-Hispanic White | 302 (83.4) |
| Non-Hispanic Black | 9 (2.5) |
| Hispanic, any race | 24 (6.6) |
| Other | 27 (7.5) |
| Age, y | |
| 18–29 | 95 (25.5) |
| 30–39 | 169 (45.4) |
| 40–49 | 77 (20.7) |
| 50–59 | 28 (7.5) |
| ≥ 60 | 3 (0.8) |
| Gender | |
| Male | 222 (59.5) |
| Female | 151 (40.5) |
| Relationship status | |
| Single | 195 (52.7) |
| In a relationship/married | 175 (47.3) |
| Currently has health insurance | 273 (73.2) |
| Education | |
| Did not finish high school | 105 (28.3) |
| High school graduate or GED | 128 (34.5) |
| Some college | 91 (24.5) |
| Bachelor’s or associate’s degree | 33 (8.9) |
| Some graduate school | 14 (3.8) |
| Arrested in the past 6 mo | 114 (30.6) |
| Current living situation | |
| Place that you own or rent | 137 (36.7) |
| Family or friend’s home | 77 (20.6) |
| Shelter or other temporary housing | 34 (9.1) |
| On the street | 79 (21.2) |
| Other | 46 (12.3) |
| Considers self homeless | 213 (57.1) |
| Goes to bed hungry at least once per week | 240 (64.3) |
| Unemployed | 246 (66.0) |
Note. GED = general equivalency diploma. Denominator was n = 373.
Among PWID surveyed, mean age of first injection was 24.9 years (Table 3). On average, participants reported injecting 4.5 times per day. Drugs most commonly injected in the past 6 months were heroin (82.0%), methamphetamine (71.0%), and fentanyl (56.3%). For drugs used in other forms (swallowed, smoked, or snorted), prescription pain medications (63.5%), marijuana (63.3%), cocaine (59.2%), and methamphetamine (54.4%) were most reported. When asked where PWID had obtained sterile syringes in the past 6 months, the majority reported from a needle exchange (66.0%). However, large proportions of PWID reported having reused injection equipment they knew had been used by someone else in the past 6 months, specifically syringes (41.0%), cookers (44.0%), cottons (35.9%), and rinse water (41.6%). A majority (57.4%) also reported having ever accessed services at the CHHRP. Seventy-four percent reported having attempted to quit using drugs in the past 6 months.
TABLE 3—
Substance Use Measures Among People Who Inject Drugs (PWID) Residing in Cabell County, West Virginia: June–July 2018
| Variable | No. (%) |
| Age, y of injection initiation, mean (SD) | 24.9 (8.8) |
| No. of injections per d, mean (SD) | 4.5 (5.4) |
| Drugs injected, past 6 mo | |
| Heroin | 306 (82.0) |
| Methamphetamine | 265 (71.0) |
| Fentanyl | 210 (56.3) |
| Speedball (coinjection of heroin and cocaine) | 141 (37.8) |
| Cocaine | 132 (35.4) |
| Buprenorphine/Suboxone | 111 (29.8) |
| Prescription pain medications | 81 (21.7) |
| Noninjected drugs used, past 6 mo | |
| Prescription pain medications | 237 (63.5) |
| Marijuana | 236 (63.3) |
| Cocaine | 221 (59.2) |
| Methamphetamine | 203 (54.4) |
| Heroin | 121 (32.4) |
| Where obtained sterile syringes, past 6 mo | |
| From a needle exchange | 246 (66.0) |
| From a friend | 139 (37.3) |
| Bought from a person | 132 (35.4) |
| Bought from a store, pharmacy, or online | 51 (13.7) |
| Reused injection equipment used by someone else, past 6 mo | |
| Syringes | 153 (41.0) |
| Cookers | 164 (44.0) |
| Cottons | 134 (35.9) |
| Rinse water | 155 (41.6) |
| Attempted to quit using drugs in past 6 mo | 277 (74.3) |
| Ever accessed harm-reduction services at the CHHRP | 214 (57.4) |
Note. CHHRP = Cabell-Huntington Harm Reduction Program. Denominator was n = 373.
During the recapture phase, we identified 21 individuals as recapture PWID who completed the survey during both data collection phases and reported being Cabell County residents. To calculate the population estimate, we used the following formula (as outlined in the WHO and UNAIDS Guidelines on Estimating the Size of Populations Most at Risk to HIV6) in which C1 = capture phase count, C2 = recapture phase count, and M = recaptures:
 |
We also calculated a 95% confidence interval (CI) for the population estimate using the following formula6: 95% CI = N ± 1.96 √Var (N), where Var (N) is calculated as follows:
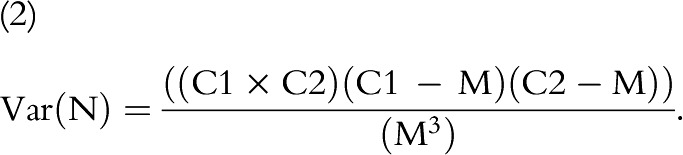 |
Substituting the number of PWID surveyed in the capture and recapture phases (C1 = 194 and C2 = 201, respectively) and the number of recaptures (M = 21) into the formulas above, we estimated a population of 1857 (95% CI = 1147, 2567) PWID who are also Cabell County residents. These data reflect an estimated 2.4% population prevalence of injection drug use in the past 6 months among Cabell County residents aged 18 years or older.
DISCUSSION
The results of our study demonstrate that direct CRC methods can be applied in rural Appalachia to estimate the size and characteristics of PWID populations. We estimated that approximately 1900 PWID reside in Cabell County, reflecting 2.4% of individuals aged 18 years or older. This research fills an important gap in the public health literature, as scant population-level data exist for rural PWID, particularly among those who reside in counties the CDC identified as vulnerable to an opioid injection–related HIV and HCV outbreak. These data are critically important for informing and tailoring opioid epidemic response strategies, as they provide insights into the number of PWID and their needs for services and current levels of access. For example, our finding that more than half of PWID reported injecting fentanyl can be used to inform naloxone distribution campaigns and other overdose prevention initiatives.
These data also have significant implications for HIV-prevention initiatives. Considering the recency with which harm-reduction services were implemented in Cabell County and the amount of time it takes to establish rapport and trust with PWID populations, the fact that most PWID reported having accessed harm-reduction services at the CHHRP is commendable. However, work remains to be done, as large proportions of PWID reported reusing injection equipment they knew had been used by someone else. Additionally, the high prevalence of heroin and methamphetamine injection could increase community-level vulnerability to an HIV outbreak, as research has shown that PWID who report injecting both drugs are more likely to inject with greater frequency and reuse syringes than are their counterparts who inject only heroin or only methamphetamine.24 Future work should explore how to further reduce risky injection practices among rural PWID, particularly those who inject both heroin and methamphetamine. Research should also be conducted to understand the factors driving the high prevalence of methamphetamine injection.
We learned several lessons throughout our application of CRC methods in this setting. Using heat maps of overdose fatalities and locations of syringe disposal was very useful in identifying specific locations where we may engage PWID in the community. Heat maps were also an unobtrusive strategy for garnering an understanding of the geotemporal distribution of PWID in the county. Stakeholder discussions about where and when to engage the target population were equally useful because of the fluidity of where and when PWID congregate. Relatedly, stakeholder discussions provided valuable insights into safety issues in each venue. We also learned that using multiple data sources is critically important to fully understanding the times and locations where PWID may be encountered and that 1 data source should not be considered superior, as each made unique contributions to our understanding of the geotemporal distribution of PWID.
In terms of systematically covering the identified areas for recruitment, we learned that providing staff with maps of relatively small, defined geographic areas was superior to providing them with specific walking directions based on street intersections, as staff found this method time consuming and often low yield if few people were in the target area. We also learned that when recruiting PWID in remote rural areas, it is useful to first conduct windshield tours of the target areas to determine whether they are viable areas for recruitment rather than sending out data collection teams. Additionally, we learned that recruiting PWID in very remote areas requires more time than does recruiting their counterparts in areas with public venues and shopping areas.
Branding our study in brightly colored T-shirts and related attire allowed rapid recruitment, as PWID were able to easily identify study staff. It also enhanced our ability to engage with PWID via word of mouth; for instance, individuals knew to look for people in bright green shirts or hats if they wanted to participate. In terms of data collection, participants reported to study staff that audio computer-assisted self-interview made them more comfortable than potentially answering the survey items verbally.
Limitations and Strengths
Our findings are not without limitations. Although we were able to estimate the number of PWID who reside in Cabell County, we were not able to ascertain the number of nonresident PWID who engage in activities in Cabell County. As a result, our population estimate should be viewed as an underestimate of the overall number of PWID in Cabell County. Because we collected data during periods of high heat and humidity, it is also possible some PWID were not surveyed, as they could have been in locations that were not readily accessible, such as inside air-conditioned homes. However, we feel this is a minor limitation considering the number of days and times we collected data. Additionally, although we generally found that people were highly receptive to participating in our study, a small number declined participation. A further limitation pertains to accessing portions of the PWID population who reside in very remote areas. A few locations were not viable areas for recruitment, as they lacked public venues, sidewalks, and other areas where we could reasonably interact with individuals. An additional limitation is that we were unable to ascertain how individuals knew they were using fentanyl; future work should explore whether individuals are intentionally seeking out fentanyl.
Despite these limitations, the study was characterized by numerous strengths. We were able to access a large number of PWID for this research, enhancing the representativeness of our findings. Our use of memorable incentives during each study phase allowed participants to easily remember whether they had previously engaged in our study. Relatedly, our study branding afforded expeditious dissemination of information about our study among the target population, as individuals learned from their peers to look for people in bright green shirts if they wanted to participate in the study. An additional strength of our study was our partnership with the CHHD. The CHHD has a long history of providing services to PWID and is a trusted entity among the population, allowing us to access PWID who may have otherwise been reluctant to participate.
Conclusions
Direct CRC methods can be applied in rural communities to estimate the size and characteristics of PWID populations. Our research fills an important gap in the public health literature because of the rapid expansion of the opioid epidemic into rural communities and lack of studies that explore how population estimation methods can be implemented in rural areas. Our findings provide important information about the local PWID population that can be used to guide policy discussions, allocate resources strategically, and scale up existing opioid epidemic response initiatives.
ACKNOWLEDGMENTS
This research was supported by the Bloomberg American Health Initiative at the Johns Hopkins Bloomberg School of Public Health. This research has been facilitated by the infrastructure and resources provided by the Johns Hopkins University Center for AIDS Research, a National Institutes of Health (NIH)–funded program (grant P30AI094189). S. T. Allen is also supported by the NIH (grant K01DA046234). K. E. Schneider is supported by the National Institute on Drug Abuse (grant 5T32DA007292-25).
We are grateful for the collaboration of the Cabell-Huntington Health Department, without which this project would not have been possible. We are especially grateful to Tim Hazelett, Thommy Hill, Tyler Deering, Kathleen Napier, Jeff Keatley, Michelle Perdue, Chad Helig, and Charles “CK” Babcock for all their support throughout the study implementation. We are also grateful for the hard work of the West Virginia COUNTS! research team: Megan Keith, Anne Maynard, Aspen McCorkle, Terrance Purnell, Ronaldo Ramirez, Kayla Rodriguez, Lauren Shappell, Brad Silberzahn, Dominic Thomas, Kevin Williams, and Hayat Yusuf. We gratefully acknowledge the West Virginia Department of Health and Human Resources. We also wish to acknowledge Josh Sharfstein, Michelle Spencer, Dori Henry, and Akola Francis for their support throughout each phase of the study. Most importantly, we are grateful to our study participants.
Note. The funders had no role in study design, data collection, or in analysis and interpretation of the results, and this article does not necessarily reflect views or opinions of the funders.
CONFLICTS OF INTEREST
None of the authors has any conflicts of interest.
HUMAN PARTICIPANT PROTECTION
The study was approved by the Johns Hopkins University institutional review board.
Footnotes
See also Pollini, p. 354.
REFERENCES
- 1.National Institute on Drug Abuse. Overdose death rates. 2018. Available at: https://www.drugabuse.gov/related-topics/trends-statistics/overdose-death-rates. Accessed September 20, 2018.
- 2.Centers for Disease Control and Prevention. Illicit drug use, illicit drug use disorders, and drug overdose deaths in metropolitan and nonmetropolitan areas—United States. MMWR Surveill Summ. 2017;66(19):1–12. doi: 10.15585/mmwr.ss6619a1. [DOI] [PMC free article] [PubMed] [Google Scholar]
- 3.Peters PJ, Pontones P, Hoover KW et al. HIV infection linked to injection use of oxymorphone in Indiana, 2014–2015. N Engl J Med. 2016;375(3):229–239. doi: 10.1056/NEJMoa1515195. [DOI] [PubMed] [Google Scholar]
- 4.Centers for Disease Control and Prevention Community outbreak of HIV infection linked to injection drug use of oxymorphone—Indiana 2015MMWR Morb Mortal Wkly Rep20156416443–444. [PMC free article] [PubMed] [Google Scholar]
- 5.Van Handel MM, Rose CE, Hallisey EJ et al. County-level vulnerability assessment for rapid dissemination of HIV or HCV infections among persons who inject drugs, United States. J Acquir Immune Defic Syndr. 2016;73(3):323–331. doi: 10.1097/QAI.0000000000001098. [DOI] [PMC free article] [PubMed] [Google Scholar]
- 6.UNAIDS/WHO Working Group on Global HIV/AIDS and STI Surveillance. Guidelines on Estimating the Size of Populations Most at Risk to HIV. Geneva, Switzerland: World Health Organization; 2010. pp. 1–48. [Google Scholar]
- 7.Hay G. Capture–recapture estimates of drug misuse in urban and non-urban settings in the north east of Scotland. Addiction. 2000;95(12):1795–1803. doi: 10.1046/j.1360-0443.2000.951217959.x. [DOI] [PubMed] [Google Scholar]
- 8.Holland CE, Kouanda S, Lougué M et al. Using population-size estimation and cross-sectional survey methods to evaluate HIV service coverage among key populations in Burkina Faso and Togo. Public Health Rep. 2016;131(6):773–782. doi: 10.1177/0033354916677237. [DOI] [PMC free article] [PubMed] [Google Scholar]
- 9.Roberts B, Morgan OW, Sultani MG et al. A new method to estimate mortality in crisis-affected and resource-poor settings: validation study. Int J Epidemiol. 2010;39(6):1584–1596. doi: 10.1093/ije/dyq188. [DOI] [PMC free article] [PubMed] [Google Scholar]
- 10.Mutagoma M, Kayitesi C, Gwiza A et al. Estimation of the size of the female sex worker population in Rwanda using three different methods. Int J STD AIDS. 2015;26(11):810–814. doi: 10.1177/0956462414555931. [DOI] [PMC free article] [PubMed] [Google Scholar]
- 11.Vuylsteke B, Vandenhoudt H, Langat L et al. Capture–recapture for estimating the size of the female sex worker population in three cities in Côte d’Ivoire and in Kisumu, western Kenya. Trop Med Int Health. 2010;15(12):1537–1543. doi: 10.1111/j.1365-3156.2010.02654.x. [DOI] [PubMed] [Google Scholar]
- 12.VanDerNagel JE, Kiewik M, Postel MG et al. Capture recapture estimation of the prevalence of mild intellectual disability and substance use disorder. Res Dev Disabil. 2014;35(4):808–813. doi: 10.1016/j.ridd.2014.01.018. [DOI] [PubMed] [Google Scholar]
- 13.Ruiz MS, O’Rourke A, Allen ST. Using capture–recapture methods to estimate the population of people who inject drugs in Washington, DC. AIDS Behav. 2016;20(2):363–368. doi: 10.1007/s10461-015-1085-z. [DOI] [PMC free article] [PubMed] [Google Scholar]
- 14.Hickman M, Cox S, Harvey J et al. Estimating the prevalence of problem drug use in inner London: a discussion of three capture–recapture studies. Addiction. 1999;94(11):1653–1662. doi: 10.1046/j.1360-0443.1999.941116534.x. [DOI] [PubMed] [Google Scholar]
- 15.Hickman M, Hope V, Platt L et al. Estimating prevalence of injecting drug use: a comparison of multiplier and capture–recapture methods in cities in England and Russia. Drug Alcohol Rev. 2006;25(2):131–140. doi: 10.1080/09595230500537274. [DOI] [PubMed] [Google Scholar]
- 16.Vaissade L, Legleye S. Capture–recapture estimates of the local prevalence of problem drug use in six French cities. Eur J Public Health. 2009;19(1):32–37. doi: 10.1093/eurpub/ckn126. [DOI] [PubMed] [Google Scholar]
- 17.Barocas JA, White LF, Wang J et al. Estimated prevalence of opioid use disorder in Massachusetts, 2011–2015: a capture–recapture analysis. Am J Public Health. 2018;108(12):1675–1681. doi: 10.2105/AJPH.2018.304673. [DOI] [PMC free article] [PubMed] [Google Scholar]
- 18.US Census Bureau. QuickFacts: Cabell County, West Virginia. 2017. Available at: https://www.census.gov/quickfacts/cabellcountywestvirginia. Accessed September 5, 2018.
- 19.US Census Bureau. 2010 census urban and rural classification and urban area criteria. 2012. Available at: https://www.census.gov/geo/reference/ua/urban-rural-2010.html. Accessed September 5, 2018.
- 20.West Virginia Department of Health & Human Resources. West Virginia Drug Overdose Deaths: Historical Overview 2001–2015. Charleston, WV: Bureau for Public Health; 2017. [Google Scholar]
- 21.Perlis TE, Des Jarlais DC, Friedman SR, Arasteh K, Turner CF. Audio-computerized self-interviewing versus face-to-face interviewing for research data collection at drug abuse treatment programs. Addiction. 2004;99(7):885–896. doi: 10.1111/j.1360-0443.2004.00740.x. [DOI] [PubMed] [Google Scholar]
- 22.Macalino GE, Celentano DD, Latkin C, Strathdee SA, Vlahov D. Risk behaviors by audio computer-assisted self-interviews among HIV-seropositive and HIV-seronegative injection drug users. AIDS Educ Prev. 2002;14(5):367–378. doi: 10.1521/aeap.14.6.367.24075. [DOI] [PubMed] [Google Scholar]
- 23.White B, Day C, Maher L. Self reported risk behaviour among injecting drug users: self versus assisted questionnaire completion. AIDS Care. 2007;19(3):441–447. doi: 10.1080/09540120701192837. [DOI] [PubMed] [Google Scholar]
- 24.Al-Tayyib A, Koester S, Langegger S, Raville L. Heroin and methamphetamine injection: an emerging drug use pattern. Subst Use Misuse. 2017;52(8):1051–1058. doi: 10.1080/10826084.2016.1271432. [DOI] [PMC free article] [PubMed] [Google Scholar]