

Abstract
We focused on defining the role of the E3 ligase NEDD4 in NSCLC cell afatinib resistance. Afatinib resistant H1975 clones over-expressed NEDD4 and c-MET compared to control clones and expressed less ERBB1, ERBB3, ERBB4 and PTEN than control clones. Knock down of NEDD4 enhanced the expression of PTEN, ERBB1/3/4 and c-MET. This was also associated with a ∼3-fold enhancement in both mTOR expression and mTOR phosphorylation and a ∼4-fold elevation in phospho-ULK-1 S757 levels. In the absence of NEDD4 or the autophagy regulatory protein Beclin1, neither the drug combination of [pemetrexed + sildenafil] nor the HDAC inhibitor sodium valproate was as capable of: reducing the expression of ERBB1/3/4; reducing phosphorylation of ULK-1 S757; or at enhancing the phosphorylation of ULK-1 S317 and ATG13 S318. [Pemetrexed + sildenafil] exposure, via autophagic degradation, reduced the expression of multiple HDACs. Reduced expression of Class I HDACs lowered the expression of ERBB1/3/4 and PTEN. Treatment of afatinib resistant clones lacking NEDD4 with [pemetrexed + sildenafil] or sodium valproate resulted in a weaker induction of autophagosome and autolysosome formation and with reduced cell killing. Knock down of NEDD4 reduced [pemetrexed + sildenafil] lethality; knock down of PTEN enhanced drug-induced killing. Combined knock down of NEDD4 and PTEN reduced the elevated amount of killing caused by PTEN knock down alone back to basal levels. Collectively, our data argue that NEDD4 plays an essential role in maintaining the afatinib-resistant phenotype in our resistant H1975 clones.
Keywords: autophagy, E3 ligase, PTEN, receptor tyrosine kinase
Introduction
It has recently been shown that the lung and ovarian cancer approved drug pemetrexed (Alimta®) interacts with phosphodiesterase 5 (PDE5) inhibitors such as sildenafil (Viagra) to cause endoplasmic reticulum stress PERK-eIF2α-dependent -induced down-regulation of cyto-protective proteins such as c-FLIP-s, MCL-1 and BCL-XL, as well as increasing Beclin1 expression [1, 2]. One component of killing was via increasing the levels of toxic autophagosomes. Another key component of cell killing was through the activation of extant death receptors (CD95) and PERK-eIF2α-CHOP -dependent increased expression of other death receptors (DR4, DR5). Knock down of CD95, DR4 and DR5 variably prevented the drug combination from killing.
Histone deacetylase (HDAC) enzymes regulate protein acetylation in the nucleus and in the cytoplasm [3]. In the companion manuscript, we discovered that HDAC inhibitors enhance [pemetrexed + sildenafil] lethality. Treatment of cells with [pemetrexed + sildenafil] reduced the expression of multiple HDAC proteins and knock down of these HDACs enhanced [pemetrexed + sildenafil] lethality, an effect that was associated with increased the expression of CerS6 and of the death receptor CD95 [4]. Knock down of CerS6 suppressed [pemetrexed + sildenafil] -induced activation of CD95 as judged by plasma membrane localization and by DISC formation. Pre-treatment of cells with the pan-nitric oxide synthase inhibitor L-NAME suppressed the CerS6-dependent increase in dihydro-ceramide levels. For effective activation, the death receptor CD95 must be tyrosine phosphorylated, and phosphatases are inhibited by high levels of ROS and RNS due to chemical modification of an essential reactive cysteine residue in their active sites. L-NAME, but not the ROS quenching agent N-acetyl cysteine, prevented [pemetrexed + sildenafil] -induced tyrosine phosphorylation of CD95. This was associated with L-NAME protecting the tyrosine phosphatase activity associated with CD95. Thus [pemetrexed + sildenafil] +/- HDAC inhibitor activates CD95 signaling through many overlapping biological events.
Previously, we have generated multiple afatinib resistant clones of mutant ERBB1 expressing H1975 NSCLC cells by a 4-day exposure of established tumors to the drug, which completely resolved the tumors, followed by collection of the subsequent re-grown tumors [5]. Afatinib-resistant H1975 clones were cross-resistant to the ERBB1/2/4 inhibitor lapatinib. Unlike cells made afatinib-resistant in vitro, our in vivo generated afatinib resistant clones: did not exhibit any additional mutations in proto- oncogenes when compared to control clones; expressed more CXCL-1, IL-8, NEDD4, c-KIT and c-MET; expressed less PTEN, ERBB1/3/4; and had increased basal SRC Y416 and ERBB3 Y1289 phosphorylation. Afatinib resistant clones were selectively killed, in contrast to vehicle treated parental clones, by knock down of [ERBB3 + c-MET + c-KIT].
The present studies were performed to understand the role of the E3 ligase neural precursor cell expressed developmentally down-regulated protein 4 (NEDD4) in the regulation of the afatinib-resistant phenotype in our H1975 clones. NEDD4 has been proposed to ubiquitinate PTEN and ERBB1/2/3/4 in a variety of models, which results in protein degradation and/or an altered intracellular localization [6-9]. NEDD4 is an essential gene for cell survival and is considered a proto-oncogene [10-12]. Our new findings demonstrate that knock down of NEDD4 restores the expression of PTEN and ERBB1/3/4 in afatinib resistant NSCLC cells and further enhances c-MET levels. Knock down of NEDD4 enhanced basal mTOR and ULK-1 phosphorylation and prevented [pemetrexed + sildenafil] +/- valproate from stimulating a toxic form of autophagy.
Materials and Methods
Materials
Pemetrexed, AR42 and sildenafil were purchased from Selleckchem (Houston, TX). Sodium valproate was from Sigma (St. Louis, MO). Trypsin-EDTA, DMEM, RPMI, penicillin-streptomycin were purchased from GIBCOBRL (GIBCOBRL Life Technologies, Grand Island, NY). All “H” series NSCLC lines were purchased from the ATCC and were not further validated beyond that claimed by ATCC. Cells were re-purchased every ∼6 months. ADOR cells were a gift to the Dent lab from a female NSCLC patient. Commercially available validated short hairpin RNA molecules to knock down RNA / protein levels were from Qiagen (Valencia, CA) (Figure S1). Reagents and performance of experimental procedures were described in refs: [1, 2, 4, 5].
Methods
Culture and in vitro exposure of cells to drugs
All cell linegs were cultured at 37 °C (5% (v/v CO2) in vitro using RPMI supplemented with dialyzed 5% (v/v) fetal calf serum and 10% (v/v) Non-essential amino acids. For short term cell killing assays, immune-staining studies, cells were plated at a density of 3 × 10³ per cm2 and 24h after plating treated with various drugs, as indicated. In vitro drug treatments were generally from a 100 mM stock solution of each drug and the maximal concentration of Vehicle carrier (VEH; DMSO) in media was 0.02% (v/v). Cells were not cultured in reduced serum media during any study in this manuscript.
Transfection of cells with siRNA or with plasmids
For Plasmids
Cells were plated and 24h after plating, transfected. Plasmids expressing a specific mRNA (or siRNA) or appropriate vector control plasm id DNA was diluted in 50μl serum-free and antibiotic-free medium (1 portion for each sample). Concurrently, 2μl Lipofectamine 2000 (Invitrogen), was diluted into 50μl of serum-free and antibiotic-free medium (1 portion for each sample). Diluted DNA was added to the diluted Lipofectamine 2000 for each sample and incubated at room temperature for 30 min. This mixture was added to each well / dish of cells containing 200μl serum-free and antibiotic-free medium for a total volume of 300 μl, and the cells were incubated for 4 h at 37 °C. An equal volume of 2× medium was then added to each well. Cells were incubated for 24h, then treated with drugs.
Transfection for siRNA
Cells from a fresh culture growing in log phase as described above, and 24h after plating transfected. Prior to transfection, the medium was aspirated and serum-free medium was added to each plate. For transfection, 10 nM of the annealed siRNA, the positive sense control doubled stranded siRNA targeting GAPDH or the negative control (a “scrambled” sequence with no significant homology to any known gene sequences from mouse, rat or human cell lines) were used. Ten nM siRNA (scrambled or experimental) was diluted in serum-free media. Four μl Hiperfect (Qiagen) was added to this mixture and the solution was mixed by pipetting up and down several times. This solution was incubated at room temp for 10 min, then added drop-wise to each dish. The medium in each dish was swirled gently to mix, then incubated at 37 °C for 2h. Serum-containing medium was added to each plate, and cells were incubated at 37 °C for 24h before then treated with drugs (0-24h). Additional immuno-fluorescence / live-dead analyses were performed at the indicated time points.
Detection of cell viability, protein expression and protein phosphorylation by immuno-fluorescence using a Hermes WiScan machine
http://www.idea-bio.com/, Cells (4 × 10³) are plated into each well of a 96 well plate, and cells permitted to attach and grow for the next 18h. Based on the experiment, after 18h, cells are then either genetically manipulated, or are treated with drugs. For genetic manipulation, cells are transfected with plasmids or siRNA molecules and incubated for an additional 24h. Cells are treated with vehicle control or with drugs at the indicated final concentrations, alone or in combination. Cells are then isolated for processing at various times following drug exposure. The 96 well plate is centrifuged / cyto-spun to associate dead cells (for live-dead assays) with the base of each well. For live dead assays, after centrifugation, the media is removed and cells treated with live-dead reagent (Thermo Fisher Scientific, Waltham MA) and after 10 min this is removed and the cells in each well are visualized in the Hermes instrument at 10× magnification. Green cells = viable; yellow/red cells = dying/dead. The numbers of viable and dead cells were counted manually from three images taken from each well combined with data from another two wells of separately treated cells (i.e. the data is the mean cell dead from 9 data points from three separate exposures). For immuno-fluorescence studies, after centrifugation, the media is removed and cells are fixed in place and permeabilized using ice cold PBS containing 0.4% paraformaldehyde and 0.5% Triton X-100. After 30 min the cells are washed three times with ice cold PBS and cells are pre-blocked with rat serum for 3h. Cells are then incubated with a primary antibody to detect the expression / phosphorylation of a protein (usually at 1:100 dilution from a commercial vendor) overnight at 37°C. Cells are washed three times with PBS followed by application of the secondary antibody containing an associated fluorescent red or green chemical tag. After 3h of incubation the antibody is removed and the cells washed again. The cells are visualized at either 10× or 60× in the Hermes machine for imaging assessments. All immunofluorescent images for each individual protein / phospho-protein are taken using the identical machine settings so that the levels of signal in each image can be directly compared to the level of signal in the cells treated with drugs. Similarly, for presentation, the enhancement of image brightness/contrast using PhotoShop CS6 is simultaneously performed for each individual set of protein/phospho-protein to permit direct comparison of the image intensity between treatments. Antibodies used include: HSP90 (E289) (Cell Signaling); HSP90 (#2928) (Abcam); HSP90 (ab195575) Abcam; HSP90 3G3 (13495) (Abcam); GRP78 (50b12) (31772) (Cell Signaling); GRP78 (ab191023) Abcam; GRP78 (ab103336) Abcam; GRP78 (N-20) (sc-1050) Santa Cruz; HSP27 (G31) (2402P) Cell Signaling); HSP27 [EP1724Y] (ab62339) Abcam; HSP27 (H-77) (sc-9012) Santa Cruz; HSP27 (LS-C31836) Lifespan science Corp. Other antibodies were as used in prior studies by the laboratory. All immunofluorescent images were initially visualized at 75 dpi using an Odyssey infrared imager (Li-Cor, Lincoln, NE), then processed at 9999 dpi using Adobe Photoshop CS6. For presentation, immunoblots were digitally assessed using the provided Odyssey imager software. Images have their color removed and labeled figures generated in Microsoft PowerPoint.
Assessment of autophagy
Cells were transfected with a plasmid to express a green fluorescent protein (GFP) and red fluorescent protein (RFP) tagged form of LC3 (ATG8). For analysis of cells transfected with the GFP-RFP-LC3 construct, the GFP/RFP-positive vesicularized cells were examined under the ×40 objective of a Zeiss Axiovert fluorescent microscope.
Data analysis
Comparison of the effects of various treatments (performed in triplicate three times) was using one-way analysis of variance and a two tailed Student's t-test. Differences with a p-value of < 0.05 were considered statistically significant. Experiments shown are the means of multiple individual points from multiple experiments (± SEM).
Results
Reduced ERBB1 expression in afatinib resistant H1975 clones is not due to altered expression of mutated p53
Previously, we have published that our clones of afatinib resistant H1975 cells express lower levels of ERBB1, ERBB3, ERBB4 and PTEN, and have elevated levels of the E3 ligase NEDD4 and of the receptor c-MET (Figure 1A) [5]. H1975 cells express a mutated p53 allele and many publications have demonstrated that mutated p53 can act in a non-canonical manner to increase the expression of ERBB1 [13-15]. Thus, it was possible that the reduced levels of ERBB1 were due to reduced levels of p53 in the H1975 cells. The expression of ERBB1 declined by ∼55% comparing parental wild type H1975 clones to their afatinib resistant counterparts (Figure 1B). The expression of p53, however, was increased in the afatinib resistant cells. Over a time-course, treatment of cells with [pemetrexed + sildenafil] reduced the protein levels of ERBB1 but did not change the expression of p53 (Figure 1C). Knock down of p53 did not alter the basal expression of ERBB1 or c-MET in the afatinib resistant clones (Figure 1D). Collectively, our data argue that the reduced expression of ERBB1 in the afatinib resistant clones is not related to changes in p53 function.
Figure 1. ERBB1 expression is not regulated by mutant p53 in afatinib resistant H1975 clones.

A Wild type parental and afatinib resistant H1975 clones, 24h after plating, were fixed in place. Immunofluorescence staining was performed to detect the total protein expression levels of ERBB1, ERBB3, ERBB4, c-SRC, PTEN and NEDD4. B. Wild type parental and afatinib resistant H1975 clones, 24h after plating, were fixed in place. Immunofluorescence staining was performed to detect the total protein expression levels of ERBB1 and p53 (n = 3 +/-SEM). *p < 0.05 lower than corresponding values in wild type parental cells; #p < 0.05 greater than corresponding values in wild type parental cells. C. Afatinib resistant H1975 clones were treated with vehicle control or with [pemetrexed (0.5 μM) + sildenafil (2.0 μM)] for 3h, 6h and 12h. At each time point cells were then fixed in place and the expression of ERBB1 and p53 determined by immunofluorescence. (n = 3 +/-SEM) * p < 0.05 less than corresponding intensity in vehicle cells. D. Afatinib resistant clones were transfected with a scrambled siRNA or an siRNA to knock down p53 expression. Twenty-four h after transfection, the cells were fixed in place and the total expression levels of PTEN, c-MET, ERBB1 and PDGFRβ determined.
Afatinib resistant H1975 clones have altered expression of HDACs that regulate receptor tyrosine kinase expression levels
If p53 was not regulating the expression of ERBB1, we next considered the premise that altered histone deacetylase function / expression may play a role in regulating ERBB1 levels. Thus, we next determined whether the expression of histone deacetylase (HDAC) enzymes was altered comparing the wild type and resistant clones, and whether this was responsible for the altered expression of ERBB1 and other growth factor receptors. We examined the levels of HDACs1-11 and determined that the expression levels of HDAC3 and HDAC10 were elevated in 5/5 afatinib resistant clones (Figure 2A). The expression levels of HDAC4, HDAC6 and HDAC7 were reduced in 5/5 afatinib clones. Previously, we had demonstrated that [pemetrexed + sildenafil] treatment reduced the expression of HDAC6 via autophagic degradation [1]. In a variety of NSCLC cells, [pemetrexed + sildenafil] variably reduced the expression of HDACs 1, 2, 3, 4, 5, 6, 8, 9, 10 and 11 (Figure 2B). As presented in the companion manuscript, degradation of HDACs was prevented by knock down of Beclin1, arguing that the expression of HDACs was being regulated via autophagy (data not shown).
Figure 2. Afatinib resistance and [pemetrexed + sildenafil] exposure alters the expression profile of histone deacetylase proteins.

A Wild type parental and afatinib resistant H1975 clones were, 24h after plating, fixed in place. Immunofluorescence staining was performed to determine the total protein expression of HDACs1-11 (n = 3 +/-SEM) *p < 0.05 less intensity of staining than corresponding values in wild type parental cells; #p < 0.05 greater than corresponding values in wild type parental cells. B. NSCLC cells were treated with vehicle control or with [pemetrexed (0.5 μM) + sildenafil (2.0 μM)] for 6h. Cells were fixed in place and immunofluorescence staining was performed to determine the total protein expression of HDACs1-11 (n = 3 +/-SEM) *p < 0.05 less intensity of staining than corresponding values in vehicle control cells.
We then determined the impact of [pemetrexed + sildenafil] on growth factor receptor expression and whether receptor levels change when molecularly manipulating HDAC inhibitor expression. Exposure of the afatinib resistant clones to [pemetrexed + sildenafil] reduced the expression of ERBB1, ERBB3, ERBB4 and c-MET (Figure 3A). Knock down of Beclin1 prevented the degradation of ERBB1 and ERBB3 but was largely ineffective at preventing the down-regulation of ERBB4 and c-MET. The knock down of HDAC1 / HDAC2 / HDAC3 / HDAC6 in a clone-dependent fashion reduced the protein expression of ERBB1, ERBB3, ERBB4 and c-MET (Figure 3B).
Figure 3. The regulation of receptor expression by HDACs and autophagy.
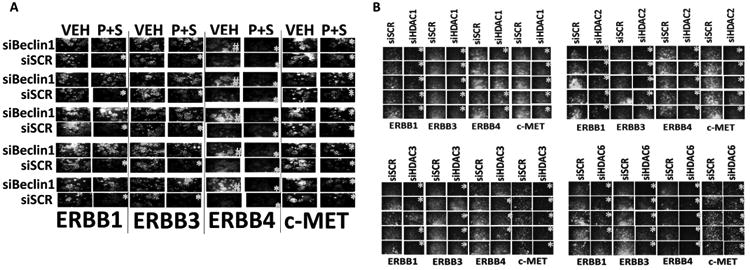
A Afatinib resistant H1975 clones were transfected with a scrambled siRNA control or with an siRNA to knock down Beclin1 expression. Twenty-four h after transfection cells were treated with vehicle control or with [pemetrexed (0.5 μM) + sildenafil (2.0 μM)] for 6h. Cells were fixed in place and immunofluorescence staining performed to determine the total expression of ERBB1, ERBB3, ERBB4 and c-MET (n = 3 +/-SEM) *p < 0.05 less than corresponding siSCR control value; #p < 0.05 greater than corresponding value in siSCR control. B. Afatinib resistant H1975 clones were transfected with a scrambled siRNA control or with siRNA molecules to knock down the expression of HDAC1, HDAC2, HDAC3 or HDAC6. Twenty-four h after transfection cells were fixed in place and immunofluorescence staining performed to determine the total expression of ERBB1, ERBB3, ERBB4 and c-MET (n = 3 +/-SEM) *p < 0.05 less than corresponding siSCR control value.
NEDD4 expression regulates the protein levels of receptor tyrosine kinases and PTEN
NEDD4 is an E3 ligase that has been proposed to ubiquitinate PTEN and down-regulate phosphatase expression. Thus, we next attempted to determine whether altered HDAC functionality also was responsible for the alterations in PTEN and NEDD4 expression observed in the resistant clones. The basal expression of PDGFRβ was enhanced by knock down of NEDD4 but no obvious change-in-expression pattern was observed for the PDGFRβ after sodium valproate exposure (Figure S2). In a stochastic fashion [pemetrexed + sildenafil] or treatment of the cells with sodium valproate modestly enhanced NEDD4 levels (Figure S3). Perhaps more significantly, the basal levels of NEDD4 were enhanced by knock down of Beclin1 and a trend was observed in all clones suggesting that [pemetrexed + sildenafil] and sodium valproate could enhance NEDD4 levels when autophagy was blocked. Treatment of the afatinib resistant clones with the pan-HDAC inhibitors sodium valproate or AR42 further reduced the expression of PTEN (Figure 4A). Knock down of Beclin1 prevented PTEN down-regulation, arguing this process too required autophagic degradation. Knock down of HDAC1, HDAC2 or HDAC3 reduced PTEN expression. Knock down of HDAC6, which is a cytoplasmic HDAC that regulates the functions of the chaperones HSP70 and HSP90, also significantly reduced PTEN levels (Figure 4B). Knock down of NEDD4, the E3 ligase proposed to ubiquitinate and down-regulate PTEN, whose expression is elevated in the resistant clones, increased basal PTEN expression (Figure 4C). Treatment of scramble control cells with [pemetrexed + sildenafil] reduced PTEN expression whereas the same drug treatment of NEDD4 knock down cells increased PTEN expression. This confirms and extends our understanding of the NEDD4-PTEN relationship.
Figure 4. Regulation of PTEN expression by HDACs and NEDD4.
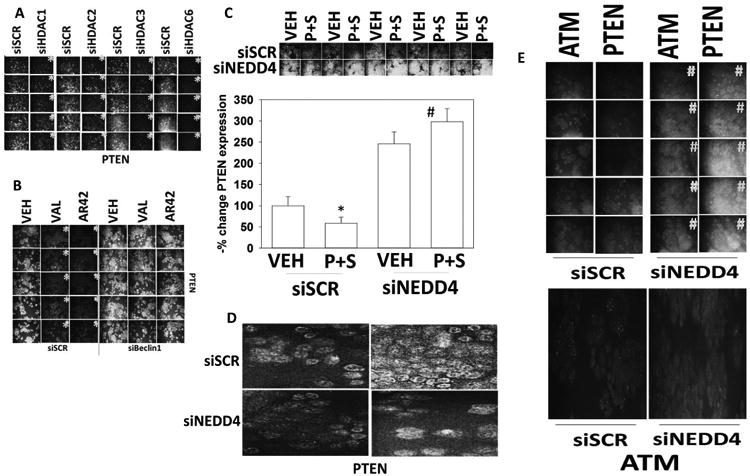
A Afatinib resistant H1975 clones were transfected with a scrambled control siRNA or siRNA molecules to knock down the expression of HDAC1, HDAC2, HDAC3 or HDAC6. Twenty-four h later cells were fixed in place and immunofluorescence staining was performed to determine the total protein expression of PTEN (n = 3 +/-SEM) *p < 0.05 less than corresponding values in siSCR control cells. B. Afatinib resistant H1975 clones were transfected with a scrambled control siRNA or an siRNA to knock down Beclin1 expression. Twenty-four h later cells were treated with vehicle control, sodium valproate (250 μM) or AR42 (600 nM) for 6h. Cells were fixed in place and the expression of PTEN determined (n = 3 +/-SEM) *p < 0.05 less than corresponding values in siBeclin1 cells. C. Afatinib resistant H1975 clones were transfected with a scrambled control siRNA or an siRNA molecule to knock down the expression of NEDD4. Twenty-four h later cells were fixed in place and the expression of PTEN determined (n = 3 +/-SEM) #p < 0.05 greater than corresponding values in siSCR control cells; *p < 0.05 less than corresponding values in control cells. D. Afatinib resistant clones were transfected with a scrambled control siRNA or an siRNA molecule to knock down the expression of NEDD4. Twenty-four h later cells were fixed in place and the localization of PTEN determined with DAPI staining to highlight the nucleus. E. Afatinib resistant clones were transfected with a scrambled control siRNA or an siRNA molecule to knock down the expression of NEDD4. Twenty-four h later cells were fixed in place and the expression of ATM and of PTEN determined. (n = 3 +/-SEM) #p < 0.05 greater than corresponding values in siSCR control cells. Lower: high contrast images demonstrating that ATM sating exhibited a punctate pattern in scramble control cells.
PTEN is known to localize in the plasma membrane environment and in the nucleus. Loss of PTEN increases oxidative stress, basal levels of DNA damage and enhances basal ataxia telangiectasia mutant (ATM) activity [16, 17]. Combined loss of PTEN and ATM is synthetically lethal, an effect which was abrogated by reactive oxygen species quenching agents. We previously demonstrated that the reactive nitrogen species caused by sildenafil treatment facilitated ATM activation [1]. NEDD4 is thought to regulate PTEN function via mono-ubiquitination which causes PTEN nuclear localization, and via poly-ubiquitination which targets cytoplasmic PTEN for proteolytic degradation [18, 19]. We then determined whether the nuclear localization of PTEN was altered by NEDD4 knock down in our afatinib resistant H1975 cells. In 2/5 clones knock down of NEDD4 did not alter PTEN nuclear localization (Figure 4D; Figure S4). In 2/5 clones knock down of NEDD4 did promote PTEN nuclear localization. In one clone, PTEN under basal conditions exhibited high levels of nuclear localization that was not modified by NEDD4 knock down.
Knock down of NEDD4 increased total ATM expression (Figure 4E, upper). Closer examination of the tumor cells revealed that in scramble control cells the staining for ATM was both diffuse and punctuate (Figure 4E, lower). In cells with reduced NEDD4 expression, although total PTEN expression had increased as judged by diffuse staining, the number of intense staining punctae for ATM was significantly reduced by 73 ± 9% (p < 0.05). Based on these findings, we determined whether knock down of NEDD4 altered ATM nuclear localization. In 3/5 clones, ATM was a predominantly nuclear protein and that remained so following NEDD4 knock down (Figure S4). In two of the clones, much of the ATM staining was peri-nuclear and that entered the nucleus following NEDD4 knock down. Thus, collectively, the data in Figures 2-4, and S2-S4 argues that there is a complex interplay between HDAC expression, signal transduction signaling protein levels, and the regulation of autophagosome function. The data also argue that reversible protein acetylation plays an essential role in regulating the protein levels of PTEN and NEDD4 in the afatinib resistant clones.
NEDD4 regulates the ability of [pemetrexed + sildenafil] to reduce the expression of receptor tyrosine kinases
We next investigated the impact of [pemetrexed + sildenafil] and of sodium valproate on the expression of growth factor receptors and phosphorylation of intermediate signaling proteins in the presence or absence of NEDD4. NEDD4 has been shown previously to regulate ERBB1/3/4 expression in tumor cells [20-22]. Knock down of NEDD4 strongly enhanced the expression of ERBB1 and significantly increased the expression of ERBB3, ERBB4 and c-MET (Figure 5). Treatment of scramble siRNA control cells with [pemetrexed + sildenafil] or sodium valproate reduced the expression of ERBB1, ERBB3, ERBB4 and c-MET, with the [pemetrexed + sildenafil + valproate] combination being most effective (data not shown). In the absence of NEDD4 the ability of sodium valproate to reduce the expression of ERBB1, ERBB3, ERBB4 and c-MET was significantly reduced. Identical findings were made using [pemetrexed + sildenafil + valproate] (data not shown).
Figure 5. NEDD4 regulates the expression of growth factor receptors.

Afatinib resistant H1975 clones were transfected with a scrambled control siRNA or an siRNA to knock down the expression of NEDD4. Twenty-four h later cells were treated with vehicle control, [pemetrexed (0.5 μM) + sildenafil (2.0 μM)] or sodium valproate (250 μM). After 6h, cells were fixed in place and immunofluorescence staining performed to determine the total expression of ERBB1, ERBB3, ERBB4 and c-MET (n = 3 +/-SEM) *p < 0.05 less than siSCR + vehicle control value; #p < 0.05 greater than siSCR + vehicle control value; ¶ p < 0.05 greater than corresponding value in siSCR transfected cells.
As noted previously, the expression of PTEN was elevated in cells lacking NEDD4 (Figure 6). Knock down of NEDD4 significantly reduced the ability of sodium valproate to reduce PTEN levels. Although knock down of NEDD4 increase PTEN protein levels, it also caused a decline in PTEN S380 phosphorylation. Phosphorylation of PTEN at serine 380 has been proposed to inactivate PTEN, and thus our findings imply that loss of NEDD4 simultaneously increases PTEN levels and that this PTEN protein has a higher specific activity than the PTEN protein in control transfected cells. Despite this change in PTEN expression and specific activity, the basal phosphorylation level of AKT T308 following NEDD4 knock down did not appear to significantly decrease. A similar finding of little alteration in phosphorylation was made for ERK1/2.
Figure 6. NEDD4 regulates PTEN expression and PTEN phosphorylation.
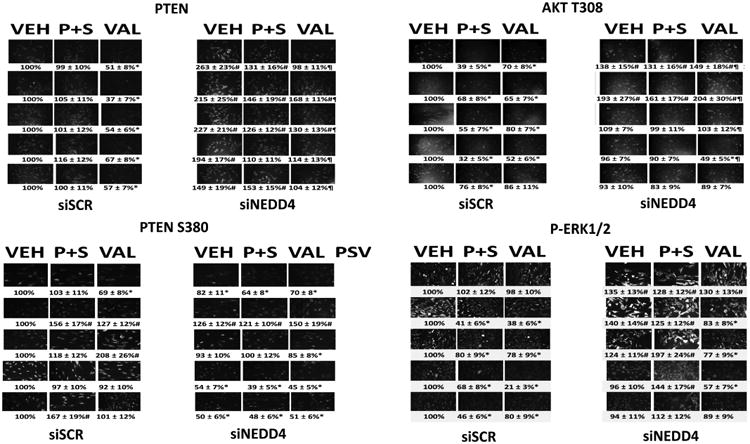
Afatinib resistant H1975 clones were transfected with a scrambled control siRNA or an siRNA to knock down the expression of NEDD4. Twenty-four h later cells were treated with vehicle control, [pemetrexed (0.5 μM) + sildenafil (2.0 μM)] or sodium valproate (250 μM). After 6h, cells were fixed in place and immunofluorescence staining performed to determine the total expression of PTEN, and the phosphorylation of PTEN S380, AKT T308 and ERK1/2 (n = 3 +/-SEM) *p < 0.05 less than siSCR + vehicle control value; #p < 0.05 greater than siSCR + vehicle control value; ¶ p < 0.05 greater than corresponding value in siSCR transfected cells.
NEDD4 expression preferentially regulates mTOR expression and activity compared to AKT or ERK1/2
Downstream from PTEN, AKT and ERK1/2 are the kinases mTOR and p70 S6K. Loss of NEDD4 significantly increased the total protein levels of mTOR and of p70 S6K (Figure 7). In some clones, the specific activity of mTOR increased, and in others slightly declined, however, the overall trend in cells lacking NEDD4 was for greater mTORC1 (S2448) and mTORC2 (S2481) total activity. The expression and phosphorylation of p70 S6K was enhanced in cells lacking NEDD4, with an approximate 3-fold increase in p70 S6K specific activity. The regulation of autophagosome formation by mTOR proceeds via its negative regulation of the kinase ULK-1 via serine 757 phosphorylation. Metabolic stress and DNA damage can both enhance autophagosome formation by activating the AMPK which phosphorylates ULK-1 at serine 317, thereby enhancing ULK-1 activity against its substrate, ATG13 serine 318. Knock down of NEDD4 strong enhanced the basal levels of ULK-1 S757 phosphorylation but did not alter the basal phosphorylation of ULK-1 S317 (Figure 8).
Figure 7. NEDD4 regulates the protein expression levels of mTOR and p70 S6K.

Afatinib resistant H1975 clones were transfected with a scrambled control siRNA or an siRNA to knock down the expression of NEDD4. Twenty-four h later cells were treated with vehicle control, [pemetrexed (0.5 μM) + sildenafil (2.0 μM)] or sodium valproate (250 μM). After 6h, cells were fixed in place and immunofluorescence staining performed to determine the total expression of mTOR and p70 S6K, and the phosphorylation of mTOR S2448, mTOR S2481 and p70 S6K T389 (n = 3 +/-SEM) *p < 0.05 less than siSCR + vehicle control value; #p < 0.05 greater than siSCR + vehicle control value; ¶ p < 0.05 greater than corresponding value in siSCR transfected cells.
Figure 8. NEDD4 prevents activation of the ULK-1-ATG13 autophagy pathway.

Afatinib resistant H1975 clones were transfected with a scrambled control siRNA or an siRNA to knock down the expression of NEDD4. Twenty-four h later cells were treated with vehicle control, [pemetrexed (0.5 μM) + sildenafil (2.0 μM)] or sodium valproate (250 μM). After 6h, cells were fixed in place and immunofluorescence staining performed to determine the phosphorylation of ULK-1 S757, ULK-1 S317, ATG13 S318 and AMPK T172 (n = 3 +/-SEM) *p < 0.05 less than siSCR + vehicle control value; #p < 0.05 greater than siSCR + vehicle control value; ¶ p < 0.05 greater than corresponding value in siSCR transfected cells.
NEDD4 knock down variably increased or decreased ULK-1 protein levels whilst it had no effect on the expression of ERK1/2 (Figure S5A). The ability of [pemetrexed + sildenafil] or sodium valproate to decrease the phosphorylation ULK-1 S757 was significantly reduced in cells lacking NEDD4, which correlated with a reduced ability of the drugs to stimulate ATG13 S318 phosphorylation. Loss of NEDD4 also prevented both treatments from stimulating AMPK T172 and ULK-1 S317 phosphorylation, which we previously demonstrated is essential to cause a robust increase in ATG13 S318 phosphorylation and autophagy-dependent cell killing [1]. The expression of the AMPK alpha subunit was modestly reduced by NEDD4 knock down (Figure S5B). However, the ability of [pemetrexed + sildenafil] to increase AMPKα expression and enhance AMPK specific activity was largely abolished by NEDD4 knock down. We have previously shown that [pemetrexed + sildenafil] exposure activates ataxia telangiectasia mutant (ATM) which enhances AMPK T172 phosphorylation, and in this manuscript, that knock down of NEDD4 reduces the numbers and staining intensity of punctate ATM nuclear foci (Figure 4D) [1]. Knock down of NEDD4 or [pemetrexed + sildenafil] treatment increased total ATM expression but prevented [pemetrexed + sildenafil] from strongly increasing ATM S1981 phosphorylation in comparison to siSCR cells (Figure S6). Similar data were obtained examining the phosphorylation of another ATM substrate, γH2AX (data not shown).
Treatment of cells with [pemetrexed + sildenafil] was previously shown to cause an endoplasmic reticulum stress response, with increased eIF2α phosphorylation leading to an elevation in Beclin1 levels, that facilitates autophagosome formation [1]. Knock down of NEDD4 did not alter the ability of [pemetrexed + sildenafil] or sodium valproate from enhancing eIF2α S51 phosphorylation or from promoting Beclin1 expression (Figure 9). NEDD4 knock down, however, suppressed the abilities of [pemetrexed + sildenafil], sodium valproate, and the three-drug combination from increasing autophagosome levels. In slight contrast, loss of NEDD4 reduced the abilities of [pemetrexed + sildenafil] and [pemetrexed + sildenafil + valproate] to increase autolysosome levels but did not alter the drug-induced increase in autolysosome levels caused by sodium valproate.
Figure 9. NEDD4 does not block the drug-induced increase in Beclin1 expression but suppresses autophagosome formation. Upper.

Afatinib resistant H1975 clones were transfected with a scrambled control siRNA or an siRNA to knock down the expression of NEDD4. Twenty-four h later cells were treated with vehicle control, [pemetrexed (0.5 μM) + sildenafil (2.0 μM)] or sodium valproate (250 μM). After 6h, cells were fixed in place and immunofluorescence staining performed to determine the total expression of Beclin1 and the phosphorylation of eIF2α S51 (n = 3 +/-SEM) *p < 0.05 less than siSCR + vehicle control value; #p < 0.05 greater than siSCR + vehicle control value; ¶ p < 0.05 greater than corresponding value in siSCR transfected cells. Lower: Afatinib resistant H1975 clones were transfected with a scrambled control siRNA or an siRNA to knock down the expression of NEDD4. In parallel, all cells were transfected with a plasmid to express LC3-GFP-RFP. Twenty-four h after transfection cells were treated with vehicle control, [pemetrexed (0.5 μM) + sildenafil (2.0 μM)], sodium valproate (250 μM), or the three drugs in combination. Six h and 12h after drug exposure cells were examined at 60× magnification and the mean number of GFP+ and RFP+ punctae per cell under each condition determined. *p < 0.05 less than corresponding value in siSCR transfected cells.
NEDD4 and PTEN reciprocally regulate the ability of [pemetrexed + sildenafil] to kill
Ultimately, the objective of our studies was to define whether the elevated NEDD4 expression observed in the afatinib resistant clones was causal in their afatinib resistant phenotype (Table 1 and Table 2). Afatinib resistant clones were more effectively killed by [pemetrexed + sildenafil] and by sodium valproate than parental wild type H1975 clones. In contrast, and in agreement with our autophagy data, knock down of NEDD4 reduced the killing power of both treatments. In prior pre-clinical and clinical studies combining pemetrexed with the multi-kinase and chaperone inhibitor sorafenib we counter-intuitively discovered that cells expressing low levels of PTEN were more sensitive to being killed by the drug combination [23, 24]. In more recent studies we went on to determine that over-expression of PTEN reduced the lethality of [pemetrexed + sildenafil] [1]. Knock down of NEDD4 also reduced the lethality of [pemetrexed + sildenafil] (Table 3). However, combined knock down of PTEN and NEDD4 partially rescued the drug-sensitive phenotype, restoring [pemetrexed + sildenafil] lethality to near those levels found in scrambled control transfected cells. Collectively, the data argues that NEDD4-dependent regulation of PTEN expression plays an important role in regulating [pemetrexed + sildenafil] lethality.
Table 1. Afatinib resistant H1975 clones are more effectively killed by [pemetrexed + sildenafil] and sodium valproate than parental wild type clones.
H1975 clones (wild type parental; afatinib resistant) were treated with vehicle control, [pemetrexed (0.5 μM) + sildenafil (2.0 μM)] or sodium valproate (250 μM). Twenty-four h after treatment, cell viability was determined via live/dead assays (n = 3 +/-SEM)
| 24h | VEH | P+S | VAL | VEH | P+S | VAL |
|---|---|---|---|---|---|---|
| Death% | 1 | 15 ± 3.1 | 12 ± 2.6 | 1 | 43 ± 5.2¶ | 38 ± 4.5¶ |
| Death% | 1 | 13 ± 2.9 | 7 ± 1.5 | 2 | 32 ± 4.1¶ | 47 ± 5.6¶ |
| Death% | 1 | 8 ± 2,0 | 10 ± 1.8 | 2 | 49 ± 5.9¶ | 27 ± 3.0¶ |
| Death% | 1 | 12 ± 2.7 | 6 ± 1.1 | 1 | 30 ± 3.4¶ | 35 ± 4.4¶ |
| Death% | 1 | 23 ± 3.6 | 18 ± 3.0 | 1 | 50 ± 6.3¶ | 31 ± 3.7¶ |
| Parental H1975 | Afatinib-R H1975 | |||||
p < 0.05 greater than values in wild type parental clones.
Table 2. Reduced NEDD4 expression correlates with reduced [pemetrexed + sildenafil] lethality.
Afatinib resistant H1975 clones were transfected with a scrambled control siRNA or an siRNA to knock down the expression of NEDD4. Twenty-four h later cells were treated with vehicle control, [pemetrexed (0.5 μM) + sildenafil (2.0 μM)] or sodium valproate (250 μM). Twenty-four h after treatment, cell viability was determined via live/dead assays (n = 3 +/-SEM)
| 24h | VEH | P+S | VAL | VEH | P+S | VAL |
|---|---|---|---|---|---|---|
| Death% | 1 | 28 | 11 | 1 | 12 ± 2.2* | 16 ± 3.1 |
| Death% | 1 | 33 | 35 | 1 | 19 ± 3.0* | 24 ± 3.3* |
| Death% | 1 | 24 | 15 | 1 | 25 ± 3.5 | 18 ± 2.7 |
| Death% | 1 | 41 | 19 | 1 | 14 ± 2.1* | 23 ± 3.0* |
| Death% | 1 | 35 | 50 | 1 | 19 ± 2.6* | 22 ± 2.8* |
| Afat-R | siSCR | siNEDD4 | ||||
p < 0.05 less than values in wild type parental clones.
Table 3. NEDD4 regulates [pemetrexed + sildenafil] lethality in part by modulating PTEN expression.
Afatinib resistant H1975 clones were transfected with a scrambled control siRNA or an siRNA to knock down the expression of NEDD4. In parallel the clones were transfected with a scrambled control siRNA or an siRNA to knock down the expression of PTEN. Twenty-four h later cells were treated with vehicle control or [pemetrexed (0.5 μM) + sildenafil (2.0 μM)]. Twenty-four h after treatment, cell viability was determined via live/dead assays (n = 3 +/-SEM)
| 24h | VEH | P+S | VEH | P+S | VEH | P+S | VEH | P+S |
|---|---|---|---|---|---|---|---|---|
| Death% | 1 | 38 ± 5.0 | 1 | 7 ± 1.6* | 1 | 78 ± 9.8# | 1 | 46 ± 5.3¶ |
| Death% | 1 | 35 ± 4.0 | 1 | 5 ± 0.8* | 1 | 56 ± 6.7# | 1 | 34 ± 4.2¶ |
| Death% | 1 | 36 ± 3.7 | 1 | 11 ± 2.0* | 1 | 50 ± 6.3# | 1 | 43 ± 4.8¶ |
| Death% | 1 | 45 ± 3.9 | 1 | 15 ± 2.5* | 1 | 66 ± 6.9# | 1 | 44 ± 4.1¶ |
| Death% | 1 | 34 ± 4.8 | 1 | 13 ± 2.1* | 1 | 58 ± 6.8# | 1 | 30 ± 3.6¶ |
| Afat-R | siSCR siSCR | SJNEDD4 SiSCR | siSCR siPTEN | siNEDD4 siPTEN | ||||
p < 0.05 less than values in siSCR + siSCR cells;
p < 0.05 greater than values in siSCR + siSCR cells;
p < 0.05 less than values in siSCR + siPTEN cells.
Finally, we determined whether altered NEDD4 expression could modify the afatinib resistant phenotype and whether the NEDD4-dependent regulation of PTEN expression played a role in altering the sub-cellular localization of the CD95 inhibitory tyrosine phosphatase PTPN13. Knock down of NEDD4 enhanced the killing power of afatinib in 5/5 afatinib resistant cells (Figure 10A). NEDD4 knock down enhanced the basal expression levels of the death receptor CD95 and the tyrosine phosphatase that inactivates CD95, PTPN13 (Figure 10B). In scramble control cells, [pemetrexed + sildenafil] reduced the expression of PTPN13 whereas in cells transfected to knock down NEDD4 expression [pemetrexed + sildenafil] elevated PTPN13 levels. NEDD4 regulates PTEN expression, and knock down of PTEN enhanced the basal and [pemetrexed + sildenafil]-stimulated plasma membrane localization of CD95 at 10× magnification (Figure 10C). In cells lacking NEDD4, that express higher levels of PTEN, the basal cell surface levels of CD95 was increased but [pemetrexed + sildenafil] was unable to stimulate further CD95 localization in the plasma membrane (Figure 10D). In scrambled control transfected cells, CD95 and PTPN13 were shown to co-localize, and following [pemetrexed + sildenafil] treatment, the levels of PTPN13 declined, and in some clones, there was a reduced co-localization of PTPN13 with CD95 (Figure S7). Knock down of PTEN did not significantly alter the total amount of cellular PTPN13 nor the co-localization of PTPN13 with CD95. However, in drug treated cells with PTEN knock down, the expression of PTPN13 increased and the co-localization of CD95 with PTPN13 was unaltered.
Figure 10. NEDD4 regulates the afatinib resistant phenotype.
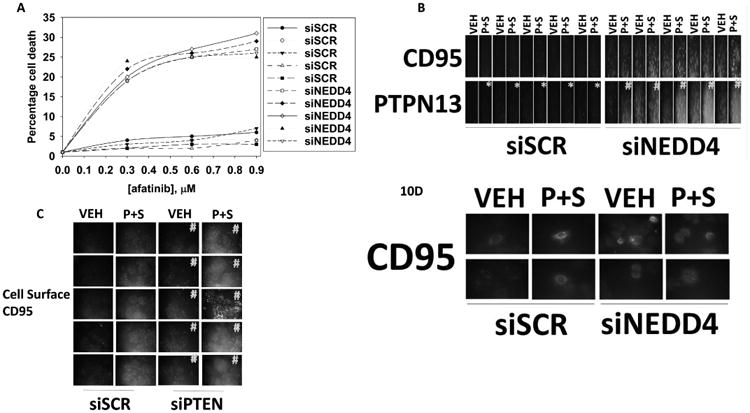
A Afatinib resistant H1975 clones were transfected with a scrambled siRNA or an siRNA to knock down NEDD4 expression. Twenty-four h after transfection cells were treated for 12h with vehicle control or afatinib (1 μM). Cell viability was determined by live / dead assay. The mean percentage of cell death for each clone is presented (n = 3 +/-SEM) # p < 0.05 greater than corresponding value in siSCR cells. B. Afatinib resistant H1975 clones were transfected with a scrambled siRNA or an siRNA to knock down NEDD4 expression. Twenty-four h after transfection cells were treated for 6h with vehicle control or with [pemetrexed (0.5 μM) + sildenafil (2.0 μM)]. The total expression of CD95 and of PTPN13 was determined under each condition (n = 3 +/-SEM) *p < 0.05 less than vehicle control value; # p < 0.05 greater than vehicle control value. C. Afatinib resistant H1975 clones were transfected with a scrambled siRNA or an siRNA to knock down PTEN expression. Twenty-four h after transfection cells were treated for 6h with vehicle control or with [pemetrexed (0.5 μM) + sildenafil (2.0 μM)]. The total expression of CD95 in the plasma membrane (unpermeabilized cells) was determined under each condition (n = 3 +/-SEM) # p < 0.05 greater than corresponding value in siSCR cells. D. Afatinib resistant H1975 clones were transfected with a scrambled siRNA or an siRNA to knock down NEDD4 expression. Twenty-four h after transfection cells were treated with vehicle control or with [pemetrexed (0.5 μM) + sildenafil (2.0 μM)] for 6h. The total and cell surface levels of CD95, and the levels of PTPN13 were determine by immunofluorescence staining. (n = 3 +/-SEM) *p < 0.05 less than vehicle control value; # p < 0.05 greater than vehicle control value.
Discussion
The present studies were initially proposed to determine whether the E3 ligase NEDD4, previously shown by ourselves to be over-expressed in afatinib resistant H1975 cells, and shown by others to be a proto-oncogene, played a key role in regulating the afatinib resistant phenotype in H1975 cells.
Loss of NEDD4 expression elevated the levels of PTEN and of growth factor receptors but did not significantly alter AKT T308 phosphorylation. Phosphatases have approximately an order of magnitude greater catalytic activity than kinases and thus it would be predicted that enhanced PTEN levels, particularly when also dephosphorylated at S380, would significantly reduce AKT T308 phosphorylation. Our findings suggest that the increased expression of multiple receptor tyrosine kinases balances with the elevated expression and activity of PTEN to generate a null outcome at the level of regulatory AKT phosphorylation. Nevertheless, reduced NEDD4 expression significantly enhanced the lethality of afatinib in the afatinib-resistant clones.
Downstream of AKT, the enhanced levels of mTORC1 S2448 and mTORC2 S2481 phosphorylation observed in cells lacking NEDD4 were in large part due to the total protein expression of mTOR being enhanced and not due to any profound increase in mTORC1 / mTORC2 specific activity. In the regulation of autophagosome formation, ULK-1 lies downstream of mTOR. In some clones with NEDD4 knock down, the total expression of ULK-1 was increased whereas in other clones the expression remained largely unchanged or decreased. However, in all clones with NEDD4 knock down, the phosphorylation of ULK-1 S757 (moles per mole) was strongly enhanced, in agreement with the overall increase in mTOR signaling. ULK-1 is also positively regulated by AMPK-dependent phosphorylation at amino acid S317. Knock down of NEDD4 did not alter the basal phosphorylation of either ULK-1 S317 or AMPK T172, but prevented the phosphorylation levels of both sites from being altered when cells were treated with pemetrexed, sildenafil and/or valproate. Our prior studies with [pemetrexed + sildenafil] had demonstrated that this drug combination enhanced AMPK T172 phosphorylation by activation of ATM. In cells with NEDD4 knock down, although the total diffuse staining for ATM was increased, the number of intense staining punctate ATM staining bodies was reduced, and [pemetrexed + sildenafil] could not stimulate ATM S1981 or γH2AX phosphorylation. The precise reasons for NEDD4 regulating the phosphorylation and expression of ATM and of AMPKα will require studies beyond the scope of the present manuscript.
One surprising observation we made previously was that the drug combinations of [pemetrexed + sorafenib] and [pemetrexed + sildenafil] preferentially killed cells with low or no PTEN function. In the case of [pemetrexed + sorafenib], these findings were corroborated in responsive patient tumors from a phase I trial that were shown to express low or no PTEN expression. Knock down of NEDD4 partially reverted the afatinib resistant phenotype which correlated to an increase in PTEN expression. This data agrees with the well-described concept that loss of PTEN results in drug-resistant tumor cells. In contrast to the afatinib data, knock down of NEDD4 reduced the lethality of [pemetrexed + sildenafil], a lethality that was restored by knock down of PTEN.
Collectively this information raised the question as to why our drug combinations using pemetrexed preferentially kill cells lacking PTEN. Many drugs developed to inhibit one target also have secondary off-target effects that nevertheless may play key roles in the efficacy of the drug. In the case of pemetrexed, although the drug was developed as an inhibitor of thymidylate synthase, the drug was also shown to inhibit the enzyme phosphoribosyl-aminoimidazole-carboxamide transformerase (AICART) [25, 27]. Inhibition of TS reduces pyrimidine production and inhibition of AICART reduces purine production. Obviously, cells with reduced pyrimidine and purine levels will contain more damaged DNA and less RNA. We discovered that the DNA damage signal caused by pemetrexed, i.e. ATM activation, was amplified by sildenafil-induced nitric oxide production to cause AMPK activation via increased T172 phosphorylation. However, inhibition of AICART also causes the buildup of a substrate of the AICART reaction, phosphorylated AICAriboside (ZMP). ZMP allosterically activates the AMPK. Whilst we have published that sildenafil can enhance the lethality of many DNA damaging agents, the lethality of these agents is known to be reduced in cells lacking PTEN [27-29]. And, unlike pemetrexed, none of the other DNA damaging agents we have previously tested have the capacity to generate ZMP and cause complete AMPK activation by both phosphorylation and allosteric mechanisms.
Thus, it appears that the ability of pemetrexed to potently activate AMPK signaling via two mechanisms may be a reason why pemetrexed is more efficacious in cells with low PTEN levels. In cells with low / no PTEN function, the phosphorylation of AKT-mTOR-ULK-1 S757 would be predicted to be very high, and thus ATG13 S318 phosphorylation and autophagosome formation to be low. Prolonged intense AMPK signaling will cause mTOR inactivation, which is below the level of PTEN in the AKT-mTOR signal transduction pathway, and stimulate ULK-1 S317 phosphorylation. This will rapidly increase ATG13 S318 phosphorylation and cause autophagosome formation. Autophagy has been shown by other groups to often act as a protective response to DNA damaging chemotherapy [30-32]. If we consider the probability that the role of autophagy in the response of a tumor cell to any agent will be governed by the duration of the autophagosome formation stimulatory signal, the degree of autophagic flux, and the final lysosome rupture process, then it is possible to envisage pemetrexed as a unique drug which is capable of strongly stimulating autophagosome formation as a single agent. Hence the addition of any other agent that can enhance AMPK activation, e.g. sildenafil, or promote endoplasmic reticulum stress signaling, e.g. valproate, will likely cause an overwhelming induction of autophagosomes that results in tumor cell death.
Supplementary Material
Acknowledgments
Support for the present study was funded from philanthropic funding from Massey Cancer Center, the Universal Inc. Chair in Signal Transduction Research and PHS R01-CA192613. Thanks to Dr. H.F. Young and the Betts family fund for support in the purchase of the Hermes Wiscan instrument.
Abbreviations
- ERK
extracellular regulated kinase
- PI3K
phosphatidyl inositol 3 kinase
- ca
constitutively active
- dn
dominant negative
- ER
endoplasmic reticulum
- mTOR
mammalian target of rapamycin
- JAK
Janus Kinase
- STAT
Signal Transducers and Activators of Transcription
- MAPK
mitogen activated protein kinase
- PTEN
phosphatase and tensin homologue on chromosome ten
- ROS
reactive oxygen species
- CMV
empty vector plasmid or virus
- si
small interfering
- SCR
scrambled
- IP
immunoprecipitation
- VEH
vehicle
- PTX
pemetrexed
- SIL
sildenafil
- HDAC
histone deacetylase
Footnotes
There are no conflicts of interest to report.
The authors have no conflicts of interest to report.
Publisher's Disclaimer: This is a PDF file of an unedited manuscript that has been accepted for publication. As a service to our customers we are providing this early version of the manuscript. The manuscript will undergo copyediting, typesetting, and review of the resulting proof before it is published in its final citable form. Please note that during the production process errors may be discovered which could affect the content, and all legal disclaimers that apply to the journal pertain.
References
- 1.Booth L, Roberts JL, Poklepovic A, Gordon S, Dent P. PDE5 inhibitors enhance the lethality of pemetrexed through inhibition of multiple chaperone proteins and via the actions of cyclic GMP and nitric oxide. Oncotarget. 2017;8:1449–1468. doi: 10.18632/oncotarget.13640. [DOI] [PMC free article] [PubMed] [Google Scholar]
- 2.Booth L, Roberts JL, Poklepovic A, Dent P. PDE5 inhibitors enhance the lethality of [pemetrexed + sorafenib] Oncotarget. 2017 Jan 9; doi: 10.18632/oncotarget.14562. [DOI] [PMC free article] [PubMed] [Google Scholar]
- 3.Chen HP, Zhao YT, Zhao TC. Histone deacetylases and mechanisms of regulation of gene expression. Crit Rev Oncog. 2015;20:35–47. doi: 10.1615/critrevoncog.2015012997. [DOI] [PMC free article] [PubMed] [Google Scholar]
- 4.Booth L, Roberts JL, Poklepovic A, Dent P. [pemetrexed + sildenafil] regulates the immunotherapy response of tumor cells. Oncology Signaling. 2017 submitted. [Google Scholar]
- 5.Booth L, Roberts JL, Tavallai M, Webb T, Leon D, Chen J, McGuire WP, Poklepovic A, Dent P. The afatinib resistance of in vivo generated H1975 lung cancer cell clones is mediated by SRC/ERBB3/c-KIT/c-MET compensatory survival signaling. Oncotarget. 2016;7:19620–30. doi: 10.18632/oncotarget.7746. [DOI] [PMC free article] [PubMed] [Google Scholar]
- 6.Wang X, Trotman LC, Koppie T, Alimonti A, Chen Z, Gao Z, Wang J, Erdjument-Bromage H, Tempst P, Cordon-Cardo C, Pandolfi PP, Jiang X. NEDD4-1 is a proto-oncogenic ubiquitin ligase for PTEN. Cell. 2007;128:129–39. doi: 10.1016/j.cell.2006.11.039. [DOI] [PMC free article] [PubMed] [Google Scholar]
- 7.Trotman LC, Wang X, Alimonti A, Chen Z, Teruya-Feldstein J, Yang H, Pavletich NP, Carver BS, Cordon-Cardo C, Erdjument-Bromage H, Tempst P, Chi SG, Kim HJ, Misteli T, Jiang X, Pandolfi PP. Ubiquitination regulates PTEN nuclear import and tumor suppression. Cell. 2007;128:141–56. doi: 10.1016/j.cell.2006.11.040. [DOI] [PMC free article] [PubMed] [Google Scholar]
- 8.Hong SW, Moon JH, Kim JS, Shin JS, Jung KA, Lee WK, Jeong SY, Hwang JJ, Lee SJ, Suh YA, Kim I, Nam KY, Han S, Kim JE, Kim KP, Hong YS, Lee JL, Lee WJ, Choi EK, Lee JS, Jin DH, Kim TW. p34 is a novel regulator of the oncogenic behavior of NEDD4-1 and PTEN. Cell Death Differ. 2014;21:146–60. doi: 10.1038/cdd.2013.141. [DOI] [PMC free article] [PubMed] [Google Scholar]
- 9.Liu J, Wan L, Liu P, Inuzuka H, Liu J, Wang Z, Wei W. SCF(β-TRCP)-mediated degradation of NEDD4 inhibits tumorigenesis through modulating the PTEN/Akt signaling pathway. Oncotarget. 2014;5:1026–37. doi: 10.18632/oncotarget.1675. [DOI] [PMC free article] [PubMed] [Google Scholar]
- 10.Cao XR, Lill NL, Boase N, Shi PP, Croucher DR, Shan H, Qu J, Sweezer EM, Place T, Kirby PA, Daly RJ, Kumar S, Yang B. Nedd4 controls animal growth by regulating IGF-1 signaling. Sci Signal. 2008;1(38):ra5. doi: 10.1126/scisignal.1160940. [DOI] [PMC free article] [PubMed] [Google Scholar]
- 11.Chen C, Matesic LE. The Nedd4-like family of E3 ubiquitin ligases and cancer. Cancer Metastasis Rev. 2007;26(3–4):587–604. doi: 10.1007/s10555-007-9091-x. [DOI] [PubMed] [Google Scholar]
- 12.Ye X, Wang L, Shang B, Wang Z, Wei W. NEDD4: a promising target for cancer therapy. Curr Cancer Drug Targets. 2014;14:549–56. doi: 10.2174/1568009614666140725092430. [DOI] [PMC free article] [PubMed] [Google Scholar]
- 13.Yallowitz AR, Li D, Lobko A, Mott D, Nemajerova A, Marchenko N. Mutant p53 amplifies epidermal growth factor receptor family signaling to promote mammary tumorigenesis. Mol Cancer Res. 2015;13:743–54. doi: 10.1158/1541-7786.MCR-14-0360. [DOI] [PMC free article] [PubMed] [Google Scholar]
- 14.Dent P. Non-canonical p53 signaling to promote invasion. Cancer Biol Ther. 2013;14:879–80. doi: 10.4161/cbt.26174. [DOI] [PMC free article] [PubMed] [Google Scholar]
- 15.Hientz K, Mohr A, Bhakta-Guha D, Efferth T. The role of p53 in cancer drug resistance and targeted chemotherapy. Oncotarget. 2017;8:8921–8946. doi: 10.18632/oncotarget.13475. [DOI] [PMC free article] [PubMed] [Google Scholar]
- 16.McCabe N, Hanna C, Walker SM, Gonda D, Li J, Wikstrom K, Savage KI, Butterworth KT, Chen C, Harkin DP, Prise KM, Kennedy RD. Mechanistic Rationale to Target PTEN-Deficient Tumor Cells with Inhibitors of the DNA Damage Response Kinase ATM. Cancer Res. 2015;75:2159–65. doi: 10.1158/0008-5472.CAN-14-3502. [DOI] [PubMed] [Google Scholar]
- 17.Chen JH, Zhang P, Chen WD, Li DD, Wu XQ, Deng R, Jiao L, Li X, Ji J, Feng GK, Zeng YX, Jiang JW, Zhu XF. ATM-mediated PTEN phosphorylation promotes PTEN nuclear translocation and autophagy in response to DNA-damaging agents in cancer cells. Autophagy. 2015;11:239–52. doi: 10.1080/15548627.2015.1009767. [DOI] [PMC free article] [PubMed] [Google Scholar]
- 18.Trotman LC, Wang X, Alimonti A, Chen Z, Teruya-Feldstein J, Yang H, Pavletich NP, Carver BS, Cordon-Cardo C, Erdjument-Bromage H, et al. Ubiquitination regulates PTEN nuclear import and tumor suppression. Cell. 2007;128:141–56. doi: 10.1016/j.cell.2006.11.040. [DOI] [PMC free article] [PubMed] [Google Scholar]
- 19.Wang X, Trotman LC, Koppie T, Alimonti A, Chen Z, Gao Z, Wang J, Erdjument-Bromage H, Tempst P, Cordon-Cardo C, et al. NEDD4-1 is a proto-oncogenic ubiquitin ligase for PTEN. Cell. 2007;128:129–39. doi: 10.1016/j.cell.2006.11.039. [DOI] [PMC free article] [PubMed] [Google Scholar]
- 20.Zeng F, Xu J, Harris RC. Nedd4 mediates ErbB4 JM-a/CYT-1 ICD ubiquitination and degradation in MDCK II cells. FASEB J. 2009;23:1935–45. doi: 10.1096/fj.08-121947. 2009. [DOI] [PMC free article] [PubMed] [Google Scholar]
- 21.Huang Z, Choi BK, Mujoo K, Fan X, Fa M, Mukherjee S, Owiti N, Zhang N, An Z. The E3 ubiquitin ligase NEDD4 negatively regulates HER3/ErbB3 level and signaling. Oncogene. 2014;34:1105–15. doi: 10.1038/onc.2014.56. [DOI] [PubMed] [Google Scholar]
- 22.Lin Q, Wang J, Childress C, Sudol M, Carey DJ, Yang W. HECT E3 ubiquitin ligase Nedd4-1 ubiquitinates ACK and regulates epidermal growth factor (EGF)-induced degradation of EGF receptor and ACK. Mol Cell Biol. 2010;30:1541–54. doi: 10.1128/MCB.00013-10. [DOI] [PMC free article] [PubMed] [Google Scholar]
- 23.Poklepovic A, Gordon S, Shafer DA, Roberts JD, Bose P, Geyer CE, Jr, McGuire WP, Tombes MB, Shrader E, Strickler K, Quigley M, Wan W, Kmieciak M, Massey HD, Booth L, Moran RG, Dent P. Phase I study of pemetrexed with sorafenib in advanced solid tumors. Oncotarget. 2016;7:42625–42638. doi: 10.18632/oncotarget.9434. [DOI] [PMC free article] [PubMed] [Google Scholar]
- 24.Booth L, Roberts JL, Tavallai M, Chuckalovcak J, Stringer DK, Koromilas AE, Boone DL, McGuire WP, Poklepovic A, Dent P. [Pemetrexed + Sorafenib] lethality is increased by inhibition of ERBB1/2/3-PI3K-NFκB compensatory survival signaling. Oncotarget. 2016;7:23608–32. doi: 10.18632/oncotarget.8281. [DOI] [PMC free article] [PubMed] [Google Scholar]
- 25.Racanelli AC, Rothbart SB, Heyer CL, Moran RG. Therapeutics by cytotoxic metabolite accumulation: pemetrexed causes ZMP accumulation, AMPK activation, and mammalian target of rapamycin inhibition. Cancer Res. 2009;69:5467–74. doi: 10.1158/0008-5472.CAN-08-4979. [DOI] [PMC free article] [PubMed] [Google Scholar]
- 26.Rothbart SB, Racanelli AC, Moran RG. Pemetrexed indirectly activates the metabolic kinase AMPK in human carcinomas. Cancer Res. 2010;70:10299–10309. doi: 10.1158/0008-5472.CAN-10-1873. [DOI] [PMC free article] [PubMed] [Google Scholar]
- 27.Zhou W, Fu XQ, Zhang LL, Zhang J, Huang X, Lu XH, Shen L, Liu BN, Liu J, Luo HS, Yu JP, Yu HG. The AKT1/NF-kappaB/Notch1/PTEN axis has an important role in chemoresistance of gastric cancer cells. Cell Death Dis. 2013 Oct 10;4:e847. doi: 10.1038/cddis.2013.375. [DOI] [PMC free article] [PubMed] [Google Scholar]
- 28.Bassi C, Ho J, Srikumar T, Dowling RJ, Gorrini C, Miller SJ, Mak TW, Neel BG, Raught B, Stambolic V. Nuclear PTEN controls DNA repair and sensitivity to genotoxic stress. Science. 2013;341:395–9. doi: 10.1126/science.1236188. [DOI] [PMC free article] [PubMed] [Google Scholar]
- 29.Jensen JD, Knoop A, Laenkholm AV, Grauslund M, Jensen MB, Santoni-Rugiu E, Andersson M, Ewertz M. PIK3CA mutations, PTEN, and pHER2 expression and impact on outcome in HER2-positive early-stage breast cancer patients treated with adjuvant chemotherapy and trastuzumab. Ann Oncol. 2012;23:2034–42. doi: 10.1093/annonc/mdr546. [DOI] [PubMed] [Google Scholar]
- 30.Zhang P, Sun S, Li N, Ho AS, Kiang KM, Zhang X, Cheng YS, Poon MW, Lee D, Pu JK, Leung GK. Rutin increases the cytotoxicity of temozolomide in glioblastoma via autophagy inhibition. J Neurooncol. 2017 Mar 14; doi: 10.1007/s11060-017-2387-y. [DOI] [PubMed] [Google Scholar]
- 31.Liu Z, Shi A, Song D, Han B, Zhang Z, Ma L, Liu D, Fan Z. Resistin confers resistance to doxorubicin-induced apoptosis in human breast cancer cells through autophagy induction. Am J Cancer Res. 2017;7:574–583. [PMC free article] [PubMed] [Google Scholar]
- 32.Wang B, Jia H, Zhang B, Wang J, Ji C, Zhu X, Yan Y, Yin L, Yu J, Qian H, Xu W. Pre-incubation with hucMSC-exosomes prevents cisplatin-induced nephrotoxicity by activating autophagy. Stem Cell Res Ther. 2017;8:75. doi: 10.1186/s13287-016-0463-4. [DOI] [PMC free article] [PubMed] [Google Scholar]
Associated Data
This section collects any data citations, data availability statements, or supplementary materials included in this article.