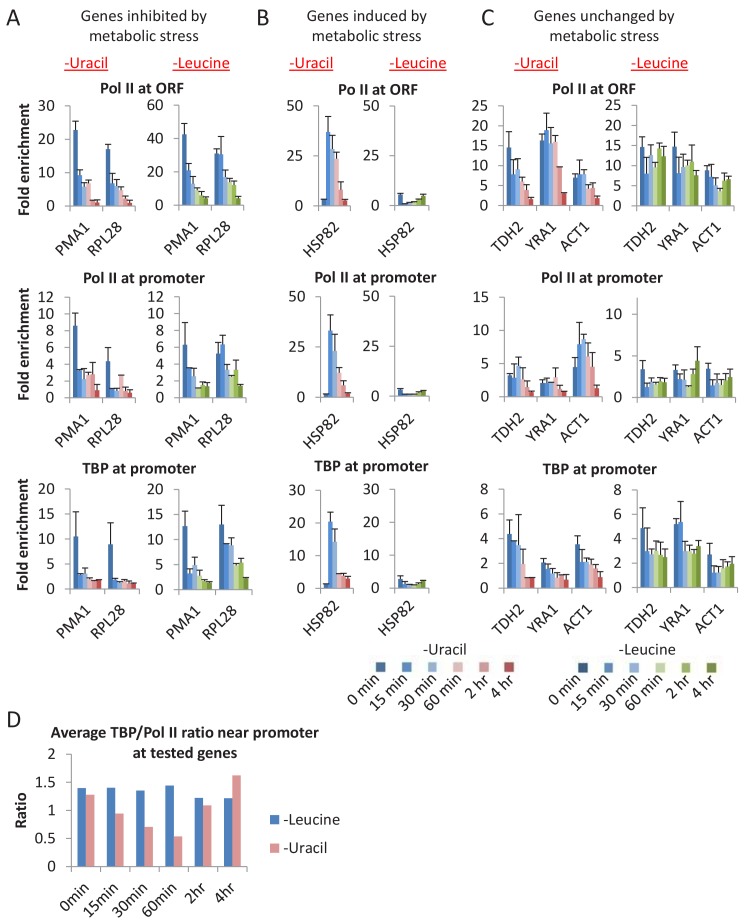
Figure 5. A general loss of PICs in cells depleted for uracil.
(A) Pol II (ORF and promoter) and TBP occupancies at promoters (PMA1 and RPL28) of genes inhibited by metabolic stress in cells depleted for uracil or leucine for various times (color scale). (B) Similar analysis for HSP82, a gene induced by various metabolic stresses. (C) Similar analysis for genes TDH2, YRA1, and ACT1, genes unchanged upon metabolic stress. (D) Average TBP/Pol II ratio at all tested promoters at various times after depletion of leucine (blue) or uracil (red). See Figure 5—figure supplement 1D for individual tested promoters.


