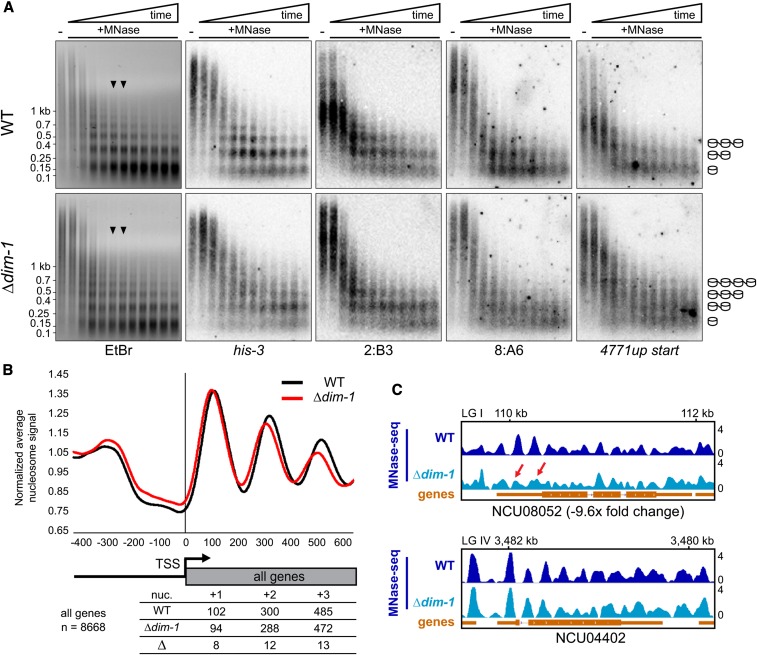
Figure 3.
Nucleosome positioning is altered at the TSSs of genes in Δdim-1 strain. (A) Southern blots of DNA from 20-min time course micrococcal nuclease (MNase) digest with WT and Δdim-1 nuclei, probed for the indicated regions; the “NCU04771up start” probe covers the intergenic promoter region of gene NCU04771, including the nucleosome-free region. Arrowheads indicate the time points (8 and 10 min) from which mono- and di-nucleosomes and intervening DNA was purified for paired-end high-throughput sequencing (below). Cartoons at right show interpretation of nucleosome patterns leading to smallest fragments. (B) Average nucleosome enrichment profiles of MNase-sequencing data from WT and Δdim-1 strains normalized to the average signal across the 5′ end of all Neurospora genes, spanning 400 bp upstream to 600 bp downstream of the TSS; numbers below indicate the peak apices, in base pairs from the transcriptional start site (TSS) in WT and Δdim-1 strains, and the difference in the apex position, for the +1, +2, and +3 nucleosomes. (C) Representative examples of nucleosome positions in individual genes with changed (NCU08052), or unchanged (NCU04402; dim-5) expression in a Δdim-1 background. Red arrows highlight nucleosome disorder in a Δdim-1 strain of two nucleosomes that are well-positioned in a WT strain.

