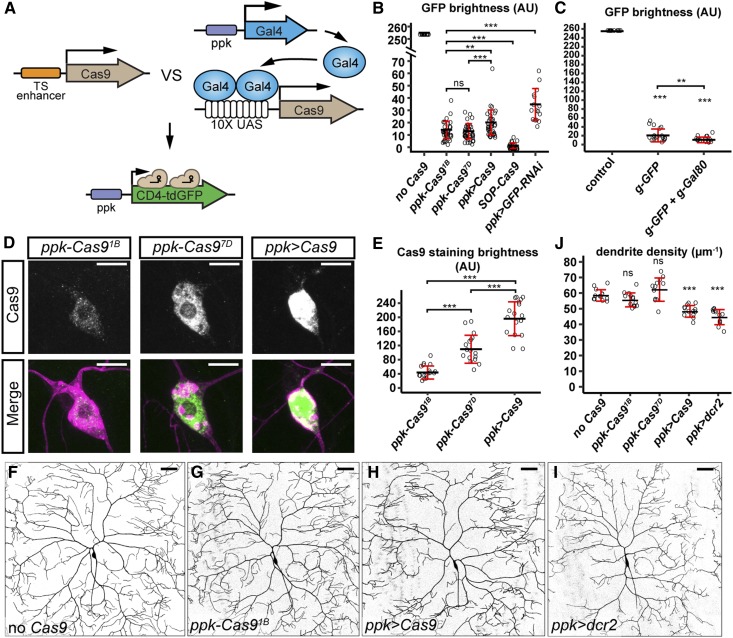
Figure 4.
Enhancer-driven Cas9 is advantageous over Gal4-driven Cas9 in studying neural development. (A) Diagram showing the comparison of tissue-specific (TS) enhancer-driven Cas9 and Gal4-driven Cas9 in knocking out ppk-CD4-tdGFP. (B) Quantification of GFP brightness in C4da neurons in the control, Cas9-expressing animals, and GFP knockdown animals. GFP signals in the control (no Cas9) are saturated. *** P ≤ 0.001; ns, not significant; one-way ANOVA and Tukey’s honest significant difference (HSD) test. (C) Quantification of GFP brightness in C4da neurons in the control (no Cas9), and animals expressing ppk-Cas9 gRNA-GFP and ppk-Cas9 gRNA-GFP gRNA-Gal80. Control values are from (B). *** P ≤ 0.001, ** P ≤ 0.01; one-way ANOVA and Tukey’s HSD test. (D) Cas9 staining in the genotypes indicated. Upper panels show Cas9 staining. Lower panels show Cas9 staining (green) and C4da neurons labeled by ppk > CD4-tdTom (magenta). (E) Quantification of nuclear Cas9 levels in C4da neurons in the genotypes indicated. *** P ≤ 0.001; one-way ANOVA and Tukey’s HSD test. (F–I) DdaC neurons in the control (F), ppk-Cas91B (G), ppk-Gal4 UAS-Cas9 (H), and ppk-Gal4 UAS-dcr2 (I). (J) Quantification of dendrite density in genotypes indicated. *** P ≤ 0.001; ns, not significant; one-way ANOVA and Dunnett’s test. Each circle represents an individual neuron. For (B), n = 16 for the control and ppk > GFP-RNAi; n = 40 for SOP-Cas9 and ppk > Cas9; n = 39 for ppk-Cas91B; and n = 43 for ppk-Cas97D. For (C), n = 16. For (E), n = 17. For (J), n = 13. Black bar, mean; red bars, SD. Bar, 10 μm in (D) and 50 μm in (F–I). AU, arbitrary units.

