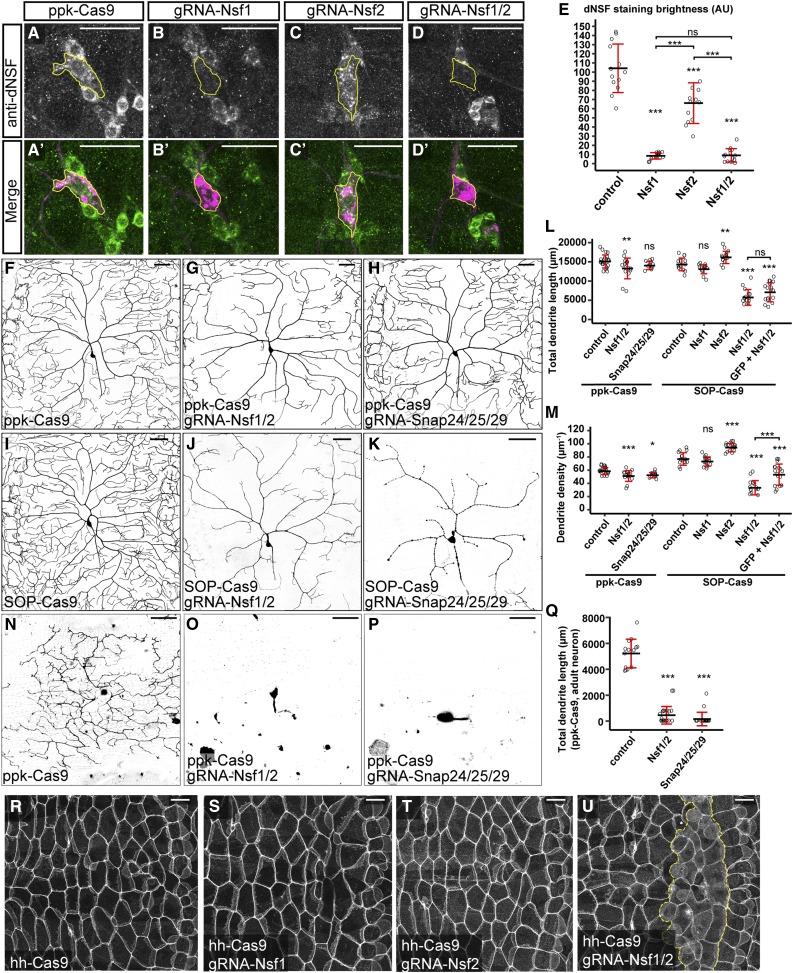
Figure 6.
Clustered regularly interspaced short palindromic repeats-mediated tissue-restricted mutagenesis analyses of NSF and SNAP genes in C4da dendrite morphogenesis, (A–D’) Nsf1 staining revealed by anti-dNSF in ppk-Cas9 (A and A’), ppk-Cas9 gRNA-Nsf1 (B and B’), ppk-Cas9 gRNA-Nsf2 (C and C’), and ppk-Cas9 gRNA-Nsf1-Nsf2 (D and D’). Upper panels show Nsf1 staining. Lower panels show the Nsf1 staining (green) and C4da neurons labeled by ppk > CD4-tdTom (magenta). Yellow outlines indicate the location of the C4da cell body. (E) Quantification of Nsf1 staining in C4da neurons in the genotypes indicated. *** P ≤ 0.001; ns, not significant; one-way ANOVA and Tukey’s honest significant difference (HSD) test. (F–H) DdaC neurons in ppk-Cas9 (F), ppk-Cas9 gRNA-Nsf1-Nsf2 (G), and ppk-Cas9 gRNA-Snap24-Snap25-Snap29 (H). (I–K) DdaC neurons in SOP-Cas9 (I), SOP-Cas9 gRNA-Nsf1-Nsf2 (J), and SOP-Cas9 gRNA-Snap24-Snap25-Snap29 (K). (L and M) Quantification of total dendrite length (L) and dendrite density (M) in the genotypes indicated. Each circle represents an individual neuron: ppk-Cas9 (n = 22); ppk-Cas9 gRNA-Nsf1-Nsf2 (n = 16); ppk-Cas9 gRNA-Snap24-Snap25-Snap29 (n = 11); SOP-Cas9 (n = 15); SOP-Cas9 gRNA-Nsf1 (n = 15); SOP-Cas9 gRNA-Nsf2 (n = 15); and SOP-Cas9 gRNA-Nsf1-Nsf2 (n = 15). * P ≤ 0.05, ** P ≤ 0.01, *** P ≤ 0.001; ns, not significant; one-way ANOVA and Tukey’s HSD test. (N–P) V’ada neurons in day 0 adults of ppk-Cas9 (N), ppk-Cas9 gRNA-Nsf1-Nsf2 (O), and ppk-Cas9 gRNA-Snap24-Snap25-Snap29 (P). (Q) Quantification of total dendrite length of adult v’ada neurons expressing ppk-Cas9 and the gRNAs indicated. Each circle represents an individual neuron: ppk-Cas9 (n = 14), ppk-Cas9 gRNA-Nsf1-Nsf2 (n = 23), or ppk-Cas9 gRNA-Snap24-Snap25-Snap29 (n = 20). *** P ≤ 0.001; one-way ANOVA and Dunnett’s test. (R–U) Epidermal cell morphology revealed by Nrg-GFP in hh-Cas9 (R), hh-Cas9 gRNA-Nsf1 (S), hh-Cas9 gRNA-Nsf2 (T), and hh-Cas9 gRNA-Nsf1-Nsf2 (U) at late second-instar larval stage. Yellow dotted lines in (U) indicate the presumed region of hh-Cas9-expressing cells. Black bar, mean; red bars, SD. Bar, 25 μm for (A–D’), and 50 μm for (F–P) and (R–U). AU, arbitrary units.

