

Abstract
The active site of the [FeFe] hydrogenase (HydA1), the H-cluster, is a 6-Fe cofactor that contains CO and CN− ligands. It undergoes several different oxidation and protonation state changes in its catalytic cycle to metabolize H2. Among them, the well-known Hox state and the recently identified Hhyd state are thought to be directly involved in H2 activation and evolution, and they are both EPR active with net spin S = 1/2. Herein, we report the pulse electronic paramagnetic spectroscopic investigation of these two catalytic states in Chlamydomonas reinhardtii HydA1 (CrHydA1). Using an in vitro biosynthetic maturation approach, we site-specifically installed 13C into the CO or CN− ligands and 57Fe into the [2Fe]H subcluster of the H-cluster in order to measure the hyperfine couplings to these magnetic nuclei. For Hox, we measured 13C hyperfine couplings (13CO aiso of 25.5, 5.8, and 4.5 MHz) corresponding to all three CO ligands in the H-cluster. We also observed two 57Fe hyperfine couplings (57Fe aiso of ~17 MHz and 5.7 MHz) arising from the two Fe atoms in the [2Fe]H subcluster. For Hhyd, we only observed two distinct 13CO hyperfine interaction (13CO aiso of 0.16 and 0.08 MHz), and only one for 13CN− (13CN aiso of 0.16 MHz)—the couplings to the 13CO/13CN− on the distal Fe of [2Fe]H may be too small to detect. We also observed a very small (< 0.3 MHz) 57Fe HFI from the labeled [2Fe]H subcluster, and four 57Fe HFI from the labeled [4Fe-4S]H subcluster (57Fe aiso of 7.2, 16.6, 28.2, and 35.3 MHz). These hyperfine coupling constants are consistent with the previously proposed electronic structure of the H-cluster at both Hox and Hhyd states, and provide a basis for more detailed analysis.
Graphical Abstract
Introduction
Hydrogenases are used by nature to catalyze the reversible conversion between H2 and H+/e−.1–2 In [FeFe] hydrogenases, the catalytic center “H-cluster” consists of a tetracysteine (Cys) coordinated [4Fe-4S]H subcluster linked through one Cys residue thiol to an organometallic [2Fe]H subcluster that has CO and CN− ligands along with an azadithiolate (adt) ligand that bridges the two iron ions (Scheme 1).3–6 The H-cluster has been shown to adopt different oxidation and protonation states that have unique spectroscopic properties: the most oxidized state, Hox, the one-electron reduced state (Hred, HredH+, Hred*), and the two-electron reduced state (Hsred, HsredH+, Hsred*).7–12 Most recently, another state of the H-cluster with a terminal iron hydride, Hhyd, has been identified in Chlamydomonas reinhardtii HydA1 (CrHydA1), in the wild-type enzyme and several variants.13–17 Importantly, Hhyd is considered to be one of the key state in the catalytic cycle of [FeFe] hydrogenase,13, 15, 18 as the terminal hydride is thought to coordinate with the pendant amine of the adt ligand to form a frustrated Lewis pair that is necessary for H2 activation and evolution.19–20 The full characterization of Hhyd is therefore crucial to further understand the mechanism of H-cluster-based catalysis.
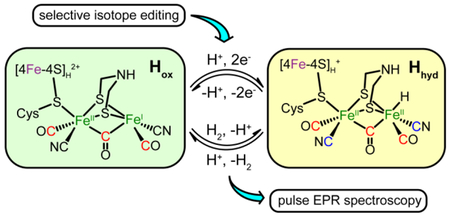
Scheme 1.

Proposed catalytic cycle of the H-cluster highlighting the two S = 1/2 states, Hox and Hhyd.
Both S = 1/2 EPR-active states, Hox and Hhyd, represent different forms of the H-cluster in the proposed catalytic cycle of [FeFe] hydrogenase (Scheme 1).15–16 Results from Mössbauer spectroscopy, electron nuclear double resonance (ENDOR) spectroscopy, and DFT calculations support a [4Fe-4S]H2+ -[FeIIFeI]H configuration for Hox, with a net spin of S = 1/2 that is primarily localized on the mixed-valance [2Fe]H, and less spin density on the [4Fe-4S]H2+ (which would be a diamagnetic cluster if isolated from the paramagnetic [FeIIFeI]H).12, 21–22 Hyperfine interactions (HFI) for specifically 13CN− and 57Fe -labeled [2Fe]H have been reported for Hox and its CO-inhibited state, Hox-CO.23–27 These 57Fe and 13C hyperfine coupling constants have been used to estimate the spin density distribution in the H-cluster. More recently, the 1H NMR spectrum was also reported for Hox, providing further insights into its electronic structure.28 Despite these efforts to characterize Hox, questions still remain. One in particular is why only one 57Fe HFI has been detected for the [2Fe]H of Clostridium pasteurianum CpI and Chlamydomonas reinhardtii HydA1,27, 29 yet two distinct HFI for the coordinating 13CN− have been found, one assigned as a ligand to the proximal, nominally FeII ion (Fep) (13C aiso = 4.9 MHz), and one assigned as a ligand to the spin-bearing distal FeI (Fed) (13C aiso = 27 MHz).25 Simulations of Mössbauer results also implied that only one large 57Fe HFI should be present in Hox.12 Similarly in Desulfovibrio desulfuricans DdH, while identical 57Fe hyperfine couplings were experimentally measured for the two Fe sites in [2Fe]H,30 DFT calculations using a variety of models suggested that their couplings should be significantly different.31 Clarifying this inconsistency is not only of fundamental interest, but would also shed light in designing molecular models for hydrogenase.
As for Hhyd, while the proposed formula of Hhyd may be viewed as binding of a terminal hydride on the Fed of Hox, previous studies suggested that Hhyd adopts a [4Fe-4S]H+-[FeIIFeII]H-H− configuration, with a net spin of S = 1/2 that is now primarily localized on the [4Fe-4S]H.16 This assignment is supported by the g-tensor of Hhyd (g = [2.08, 1.94, 1.88]) that is similar to that found for typical [4Fe-4S]+ clusters, the presence of two low-spin diamagnetic Fe2+ in the [2Fe]H with small isomer shifts (δ = 0.03 and 0.23 mm/s) as revealed by Mössbauer spectroscopy, as well as by DFT calculations.15–16 Interestingly, the proposed electronic structure of Hhyd is analogous to that of a reaction intermediate we recently trapped in HydG,32 the enzyme responsible for the early steps of H-cluster bioassembly.29, 33 Specifically, we identified a [4Fe-4S]+-[(Cys)FeII(CO)(CN)] species and observed small 13C (aiso = 0.22 and 0.24 MHz) and 57Fe (aiso = 0.42 MHz) HFI from the specifically labeled 13CO, 13CN− ligands and the low-spin dangler 57FeII respectively.32 Therefore, we reason that similarly small HFI could be observed for Hhyd and these HFI could be used to clearly define the electronic configuration of Hhyd.
The Swartz lab has developed an in vitro approach to assemble the H-cluster by using apo-hydrogenase (that harbors only the [4Fe-4S]H), cell lysate of maturation enzymes—HydE, HydF and HydG—responsible for the biosynthesis of the [2Fe]H,34–36 and necessary substrates/cofactors.37–39 This “cell free synthesis” method enables us to facilely and precisely install various isotopes into the [2Fe]H25, 29 In this work, we have taken advantage of this strategy and selectively labeled CrHydA1 with 13CO, 13CN−, and 57Fe, allowing us to determine the electronic structures of the H-cluster at both Hox and Hhyd states via the HFI of these various magnetic nuclei. These results provide further insights into the structure and function of this unique cofactor.
Methods
General Consideration.
57Fe and, 13C- and 15N- labeled Tyr were purchased from Cambridge Isotope Inc. All other chemicals were from Sigma-Aldrich unless specified. All handling of Fe-S cluster proteins, which includes purification of CrHydA1, preparation of HydE, HydF and HydG lysate, maturation of CrHydA1, and preparation of EPR samples, were carried out in an anaerobic chamber with O2 level < 1 ppm.
In vitro maturation of CrHydA1.
Maturation experiments were performed according to previous procedure with slight modifications.29, 37 These experiments required apo-CrHydA1, lysate of cells overexpressing Shewanella oneidensis HydE, HydF and HydG, and necessary small molecules. Briefly, apo-CrHydA1 was expressed in a recombinant E. coli BL21(DE3) ΔiscR strain that harbors the plasmid containing codon-optimized Chlamydomonas reinhardtii hydA1 gene with an N-terminal Strep-II purification tag. Four liters of E. coli cells were grown in 25 g/L LB medium with 40 mg/L kanamycin, 100 mg/L ampicillin, 2 mM ammonium ferric citrate, 0.5% (w/v) glucose and 100 mM 3-(N-morpholino)propanesulfonic acid (MOPS, pH = 7.8), at 30 °C to a OD600 of ~0.5, at which point the cultures were pooled, transferred into the anaerobic chamber, and supplemented with 5 mM Cys and 10 mM fumarate. The pooled culture was stirred in the chamber for 30 min to deplete the remaining oxygen in the solution and protein expression was then induced by 0.25 mM isopropyl β-D-1-thiogalactopyranoside (IPTG). After 20 h, cells were harvest by centrifugation and frozen. For protein purification, cells were lysed in a HEPES buffer (buffer A, 50 mM HEPES, 150 mM KCl, pH = 8.0, with 1 mM freshly made sodium dithionite added) containing 1xBugbuster detergent solution (EMD Millipore), 25 U/mL benzonanse (EMD Millipore), 1 kU/mL rLysozyme (EMD Millipore) and one EDTA-free protease inhibitor cocktail tablet (Roche). After the removal of cell debris by centrifugation, the clear supernatant was loaded to Strep-Tacin resin (~ 50 mL resin) in a gravity column. The column was washed with buffer A and then CrHydA1 was eluted by buffer A containing 3 mM desthiobiotin. The dark fractions were collected, concentrated as necessary and stored at −80 °C.
To make cell lysate containing untagged HydE, HydF or HydG, recombinant E. coli cells containing the corresponding plasmid were grown and lysed (~3 mL buffer A per gram of cell) same as above. Clear cell lysate was aliquoted and stored at −80 °C. Expression levels of the maturation enzymes in the cell lysate were examined by SDS-PAGE. Desthiobiotin in the apo-CrHydA1, introduced in protein purification, was removed by using a PD-10 desalting column (GE Healthcare) prior to the maturation reaction. For the maturation of CrHydA1, each 25 mL reaction contained 12.5 mL HydG lysate, 4 mL HydF lysate, 1.5 mL HydE lysate, 4 mM DTT, 1 mM Fe2+ (57Fe2+ if necessary), 0.5 mM Na2S, 2 mM S-adenosylmethionine (SAM), 2 mM Cys, 1 mM pyridoxal phosphate (PLP), 20 mM guanosine triphosphate (GTP), 2 mM tyrosine (Tyr, labeled as desired), 2 mM sodium dithionite and ~8 μM apo-CrHydA1 (added in that order). The pH of the reaction mixture was adjusted to ~7.5 before dithionite was added. The reaction mixture was incubated at room temperature in an anaerobic chamber containing 2% H2 for ~16 h, and then clarified by centrifugation. Maturated CrHydA1 was re-purified from the supernatant as abovementioned (~5 mL Strep-Tactin resin). Fractions containing CrHydA1 were pooled and concentrated as necessary.
Purification of uniformly 57Fe-enriched CrHydA1.
This procedure is same as reported in the previous study.29 Briefly, [657Fe]-CrHydA1 (that harbors the maturated H-cluster with all six iron labeled) was expressed in a recombinant E. coli BL21(DE3) ΔiscR strain that harbors two plasmids, encoding the Chlamydomonas reinhardtii hydA1 gene and Shewanella oneidensis hydEFGX genes, respectively. Cell growth and protein purification were performed same as above, except that the LB media was supplemented with 57Fe instead of natural abundance Fe.
EPR sample preparation.
EPR samples were made from freshly purified or maturated holo-CrHydA1. To make Hox samples, 2 mM thionine was added to ~ 500 μM CrHydA1. The solution was immediately transferred into the EPR tube and frozen for storage. To make Hhyd samples, 300 mM dithionite made in buffer A was added to ~ 500 μM CrHydA1.16 The mixture was immediately transferred into the EPR tube and frozen for storage.
EPR spectroscopy.
EPR spectroscopy was performed in the CalEPR center in Department of Chemistry, University of California at Davis. X-band (9.4 GHz) Continuous Wave (CW) EPR spectra were recorded on a Bruker Biospin EleXsys E500 spectrometer equipped with a super high Q resonator (ER4122SHQE). Cryogenic temperatures were achieved and controlled by using an ESR900 liquid helium cryostat, a temperature controller (Oxford Instrument ITC503) and a gas flow controller. All CW EPR spectra were recorded at slow-passage, non-saturating conditions. Spectrometer settings were: conversion time, 40 ms; modulation amplitude, 0.5 mT; modulation frequency, 100 kHz; and other settings given in figure captions. Pulse Q-band (34 GHz) hyperfine sublevel correlation (HYSCORE) and electron nuclear double resonance (ENDOR) experiments were performed on the Bruker Biospin EleXsys 580 spectrometer using a R.A. Isaacson cylindrical TE011 resonator.40 Cryogenic temperatures were achieved and controlled with an Oxford Instrument CF935 cryostat. The pulse sequences employed were as follows: free induction decay (FID)-detected field swept EPR (π/2-FID), electron spin-echo detected field swept EPR (π/2-τ-π-τ-echo), HYSCORE (π/2-τ-π/2-t1-π-t2-π/2-τ-echo), Davies-ENDOR (π-RF-π/2-τ-π-τ-echo), and Mims-ENDOR (π/2-τ-π/2-RF-π/2-τ-echo). HYSCORE time domain data were baseline corrected with 3rd polynomial, hamming-window applied, zero-filled to eight-fold of data points and fast Fourier-transformed to obtain the frequency domain results. Simulations of CW and pulse EPR spectra were performed in Matlab 2014a (MathWorks, Inc,) with EasySpin 5.2.13 toolbox.41 Euler angles are from A tensors to g tensors and follow z-y-z convention.
Orientationally disordered radical systems usually exhibit anisotropic hyperfine coupling interaction (HFI) that can be decomposed into an isotropic component, aiso and an anisotropic component, T. At specific orientations and for nuclei with nuclear spin I = 1/2 (13C and 57Fe in this study), the ENDOR transitions for the ms = ± 1/2 electron manifolds are observed, to first order approximation, at frequencies: v± = |vN ± A/2|, where vN is the nuclear Larmor frequency and A is the orientation-dependent hyperfine coupling.42 In the weak coupling case where vN > A/2, the two ENDOR peaks are centered at vN, and split by A. In the strong coupling case where vN > A/2, the two ENDOR peaks are centered at A/2, and split by 2vN. M ims-ENDOR43 can be used to detect very small A with superb sensitivity, but its response intensity is modulated by a factor related to A and the time interval between the first and the second microwave pulse (τ): R ~ [1-cos(2πAτ)]. Therefore, the intensity of Mims-ENDOR vanishes at A = n/τ (n = 0, 1, 2 …), known as the “Mims-holes”. As such, larger hyperfine couplings are typically probed by Davies-ENDOR.43
HYSCORE spectroscopy detects the modulation of an electron spin-echo by the spin flipping of nearby magnetic nuclei.43 The two-dimensional spectra reveal crosspeaks, the positions of which rely on A and vN. For an S = 1/2 and I = 1/2 system and in the weak coupling case, the crosspeaks appear in the first quadrant at (vN + A/2, vN - A/2) and (vN - A/2, vN + A/2). In the strong coupling case, the crosspeaks appear in the second quadrant at (vN - A/2, vN + A/2) and (-vN - A/2, - vN + A/2). For HFI with large anisotropy, empirical analysis using these simple formula is not straightforward, and spectral simulation is necessary to extract the HFI parameters.
Results and discussion
[13CO] in Hox.
We previously reported the 13C HFI of the two 13CN− ligands in the Clostridium pasteurianum hydrogenase (CpI) in the Hox and Hox-CO states,25 and here we turn our focus to the three CO ligands. The CO and CN− ligands in the H-cluster are sourced from Tyr which is cleaved by the enzyme HydG.33, 44 In order to make 13CO-specifically labeled CrHydA1, we used 1-13C-Tyr in the in vitro maturation reaction that generates the 13CO ligands to the H-cluster. The maturated CrHydA1 poised in the Hox state was examined by CW EPR (Figure 1A), which revealed a rhombic g-tensor of [2.103, 2.042, 1.998], consistent with published results for CrHydA1.45 A small amount of Hox-CO contamination (17%, g = [2.056, 2.008, 2.008]) is also present, as is often observed in [FeFe] hydrogenase samples.45 The observed ~1 mT splitting at the three principal g values indicates a large HFI from 13CO, which is similar to the observation in CpI [13CN]-Hox.25 The 13C HFI were further analyzed by the field-dependent Q-band Davies-ENDOR spectra recorded at the field positions without the contribution from Hox-CO. We observed a total of three sets of 13C ENDOR signals corresponding to the three 13CO ligands in Hox (Figure 1B). In line with the previous study on the HFI of the 13CN− ligands and the established electronic structure of Hox,11–12 we assigned the 13C ENDOR signal with the largest HFI, aiso = 25.5 MHz (Figure 1B, green shade), to the distal 13CO (13COd), the 13C ENDOR signal with the smallest HFI, aiso = 4.5 MHz (Figure 1B, blue shade), to the proximal 13CO (13COp), leaving the remaining 13C ENDOR signal with an HFI in-between, aiso = 5.8 MHz (Figure 1B, red shade), that must arise from the bridging 13CO (13CObridge). Notably, the 13C HFI of 13COd is close to the cancellation limit, A~2vc, and only the higher frequency ENDOR transition is detected as the lower frequency one is close to zero and is best observed with Q-band HYSCORE spectra (Figure S1). The complex ENDOR lineshape of the higher frequency transition in the center field positions are due to narrow orientation selection of this relatively anisotropic HFI. The 13C HFI of the other two 13CO ligands are also confirmed by X-band HYSCORE spectroscopy (Figure S1).
Figure 1.

(A) X-band CW EPR spectrum of thionine-oxidized [13CO]-CrHydA1 (black trace) and the total simulation (magenta trace). The two spectral components are: Hox, g = [2.103, 2.042, 1.998], 83% (red trace); Hox-CO, g = [2.056, 2.008, 2.008], 17% (blue trace). Conditions: frequency, 9.4 GHz; temperature, 15 K; microwave power, 4 μW. (B) Q-band field-dependent Davies-ENDOR spectra (black trace) of [13CO]-CrHydA1 Hox simulated with three sets of 13C HFI. Simulation: g = [2.103, 2.042, 1.998]; 13COd (green shade): A = [20.5, 29.9, 26.0] MHz, Euler angle = [37, 26, 0]°; 13COp (blue shade): A = [5.3, 4.0, 4.3] MHz, Euler angle = [25, 25, 0]°; 13CObridge (red shade): A = [9.0, 3.8, 4.5] MHz, Euler angle = [0, 20, 0]°. Conditions: frequency, 34.1 GHz; temperature, 15K; inversion pulse, 80 ns; RF pulse, 30 μs; π/2, 12ns; τ = 300 ns.
The 13C HFI of 13COp and 13COd both have magnitudes and degrees of anisotropy similar to those of the 13CNp and 13CNd ligand in CpI Hox, which is consistent with the proposed local z-axis assignment of both Fe as pointing approximately along each Fe-CObridge bond.21, 25 The aiso (13COd) : aiso (13COp) ratio of 5.7 is essentially the same with the value determined for the 13CN− ligands in CpI Hox (5.8).25 These findings support our previous electronic structure descriptions of Hox; namely, that most spin density is carried by Fed and localized in the dz2 orbital of this low spin 3d7 FeI.25 The 13C HFI of 13CObridge is more dipolar, with a degree of anisotropy similar to that of 13CObridge in DdH Hox-CO, although the latter has a slightly larger aiso (7.4 MHz).24 The relatively small and anisotropic 13C HFI of the 13CObridge reflects the longer Fe-CObridge distance compared to Fe-COd (PDB ID: 3C8Y3), which diminishes the Fermi contact of the lobe of the spin-carrying Fed 3dz2 with the 13C nucleus.
In another hydrogenase sample that has higher Hox-CO percentage (80%), we were able to observe four 13C ENDOR signals on the Davies-ENDOR spectra recorded at g = 2.008 (Figure S2), g2 of Hox-CO, with HFI values of 4.8, 7.3, 10.9 and 21.1 MHz, corresponding to the distal, proximal, bridging, and external 13CO, respectively. These values are assigned by comparing to the 13CO HFI values found in DdH and CpI Hox-13CO and the 13CN− HFI values found in CpI Hox-CO.24–26 The HFI values we found are in good agreement with previous results. The 13C HFI values and tensors for diatomic ligands in different states of the H-cluster are summarized in Table 1.
Table 1.
Summary of 13C HFI of the diatomic ligands in different states of the H-cluster
| H-cluster state | A 13C (MHz) | [α, β, γ] (°)e | assignment | reference |
|---|---|---|---|---|
| Hoxa | [5.3, 4.0, 4.3] | [25, 25, 0] | COp | this work |
| [20.5, 29.9, 26.0] | [37, 26, 0] | COd | this work | |
| [9.0, 3.8, 4.5] | [0, 20, 0] | CObridge | this work | |
| [5.22, 5.24, 4.16] | [30, 90, 0]f | CNp | 25 | |
| [30.9, 23.3, 30.2] | [60, 120, 170]f | CNd | 25 | |
| Hox-COb | 7.3 | COp | this work | |
| [3.2, 3.7, 4.4] 4.8 | COd |
24 this work |
||
| [8.5, 9.8, 3.9] 10.9 | CObridge |
24 this work |
||
| [15.6, 16.6, 19.2]; 21d, 21.1; | COexternal |
24, 26 this work |
||
| [7.2, 7.0, 7.0] | [0, 0, 0] | CNp | 25 | |
| [3.90, 3.75, 3.75] | [0, 0, 0] | CNd | 25 | |
| Hhydc | [0.30, −0.18, −0.59] | [25, 0, 0] | COp | this work |
| [−0.51, 0.16, 0.10] | [35, 0, 0] | CObridge | this work | |
| [0.07, 0.17, 0.22] | [0, 10, 0] | CNp | this work |
13CO HFI are from CrHydA1 Hox; 13CN HFI are from CpI Hox.
13CO HFI are from CrHydA1 and DdH Hox-CO; 13CN HFI are from CpI Hox-CO.
From CrHydA1 Hhyd.
From CpI Hox-CO.
Euler angle are relative to g-frame as g1>g2>g3.
Euler angles are relative to g-frame as g1<g2<g3.
[13CO] and [13CN] in Hhyd.
Following the published procedures to reduce CrHydA1 Hox with high concentration of dithionite,14–16 we were able to readily generate CrHydA1 Hhyd. The Q-band echo-detected EPR spectrum of the resulting sample reveals an S = 1/2 species with g = [2.076, 1.936, 1.881] (Figure 2A), identical to the reported g values of Hhyd generated from wild-type CrHydA1.16 A small amount of Hox-CO is also present.15 Since both Fep and Fed in Hhyd are proposed to be low-spin diamagnetic Fe2+,16 the 13C HFI of their diatomic ligands are expected to be small. Indeed, we observed small 13C HFI on the Mims-ENDOR spectra collected across the EPR absorption envelope of the [13CO]-Hhyd sample (Figure 2B). Two sets of splittings, centered at the Larmor frequency of 13C and separated by 0.2–0.5 MHz, were observed at most field positions. To clarify whether they arise from one or two 13C HFI tensors, we also performed variable mixing time (VMT) Mims-ENDOR experiments which measure the absolute signs of the HFI tensors.46 The VMT Mims-ENDOR collected at g =1.936 (Figure S3), g2 of Hhyd, indicates that the two sets of peaks do not change in the same manner as tmix is increased from 1 μs to 200 μs, and they also have oppositely signed HFI. Therefore, they must correspond to two different HFI tensors. Accordingly, we simulated the field-dependent ENDOR spectra with two sets of 13C HFI, with aiso = −0.16 MHz (Figure 2B, blue shade) and −0.08 MHz (Figure 2B, red shade), respectively. Since in Hhyd, the spin density is proposed to localize primarily on the [4Fe-4S]H that is at +1 state, the magnitude of the small 13C HFI, arising from spin polarization, would be largely governed by their distances to the [4Fe-4S]H cluster. Recent DFT calculation has also suggested that Fep has higher spin density than Fed.18 As such, we assign the two observed 13C HFI tensors to the 13COp (−0.16 MHz) and 13CObridge (−0.08 MHz) respectively (Table 1), and we reason that the ENDOR features corresponding to 13COd are not observed likely because it is too distant from the unpaired electron spin leading to too small of a HFI.
Figure 2.

(A) Pseudo-modulated Q-band echo-detected EPR spectrum of dithionite-reduced CrHydA1 (black trace) and the total simulation (magenta trace). The two spectral components are: Hhyd, g = [2.076, 1.936, 1.881], 97% (green trace); Hox-CO, g = [2.056, 2.008, 2.008], 3% (blue trace). Conditions: frequency, 34.1 GHz; temperature, 10 K; τ = 300 ns; modulation amplitude, 0.5 mT. (B, C) Q-band field-dependent Mims-ENDOR spectra (black trace) of [13CO]-CrHydA1 Hhyd simulated with two sets of 13C HFI (B), and that of [13CN]-CrHydA1 Hhyd simulated with one 13C HFI (C). Simulation: g = [2.076, 1.936, 1.881]; 13COp (blue shade): A = [0.30, −0.18, −0.59] MHz, Euler angle = [25, 0, 0]°; 13CObridge (red shade): A = [−0.51, 0.16, 0.10] MHz, Euler angle = [35, 0, 0]°; 13CNp (red trace): A = [0.07, 0.17, 0.22] MHz, Euler angle = [0, 10, 0]°. Conditions for Mims-ENDOR: frequency, 34.1 GHz; temperature, 10K; RF pulse, 30 μs; π/2, 12 ns; τ = 600 ns.
To bolster this assignment, we prepared the 13CN−-labeled CrHydA1 Hhyd by using 2-13C-Tyr as the source for the 13CN− ligand in the in vitro maturation, followed by reduction of the resulting enzyme with dithionite. In this case, the 13C ENDOR signals will be less complicated as only two 13CN− ligands, bound to Fep and Fed respectively, are present. Indeed, field-dependent 13C Mims-ENDOR spectra of [13CN]-Hhyd disclose only one set of 13C ENDOR signals, with |aiso| = 0.16 MHz (Figure 2C, red trace; Table 1), the same coupling as we assigned to 13COp, and therefore this 13C HFI can be assigned to 13CNp. Again the ENDOR features corresponding to 13CNd are not observed probably due to its very small HFI.
The fact that we detected two sets of 13CO but only one set of 13CN− indicates that the second 13CO HFI must arise from the bridging, not distal, 13CO. W ere this 13CO to bind terminal on Fed, it would also have too small a HFI to be observed. The presence of a bridging CO is consistent with the FT-IR results for Hhyd where the observed 1857 cm−1 peak is within the range of observed bridging CO stretch frequency.16 13CO/13CN HFI results also indicate that while Fed is almost completely diamagnetic, Fep still carries a small but non-negligible amount of spin density, which may account for the isomer shift differences (~0.2 mm/s) between these two Fe centers in Mössbauer spectroscopy.16
Interestingly, the 13C of 13CNp presents almost the same aiso as the 13C in 13COp of Hhyd, but with a much smaller dipolar part, T, 0.05 MHz vs. 0.30 MHz. It is even smaller than that of the 13CObridge, 0.22 MHz. Since the spin density in Hhyd is primarily on the [4Fe-4S]H cluster, the magnitude T can be estimated accounting for the distances between each 13C and the nearest Fe in the [4Fe-4S]H cluster, using the point dipole approximation and projection factors typical for [4Fe-4S]+ clusters.42, 47–49 In the X-ray crystal structure of CpI Hox (PDB ID: 3C8Y3), such distances are 3.8 Å, 5.0Å, and 5.6 Å, for 13COp, 13CNp, and 13CObridge, corresponding to T of 0.4, 0.2, and 0.15 MHz, respectively. Neglecting in this approximation possible structural rearrangements in forming Hhyd, it appears that the T of 13COp and 13CObridge are in agreement with the observed dipolar interactions, while the T of 13CNp is much smaller. The small anisotropy of 13CO/13CN− HFI on Fe centers has been attributed to the strong covalent bonds between Fe and these π-acid ligands.50 Upon formation of Hhyd, the [2Fe]H electronic configuration shifts from FeIIFeI to FeIIFeII, leading to weakening of the Fe-CO bonds, as demonstrated by the increased FT-IR stretch frequencies of CO in Hhyd compared to Hox indicating stronger C-O bonds, and with that, weaker Fe-CO bonds.10, 16 It is therefore possible that the weaker Fe-CO bonds in Hhyd result in the increased rhombicity of 13C HFI whereas the effects of Fe-CN bonds are much smaller.
[57Fe] in Hox.
The magnitudes of 13CO and 13CN− HFI serves as reporters for the spin density of the Fe centers to which these diatomic ligands bind. In Hox, however, while the 13CO/13CN− HFI on Fep and Fed are very different (vide supra), previous studies on [FeFe] hydrogenases from several organisms found only one set of nearly isotropic 57Fe HFI corresponding to the [2Fe]H (A 57Fe = 1 2.4 or 16–18 MHz).23, 27, 29 In an attempt to resolve this discrepancy, we sought to investigate the 57Fe HFI of Fep and Fed using a combination of ENDOR and HYSCORE spectroscopies. While the molecular mechanism of the H-cluster bioassembly remains only partly understood, we found that selective installation of 57Fe into the [2Fe]H subcluster can be achieved by simply supplementing 1 mM of 57Fe2+ in the maturation reaction instead of natural abundance (n.a.) Fe2+, using cell lysate and apo-HydA1 previously expressed with n.a. Fe-containing media. It seems likely that the 57Fe2+ in the solution may reconstitute into or exchange with the somewhat labile dangler Fe site in the auxiliary cluster of HydG,51 leading to the formation of an 57Fe-labeled Fe(CO)2(CN)(Cys) product of HydG which is then incorporated in the subsequent steps of H-cluster biosynthesis.29 We also used 15N-Tyr in the reaction simply to label the CN− ligands as C15N− in order to minimize any interference from the strong 14N features in HYSCORE spectra which could overlap with potential 57Fe crosspeaks.
We first studied the Hox state of this [257Fe]-CrHydA1 compared to a uniformly ([657Fe]) 57Fe-labeled sample. Q-band Davies ENDOR spectra (Figure 3A, red trace) recorded at g1 (2.103) and g3 (1.998) of the [257Fe] sample exhibit one major set of 57Fe HFI with A = 16 MHz (FeA), which is consistent with the previously reported ENDOR spectra of [257Fe]H-labeled CrHydA Hox.29 In contrast, the spectra lack the isotropic feature with A = 10.5 MHz (FeB) that has been previously assigned to the [4Fe-4S]H as here seen in the ENDOR spectra (Figure 3A, blue trace) of the [657Fe]-CrHydA1 Hox,29 validating our selective labeling strategy. In parallel, we recorded the Q-band HYSCORE spectra of the [657Fe]- and [257Fe]- CrHydA1 Hox samples, which disclosed two sets of 57Fe peaks in the [657Fe] sample and one set of 57Fe peaks in the [257Fe] sample, both in the second quadrant and absent in a parallel sample without 57Fe labeling (Figure 3B, C; Figure S4). Spectral simulation indicates that the extra 57Fe peak in the [657Fe] sample, which is quite isotopic, corresponds to the FeB feature ([4Fe-4S]H) observed in the ENDOR spectra (Figure S4). However, the 57Fe peak in the [257Fe] sample, FeC, does not correspond to the FeA feature observed via ENDOR, since the HFI of the latter is much larger. The relative intensity between these FeB and FeC feature in the [657Fe] vs. [257Fe] sample also rules out the remote possibility that FeC arises from a second 57Fe coupling in the small amount of the labeled [4Fe-4S]H in the [257Fe] sample. Based on these considerations, we assert that the FeC feature we observed in the Q-band HYSCORE spectra of the [257Fe]-CrHydA1 Hox sample arises from the second Fe in the [2Fe]H.
Figure 3.

(A) Comparison of the Q-band Davies ENDOR spectra of [257Fe]-CrHydA1 Hox (red trace) and [657Fe]-CrHydA1 Hox (blue trace) recorded at g = 2.103 and 1.998. (B) Comparison of the Q-band HYSCORE spectra of [657Fe]- (left panels), [257Fe]-(middle panels), and n.a. Fe (right panels) CrHydA1 Hox samples recorded at g = 2.103 and 1.998 showing the 57Fe peaks in the second quadrant. (C) Field-dependent Q-band 57Fe HYSCORE spectra of the [257Fe]-CrHydA1 Hox sample (red contours) and simulations of FeC (blue contours). Simulation: g = [2.103, 2.042, 1.998], A 57FeC = [6.5, −1.4, 12.0] MHz, Euler angle = [17, 50, 25]° Conditions for Davies-ENDOR: frequency, 34.1 GHz; temperature, 15 K; RF pulse, 50 μs; inversion pulse, 80 ns; π/2,12 ns; τ = 300 ns. Condition for Q-band HYSCORE: frequency, 34.1 GHz; temperature, 15 K; π/2, 12 ns; τ = 368, 392, 388, 368 ns at g = 2.103, 2.075, 2.042, 1.998, respectively; time increment along both dimensions was 24 ns with 270 steps.
The field-dependent HYSCORE spectra can be well-simulated with a rhombic 57Fe HFI tensor of A = [6.5, −1.4, 12.0] MHz (aiso = 5.7 MHz and T = [0.8, −7.1, 6.3] MHz, Figure 3C, Table 2). The β of 50° used in the simulation is in good agreement with the Fep-Fed-CObridge angle (44°) from the X-ray structure of the H-cluster (PDB: 3C8Y3), which is consistent with A3 being along the Fed-Fep vector if we assign g3 as pointing along the Fed-CObridge bonding vector (vide infra) No corresponding ENDOR signal could be identified for this HFI tensor (Figure S5), probably due to its large rhombicity. Since selective labeling of a single specific Fe in the [2Fe]H subcluster is not yet feasible, we cannot assign this 57Fe HFI to a specific Fe. However, the relatively smaller aiso suggests that this 57Fe HFI may be assigned to Fep, with the stronger 16–18 MHz (aiso ~ 17 MHz) coupling arising from Fed. In this case, the aiso (Fed)/aiso (Fep) ratio of 3.0 is more consistent with Fed carrying the majority spin density as inferred from 13C HFI results and theoretical predictions,21, 25, 31 although it is still approximately two-fold smaller than the aiso (13COd)/aiso (13COp) ratio (or that of the 13CN− ligands). This difference may be attributed to the rhombicity of the A-tensor of Fep, which may affect the 13C HFI in a manner we have not fully accounted.
Table 2.
Summary of 57Fe HFI of CrHydA1 H-cluster at different states
| H-cluster state | A 57Fe (MHz) | aiso (MHz) | [α, β, γ] (°) | assignment | reference |
|---|---|---|---|---|---|
| Hox | FeA: 16–18 | ~17 | Fed | 29 | |
| FeB: [10.4, 9.1, 10.2] | 9.9 | [0, 0, 0] | [4Fe-4S]H | 29, this work | |
| Fec: [6.5, −1.5, 12.0] | 5.7 | [17, 50, 25] | Fep | this work | |
| [2.2, 5.5, 5.5] | 4.4 | [0, 0, 0] | Fep | 53 | |
| Hox-CO | [−1.7, 2.8, 2.81 | 1.3 | [0, 15, 0] | Fed | 53 |
| see ref 51 | 27.6; 28.0; 30.0; 33.2 | [4Fe-4S]H | 53 | ||
| Hhyd | <0.3 | Fep and Fed | this work | ||
| [4Fe-4S]H | this work | ||||
| Fe4: [16.5, −0.5, 5.5] | 7.2 | [130, 35, 50] |
More importantly, the fact that the two Fe sites of the [2Fe]H are indeed electronically different is crucial for the catalytic activity of the [FeFe] hydrogenase. This Fe sites heterogeneity, together with the magnitudes of the hyperfine couplings, can be used as a guide for designing molecular models for [FeFe] hydrogenases. For instance, one such synthetic complex has been characterized, showing that the 57Fe HFI on the two Fe sites are different by a factor of ~2 in Hox models, similar to that found in the hydrogenase enzyme.52
[57Fe] in Hhyd
When the [257Fe]-CrHydA1 sample is poised in the Hhyd state, we expect to see small 57Fe HFI as the 13CO and 13CN− HFI on these Fe are very small (vide supra). Indeed, in the field-dependent Q-band HYSCORE spectra, we were only able to see intensity on the diagonal line at the Larmor frequency of 57Fe, likely from the two overlapping 57Fe HFI. The largest principal value of these 57Fe HFI was estimated by the feature at g2 which showed a width of ~0.3 MHz. Notably, since there was a small amount of Hox-CO in the Hhyd sample, HYSCORE spectra recorded at g = 2.008, g2 of Hox-CO, showed two sets of crosspeaks in the first and the second quadrant (Figure S6), corresponding to the Fed and Fep in this [257Fe]-Hox-CO, respectively. This HYSCORE patterns are identical to those of the previously reported CrHydA1 Hox-CO sample maturated using the synthetic [57Fe2 (CO)4(CN)2(adt)]2−, and can be well-simulated with the reported 57Fe HFI tensors.53 This further proves that both Fed and Fep are labeled in the sample.
The very small 57Fe HFI arising from the [2Fe]H supports the diamagnetic low-spin Fe2+ assignment of these two Fe sites. The 57Fe HFI of the remaining paramagnetic [4Fe-4S]H+ was then measured using the uniformly 57Fe-labeled Hhyd sample generated by reducing the [657Fe]-CrHydA1 with dithionite. The X-band CW EPR of the [657Fe]-CrHydA1 Hhyd, but not the [257Fe]-Hhyd, shows line broadening at g3 (Figure S7), indicating the presence of large 57Fe HFI from the [4Fe-4S]H of Hhyd, as expected. The Q-band field-dependent Davies ENDOR spectra further reveal these large 57Fe couplings (Fe1 and Fe2, Figure 5A), and are simulated with two sets of 57Fe HFI, with aiso of 28.2 MHz and 35.3 MHz, respectively (Table 2). These 57Fe hyperfine values are similar to that of the mixed-valance Fe2.5+ pair found in typical [4Fe-4S]+ clusters.48 More interestingly, additional 57Fe HFI are disclosed by Q-band HYSCORE spectroscopy, as indicated from the crosspeaks in the second quadrant of the HYSCORE spectra collected at g = 1.881, g3 of Hhyd (Fe3 and Fe4, Figure 5B). Simulation of the field-dependent HYSCORE spectra (Figure 5B and S8) gives two 57Fe HFI tensors, a rhombic one with aiso of 7.5 MHz (Figure 5B and S8, blue contours) and an axial one with aiso of 16.6 MHz (Figure 5B and S8, green contours), corresponding to the two remaining Fe2+ in the [4Fe-4S]H (Table 2). The aiso of 16.6 MHz is comparable to typical 57Fe HFI of ferrous pair (Fe2+) found in the [4Fe-4S]+ clusters of various ferredoxins and synthetic systems, whereas the aiso of 7.2 MHz is much smaller than these typical values.48 It has been noted in aconitase that the unique substrate-binding Fe has the smallest 57Fe HFI among the four Fe.48, 54 It is likely that in Hhyd, this small 57Fe HFI also arises from the unique Fe2+ that is coordinated by the bridging Cys residue by which the [4Fe-4S]H is linked to the [2Fe]H. Together, these 57Fe HFI results depict the electronic structure of [4Fe-4S]H in Hhyd as having antiferromagnetically coupled Fe2 5+ pair and Fe2+ pair, leading to an S = 1/2 subcluster. However, the presence of the [2Fe]H in close proximity has considerably affected the electronic structure of the [4Fe-4S]H, most significantly so on the unique Fe, despite the former being formally diamagnetic.
Figure 5.

(A) Q-band field-dependent Davies ENDOR spectra of uniformly 57Fe-labeled CrHydA1 (black traces) simulated using two 57Fe A-tensors: g = [2.076, 1.936, 1.881]; A 57Fe1 = [20.0, 29.5, 35.0] MHz, Euler angle = [140, 35, 40]° (purple traces); A 57Fe2 = [35.0, 31.5, 39.5] MHz, Euler angle = [120, 35, 0]° (red traces). (B) Q-band HYSCORE spectrum of uniformly 57Fe-labeled CrHydA1 recorded at g3 = 1.881 (left) and simulation with two 57Fe A-tensors (right): g = [2.076, 1.936, 1.881]; A 57Fe3 = [20.2, 21.0, 8.5] MHz, Euler angle =[120, 35, 0]° (green contours); A 57Fe4 = [16.5, −0.5, 5.5] MHz, Euler angle = [130, 35, 50]° (blue contours). See Figure S8 for HYSCORE spectra and simulations recorded at other g values. Conditions for Davies-ENDOR: frequency, 34.0 GHz; temperature, 10 K; RF pulse, 50 μs; inversion pulse, 80 ns; π/2, 12 ns; τ = 300 ns. Condition for Q-band HYSCORE: frequency, 34.0 GHz; temperature, 10 K; π/2, 12 ns; τ = 300 ns; time increment along both dimensions was 24 ns with 270 steps.
The 13C and 57Fe HFI results of Hhyd validate the electronic structural description proposed from Mössbauer spectroscopy that the [2Fe]H contains two diamagnetic low-spin Fe2+.16 The small 13C and 57Fe HFI in the [2Fe]H most likely arise from spin delocalization via covalency and spin polarization, and the exchange interaction to the [4Fe-4S]H is almost nil because of the much higher energy gap between the S = 0 and S = 1 states for low-spin Fe2+. It is therefore safe to write Hhyd as [4Fe-4S]H+-[FeIIFeII]-H−. The diamagnetic nature of the [2Fe]H is also consistent with the recently reported 1H NMR spectra of Hhyd, in which the terminal hydride has a very small, if any, paramagnetic shift.13 As noted above, the small 13C and 57Fe HFI in Hhyd are reminiscent of that in the HydG reaction intermediate we recently characterized—the [4Fe-4S]+ -[(Cys)FeII(CO)(CN)] intermediate termed “Complex A” also harbors a CO and CN− bound low-spin Fe2+.32 But compared to Complex A, the 13C and 57Fe HFI are even smaller in Hhyd, indicating a smaller spin density on Fep and Fed in Hhyd. This difference could be due to a variety of factors. The nearest iron of the [4Fe-4S] could be closer to the dangler Fe in Complex A; it could have a larger spin projection value; or the Fe-SCys-Fe bond angle could be more amenable for spin delocalization via covalency.
If we view Hhyd as resulting from the binding of an H− onto the Fed of Hox, this is accompanied by the movement of one electron from the [2Fe]H to the [4Fe-4S]H. This is exactly opposite to the cases of Hred/HredH+—recently identified to be [4Fe-4S]H+-[FeIFeII]H and [4Fe-4S]H2+-[FeIFeI]H-(NH2+) respectively—where the protonation on the adt amine is accompanied by one electron moving from the [4Fe-4S]H to the [2Fe]H.8 It appears that the net charge on the [2Fe]H tends to remain unchanged, as implied in previous work as the “neutralization effect”.8 The [4Fe-4S]H—in addition to its roles in mediating electron transfer in catalysis—could serve as an electron sink or source to facilitate electronic rearrangement during the catalytic cycle in order to maintain the overall structural integrity of the H-cluster. In this regard, further protonation of Hhyd on the adt amine would lead to a HhydH+ state that is proposed to adopt a [4Fe-4S]H2+-[FeIIFeI]H-(NH2+)-H− configuration and to release H2 rapidly before returning to Hox.18 Spectroscopic characterization on this transient species would be of great interest if conditions favoring its accumulation can be found since in HhydH+, the spin density is purported to be localized on the [2Fe]H again, and one would expect to see the much larger 1H HFI of the terminal hydride (or H2 molecule) bound to Fed directly by EPR/ENDOR spectroscopy.
Conclusion
The in vitro biosynthetic route to the H-cluster has demonstrated its convenience and versatility to site-specifically label the H-cluster with desired magnetic nuclei. This biochemical approach, combined with advanced EPR spectroscopic techniques, allow us to study the electronic structure of the H-cluster at two catalytic states, Hox and Hhyd. For Hox, we measured the 13C HFI of the three 13CO ligands, which is a natural outgrowth of our previous work on the two 13CN− ligands. We re-investigated the 57Fe HFI of the [2Fe]H, and identified for the first time a second set of 57Fe HFI. This work shows that the two Fe in the [2Fe]H have different HFI, which agrees with the results from the spectroscopic study of the 13CO/13CN ligands on these Fe sites, and largely solves a controversy from previous spectroscopic and theoretical studies. For Hhyd, we detected very small 13C and 57Fe HFI in the [2Fe]H subcluster, and four much larger 57Fe HFI in the [4Fe-4S]H subcluster, consistent with the proposed electronic structural description of Hhyd as [4Fe-4S]H+[FeIIFeII]-H−. Overall, our work represents a comprehensive spectroscopic investigation on the H-cluster. These results, together with the numerous recent advances with the [FeFe] hydrogenases, helps enhance our understanding on this unique cofactor, and guide de novo design of molecular catalysts for hydrogen evolution.
Supplementary Material
Figure 4.

Q-band HYSCORE spectra of [257Fe]-CrHydA1 Hhyd recorded at three principal g values. Conditions: temperature, 10 K; τ = 300 ns; and other settings as indicated in Figure 3.
Synopsis:
The electronic structures of the two catalytic states of the [FeFe] hydrogenase H-cluster, Hox and Hhyd, are studied by probing the hyperfine couplings of the 13C and 57Fe nuclei in site-specific isomiddlee-labeled H-cluster. For Hox, two different 57Fe hyperfine interactions are observed for the two Fe sites of the spin-carrying [2Fe]H subcluster. For Hhyd, the weakly coupled 13C and 57Fe are detected, consistent with previous description of this newly identified form of H-cluster.
Acknowledgment
We thank J. Swartz (Stanford) for providing E. coli strains overexpressing apo-CrHydA1, holo-CrHydA1, SoHydE, SoHydF and SoHydG, D.L.M. Suess and R. Sayler for preliminary ENDOR results on [13CO]-CpI Hox, W. Myers for initial spectroscopic results on [`Fe]-HydA1 Hox, and T. Stich for helpful discussions and proofreading the manuscript. This work was supported by the National Institutes of Health (GM-104543 and 1R35GM126961–01).
Footnotes
Supporting Information
Supporting information available: X- and Q-band HYSCORE spectra of [13CO]-Hox; Q-band Davies ENDOR spectrum of [13CO]-Hox-CO; VMT Mims-ENDOR spectra of [13CO]-Hhyd; simulation of Q-band ENDOR and HYSCORE spectra of FeB feature; simulation of Q-band 57Fe ENDOR spectra of [257Fe]-Hox; Q-band HYSCORE spectrum of [257Fe]-Hhyd at g = 2.008 and simulation; comparison of X-band CW EPR spectra of Hhyd, [257Fe]-, and [657Fe]-Hhyd; Simulation of field-dependent Q-band HYSCORE spectra of [657Fe]-Hhyd
Notes
The authors declare no conflict of interest.
References
- 1.Lubitz W; Ogata H; Rudiger O; Reijerse E, Hydrogenases. Chem. Rev 2014, 114 (8), 4081–148. [DOI] [PubMed] [Google Scholar]
- 2.Vignais PM; Billoud B, Occurrence, classification, and biological function of hydrogenases: an overview. Chem. Rev 2007, 107 (10), 4206–72. [DOI] [PubMed] [Google Scholar]
- 3.Pandey AS; Harris TV; Giles LJ; Peters JW; Szilagyi RK, Dithiomethylether as a ligand in the hydrogenase H-cluster. J. Am. Chem Soc 2008, 130 (13), 4533–40. [DOI] [PubMed] [Google Scholar]
- 4.Peters JW; Lanzilotta WN; Lemon BJ; Seefeldt LC, X-ray crystal structure of the Fe- only hydrogenase (CpI) from Clostridium pasteurianum to 1.8 angstrom resolution. Science 1998, 282 (5395), 1853–8. [DOI] [PubMed] [Google Scholar]
- 5.Nicolet Y; Piras C; Legrand P; Hatchikian CE; Fontecilla-Camps JC, Desulfovibrio desulfuricans iron hydrogenase: the structure shows unusual coordination to an active site Fe binuclear center. Structure 1999, 7 (1), 13–23. [DOI] [PubMed] [Google Scholar]
- 6.Silakov A; Wenk B; Reijerse E; Lubitz W, 14N HYSCORE investigation of the H-cluster of [FeFe] hydrogenase: evidence for a nitrogen in the dithiol bridge. Phys. Chem. Chem. Phys 2009, 11 (31), 6592–9. [DOI] [PubMed] [Google Scholar]
- 7.Chongdar N; Birrell JA; Pawlak K; Sommer C; Reijerse EJ; Rudiger O; Lubitz W; Ogata H, Unique spectroscopic properties of the H-cluster in a putative sensory [FeFe] hydrogenase. J. Am. Chem. Soc 2018, 140 (3), 1057–1068. [DOI] [PubMed] [Google Scholar]
- 8.Sommer C; Adamska-Venkatesh A; Pawlak K; Birrell JA; Rüdiger O; Reijerse EJ; Lubitz W, Proton coupled electronic rearrangement within the H-cluster as an essential step in the catalytic cycle of [FeFe] hydrogenases. J. Am. Chem. Soc 2017, 139 (4), 1440–1443. [DOI] [PubMed] [Google Scholar]
- 9.Adamska-Venkatesh A; Krawietz D; Siebel J; Weber K; Happe T; Reijerse E; Lubitz W, New redox states observed in [FeFe] hydrogenases reveal redox coupling within the H-cluster. J. Am. Chem. Soc 2014, 136 (32), 11339–46. [DOI] [PubMed] [Google Scholar]
- 10.Adamska A; Silakov A; Lambertz C; Rüdiger O; Happe T; Reijerse E; Lubitz W, Identification and characterization of the “super-reduced” state of the H-cluster in [FeFe] hydrogenase: A new building block for the catalytic cycle? Angew. Chem. Int. Ed 2012, 51 (46), 11458–11462. [DOI] [PubMed] [Google Scholar]
- 11.Katz S; Noth J; Horch M; Shafaat HS; Happe T; Hildebrandt P; Zebger I, Vibrational spectroscopy reveals the initial steps of biological hydrogen evolution. Chem Sci. 2016, 7 (11), 6746–6752. [DOI] [PMC free article] [PubMed] [Google Scholar]
- 12.Popescu CV; Münck E, Electronic structure of the H cluster in [Fe]-hydrogenases. J. Am. Chem. Soc 1999, 121 (34), 7877–7884. [Google Scholar]
- 13.Rumpel S; Sommer C; Reijerse E; Fares C; Lubitz W, Direct detection of the terminal hydride intermediate in [FeFe] hydrogenase by NMR spectroscopy. J. Am. Chem Soc 2018. [DOI] [PubMed] [Google Scholar]
- 14.Winkler M; Senger M; Duan J; Esselborn J; Wittkamp F; Hofmann E; Apfel UP; Stripp ST; Happe T, Accumulating the hydride state in the catalytic cycle of [FeFe]-hydrogenases. Nat Commun 2017, 8, 16115. [DOI] [PMC free article] [PubMed] [Google Scholar]
- 15.Reijerse EJ; Pham CC; Pelmenschikov V; Gilbert-Wilson R; Adamska-Venkatesh A; Siebel JF; Gee LB; Yoda Y; Tamasaku K; Lubitz W; Rauchfuss TB; Cramer SP, Direct observation of an iron-bound terminal hydride in [FeFe]-hydrogenase by nuclear resonance vibrational spectroscopy. J. Am. Chem. Soc 2017, 139 (12), 4306–4309. [DOI] [PMC free article] [PubMed] [Google Scholar]
- 16.Mulder DW; Guo Y; Ratzloff MW; King PW, Identification of a catalytic iron-hydride at the H-cluster of [FeFe]-hydrogenase. J. Am. Chem. Soc 2017, 139 (1), 83–86. [DOI] [PubMed] [Google Scholar]
- 17.Mulder DW; Ratzloff MW; Bruschi M; Greco C; Koonce E; Peters JW; King PW, Investigations on the role of proton-coupled electron transfer in hydrogen activation by [FeFe]-hydrogenase. J. Am. Chem. Soc 2014, 136 (43), 15394–15402. [DOI] [PubMed] [Google Scholar]
- 18.Pelmenschikov V; Birrell JA; Pham CC; Mishra N; Wang H; Sommer C; Reijerse E; Richers CP; Tamasaku K; Yoda Y; Rauchfuss TB; Lubitz W; Cramer SP, Reaction coordinate leading to H2 production in [FeFe]-hydrogenase Iidentified by nuclear resonance vibrational spectroscopy and density functional theory. J. Am. Chem. Soc 2017, 139 (46), 16894–16902. [DOI] [PMC free article] [PubMed] [Google Scholar]
- 19.Carroll ME; Barton BE; Rauchfuss TB; Carroll PJ, Synthetic models for the active site of the [FeFe]-hydrogenase: Catalytic proton reduction and the structure of the doubly protonated intermediate. J. Am. Chem. Soc 2012, 134 (45), 18843–18852. [DOI] [PMC free article] [PubMed] [Google Scholar]
- 20.Kalz KF; Brinkmeier A; Dechert S; Mata RA; Meyer F, Functional model for the [Fe] hydrogenase inspired by the frustrated lewis pair concept. J. Am. Chem Soc 2014, 136 (47), 16626–16634. [DOI] [PubMed] [Google Scholar]
- 21.Fiedler AT; Brunold TC, Computational studies of the H-cluster of Fe-only hydrogenases: Geometric, electronic, and magnetic properties and their dependence on the [Fe4S4] cubane. Inorg. Chem 2005, 44 (25), 9322–9334. [DOI] [PubMed] [Google Scholar]
- 22.Silakov A; Reijerse EJ; Lubitz W, Unraveling the electronic properties of the photoinduced states of the H - cluster in the [FeFe] hydrogenase from D. desulfuricans. Eur. J. Inorg. Chem 2011, 2011 (7), 1056–1066. [Google Scholar]
- 23.Silakov A; Reijerse EJ; Albracht SPJ; Hatchikian EC; Lubitz W, The electronic structure of the H-cluster in the [FeFe]-hydrogenase from Desulfovibrio desulfuricans: A Q-band 57Fe-ENDOR and HYSCORE study. J. Am. Chem. Soc 2007, 129 (37), 11447–11458. [DOI] [PubMed] [Google Scholar]
- 24.Silakov A; Wenk B; Reijerse E; Albracht SP; Lubitz W, Spin distribution of the H-cluster in the Hox-CO state of the [FeFe] hydrogenase from Desulfovibrio desulfuricans: HYSCORE and ENDOR study of 14N and 13C nuclear interactions. J. Biol. Inorg. Chem 2009, 14 (2), 301–13. [DOI] [PubMed] [Google Scholar]
- 25.Myers WK; Stich TA; Suess DLM; Kuchenreuther JM; Swartz JR; Britt RD, The cyanide ligands of [FeFe] hydrogenase: Pulse EPR studies of 13C and 15N-labeled H-cluster. J. Am. Chem. Soc 2014, 136 (35), 12237–12240. [DOI] [PMC free article] [PubMed] [Google Scholar]
- 26.Telser J; Benecky MJ; Adams MW; Mortenson LE; Hoffman BM, An EPR and electron nuclear double resonance investigation of carbon monoxide binding to hydrogenase I (bidirectional) from Clostridium pasteurianum W5. J. Biol. Chem 1986, 261 (29), 13536–41. [PubMed] [Google Scholar]
- 27.Wang G; Benecky MJ; Huynh BH; Cline JF; Adams MW; Mortenson LE; Hoffman BM; Munck E, Mossbauer and electron nuclear double resonance study of oxidized bidirectional hydrogenase from Clostridium pasteurianum W5. J. Biol. Chem 1984, 259 (23), 14328–31. [PubMed] [Google Scholar]
- 28.Rumpel S; Ravera E; Sommer C; Reijerse E; Fares C; Luchinat C; Lubitz W, 1H NMR spectroscopy of [FeFe] hydrogenase: Insight into the electronic structure of the active site. J. Am. Chem. Soc 2018, 140 (1), 131–134. [DOI] [PMC free article] [PubMed] [Google Scholar]
- 29.Kuchenreuther JM; Myers WK; Suess DL; Stich TA; Pelmenschikov V; Shiigi SA; Cramer SP; Swartz JR; Britt RD; George SJ, The HydG enzyme generates an Fe(CO)2(CN) synthon in assembly of the FeFe hydrogenase H-cluster. Science 2014, 343 (6169), 424–7. [DOI] [PMC free article] [PubMed] [Google Scholar]
- 30.Silakov A; Reijerse EJ; Albracht SP; Hatchikian EC; Lubitz W, The electronic structure of the H-cluster in the [FeFe]-hydrogenase from Desulfovibrio desulfuricans: a Q-band 57Fe-ENDOR and HYSCORE study. J. Am. Chem. Soc 2007, 129 (37), 11447–58. [DOI] [PubMed] [Google Scholar]
- 31.Greco C; Silakov A; Bruschi M; Ryde U; Gioia LD; Lubitz W, Magnetic properties of [FeFe] - hydrogenases: A theoretical investigation based on extended QM and QM/MM models of the H - cluster and its surroundings. Eur. J. Inorg. Chem 2011, 2011 (7), 1043–1049. [Google Scholar]
- 32.Rao G; Tao L; Suess DLM; Britt RD, A [4Fe-4S]-Fe(CO)(CN)-L-cysteine intermediate is the first organometallic precursor in [FeFe] hydrogenase H-cluster bioassembly. Nat. Chem 2018, 10 (5), 555–560. [DOI] [PMC free article] [PubMed] [Google Scholar]
- 33.Kuchenreuther JM; Myers WK; Stich TA; George SJ; Nejatyjahromy Y; Swartz JR; Britt RD, A radical intermediate in tyrosine scission to the CO and CN− ligands of FeFe hydrogenase. Science 2013, 342 (6157), 472–5. [DOI] [PubMed] [Google Scholar]
- 34.Mulder DW; Boyd ES; Sarma R; Lange RK; Endrizzi JA; Broderick JB; Peters JW, Stepwise [FeFe]-hydrogenase H-cluster assembly revealed in the structure of HydA(DeltaEFG). Nature 2010, 465 (7295), 248–51. [DOI] [PubMed] [Google Scholar]
- 35.Posewitz MC; King PW; Smolinski SL; Zhang L; Seibert M; Ghirardi ML, Discovery of two novel radical S-adenosylmethionine proteins required for the assembly of an active [Fe] hydrogenase. J. Biol. Chem 2004, 279 (24), 25711–20. [DOI] [PubMed] [Google Scholar]
- 36.Shepard EM; McGlynn SE; Bueling AL; Grady-Smith CS; George SJ; Winslow MA; Cramer SP; Peters JW; Broderick JB, Synthesis of the 2Fe subcluster of the [FeFe]-hydrogenase H cluster on the HydF scaffold. Proc. Natl. Acad. Sci. U. S. A 2010, 107 (23), 10448–53. [DOI] [PMC free article] [PubMed] [Google Scholar]
- 37.Kuchenreuther JM; Shiigi SA; Swartz JR, Cell-free synthesis of the H-cluster: a model for the in vitro assembly of metalloprotein metal centers. Methods Mol. Biol 2014, 1122, 49–72. [DOI] [PubMed] [Google Scholar]
- 38.Boyer ME; Stapleton JA; Kuchenreuther JM; Wang CW; Swartz JR, Cell-free synthesis and maturation of [FeFe] hydrogenases. Biotechnol. Bioeng 2008, 99 (1), 59–67. [DOI] [PubMed] [Google Scholar]
- 39.Kuchenreuther JM; Britt RD; Swartz JR, New insights into [FeFe] hydrogenase activation and maturase function. PLoS Оne 2012, 7 (9), e45850. [DOI] [PMC free article] [PubMed] [Google Scholar]
- 40.Calvo R; Abresch EC; Bittl R; Feher G; Hofbauer W; Isaacson RA; Lubitz W; Okamura MY; Paddock ML, EPR study of the molecular and electronic structure of the semiquinone biradical Qa−•Qb−• in photosynthetic reaction centers from Rhodobacter sphaeroides. J. Am. Chem. Soc 2000, 122 (30), 7327–7341. [Google Scholar]
- 41.Stoll S; Schweiger A, EasySpin, a comprehensive software package for spectral simulation and analysis in EPR. J. Magn. Reson 2006, 178 (1), 42–55. [DOI] [PubMed] [Google Scholar]
- 42.Weil JA; Bolton JR, Hyperfine (A) anisotropy In Electron Paramagnetic Resonance, John Wiley & Sons, Inc.: 2006; pp 118–157. [Google Scholar]
- 43.Schweiger A; Jeschke G, Principles of pulse electron paramagnetic resonance. Oxford University Press: USA, 2001. [Google Scholar]
- 44.Kuchenreuther JM; George SJ; Grady-Smith CS; Cramer SP; Swartz JR, Cell-free H-cluster synthesis and [FeFe] hydrogenase activation: All five CO and CN− ligands derive from tyrosine. PLoS One 2011, 6 (5), e20346. [DOI] [PMC free article] [PubMed] [Google Scholar]
- 45.Kamp C; Silakov A; Winkler M; Reijerse EJ; Lubitz W; Happe T, Isolation and first EPR characterization of the [FeFe]-hydrogenases from green algae. Biochim. Biophys. Acta 2008, 1777 (5), 410–6. [DOI] [PubMed] [Google Scholar]
- 46.Epel B; Niklas J; Antonkine ML; Lubitz W, Absolute signs of hyperfine coupling constants as determined by pulse ENDOR of polarized radical pairs. Appl. Magn. Reson 2006, 30 (3), 311–327. [Google Scholar]
- 47.Walsby CJ; Hong W; Broderick WE; Cheek J; Ortillo D; Broderick JB; Hoffman BM, Electron-nuclear double resonance spectroscopic evidence that S-adenosylmethionine binds in contact with the catalytically active [4Fe-4S]+ cluster of pyruvate formate-lyase activating enzyme. J. Am. Chem. Soc 2002, 124 (12), 3143–3151. [DOI] [PubMed] [Google Scholar]
- 48.Mouesca JM; Noodleman L; Case DA; Lamotte B, Spin-densities and spin coupling in iron-sulfur clusters - a new analysis of hyperfine coupling-constants. Inorg. Chem 1995, 34 (17), 4347–4359. [Google Scholar]
- 49.Weil JA; Bolton JR, The interpretation of EPR parameters In Electron Paramagnetic Resonance, John Wiley & Sons, Inc.: 2006; pp 253–300. [Google Scholar]
- 50.Telser J; Smith ET; Adams MWW; Conover RC; Johnson MK; Hoffman BM, Cyanide binding to the novel 4Fe ferredoxin from Pyrococcus Furiosus: Investigation by EPR and ENDOR spectroscopy. J. Am. Chem. Soc 1995, 117 (18), 5133–5140. [Google Scholar]
- 51.Suess DL; Burstel I; De La Paz L; Kuchenreuther JM; Pham CC; Cramer SP; Swartz JR; Britt RD, Cysteine as a ligand platform in the biosynthesis of the FeFe hydrogenase H cluster. Proc. Natl. Acad. Sci. U. S. A 2015, 112 (37), 11455–60. [DOI] [PMC free article] [PubMed] [Google Scholar]
- 52.Stoian SA; Hsieh CH; Singleton ML; Casuras AF; Darensbourg MY; McNeely K; Sweely K; Popescu CV, Hyperfine interactions and electron distribution in Fe(II)Fe (I) and Fe (I)Fe (I) models for the active site of the [FeFe] hydrogenases: Mossbauer spectroscopy studies of low-spin Fe(I.). J. Biol. Inorg. Chem 2013, 18 (6), 609–22. [DOI] [PubMed] [Google Scholar]
- 53.Gilbert-Wilson R; Siebel JF; Adamska-Venkatesh A; Pham CC; Reijerse E; Wang H; Cramer SP; Lubitz W; Rauchfuss TB, Spectroscopic investigations of [FeFe] hydrogenase maturated with [57Fe2(adt)(CN)2(CO)4]2−. J. Am. Chem. Soc 2015, 137 (28), 8998–9005. [DOI] [PMC free article] [PubMed] [Google Scholar]
- 54.Werst MM; Kennedy MC; Houseman AL; Beinert H; Hoffman BM, Characterization of the [4Fe-4S]+ cluster at the active site of aconitase by 57Fe, 33S, and 14N electron nuclear double resonance spectroscopy. Biochemistry 1990, 29 (46), 10533–40. [DOI] [PubMed] [Google Scholar]
Associated Data
This section collects any data citations, data availability statements, or supplementary materials included in this article.