

SUMMARY
Ebola virus (EBOV) infection often results in fatal illness in humans, yet little is known about how EBOV usurps host pathways during infection. To address this, we used affinity tag-purification mass spectrometry (AP-MS) to generate an EBOV-host protein-protein interaction (PPI) map. We uncovered 194 high-confidence EBOV-human PPIs, including one between the viral transcription regulator VP30 and the host ubiquitin ligase RBBP6. Domain mapping identified a 23 amino acid region within RBBP6 that binds to VP30. A crystal structure of the VP30-RBBP6 peptide complex revealed that RBBP6 mimics the viral nucleoprotein (NP) binding to the same interface of VP30. Knockdown of endogenous RBBP6 stimulated viral transcription and increased EBOV replication, whereas overexpression of either RBBP6 or the peptide strongly inhibited both. These results demonstrate the therapeutic potential of biologies that target this interface and identify additional PPIs that may be leveraged for novel therapeutic strategies.
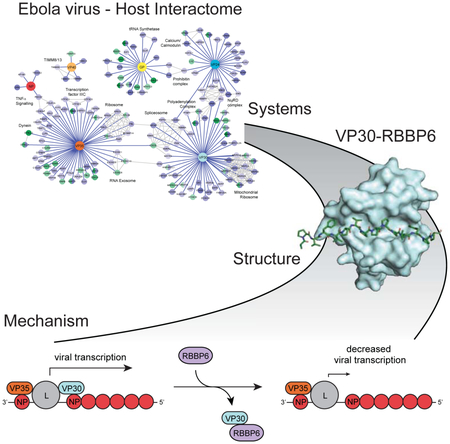
Graphical Abstract
In Brief
A host-Ebola protein-protein interaction map identifies candidate drug targets including a host ubiquitin ligase that prevents viral replication, peptide mimics of which strongly inhibit Ebola replication in multiple cell types.
INTRODUCTION
Ebola virus (EBOV) is an enveloped negative-sense RNA virus and zoonotic pathogen that has caused repeated outbreaks of severe, frequently lethal, human disease over the past four decades. The largest such outbreak occurred in West Africa between 2013 and 2016 causing approximately 28,000 infections and 11,000 deaths (Bausch and Rojek, 2016). EBOV is a member of the filovirus family which consists of three genera, Ebolavirus, Marburgvirus and Cuevavirus. The Ebolavirus genus includes five species: Zaire ebolavirus (also known as Ebola virus (EBOV)), Sudan ebolavirus (SUDV), Bundibugyo ebolavirus (BDBV), Tai Forest ebolavirus (TAFV) and Reston ebolavirus (RESTV). Marburg virus (MARV) and Lloviu virus (LLOV) are the sole members of the Marburgvirus and Cuevavirus genres, respectively (Afonso et al., 2016; Negredo et al., 2011). EBOV, several other members of the Ebolavirus genus, and MARV have all caused documented human disease, often in the context of highly lethal outbreaks (Baron et al., 1983; Georges et al., 1999; Lamunu et al., 2004; Le Guenno et al., 1999; Towner et al., 2006; Towner et al., 2008).
The EBOV genome is approximately 19 kilobases in length and encodes at least 9 translation products from 7 separate transcriptional units (Feldmann et al., 2015; Messaoudi et al., 2015). These genes encode the viral nucleoprotein (NP), viral protein of 35 kDa (VP35), VP40, a secreted glycoprotein (sGP), a type I transmembrane glycoprotein (GP), a second secreted glycoprotein (ssGP), VP30, VP24, and the large protein (L), which is the viral polymerase (Kirchdoerfer et al., 2017). NP associates with the viral genomic and antigenomic RNAs throughout the course of infection and is required for viral mRNA synthesis (transcription) and viral genome RNA replication (Muhlberger, 2007; Su et al., 2018). VP35, a critical non-enzymatic cofactor for the viral RNA-dependent RNA polymerase, is required for viral RNA synthesis and also serves as a potent suppressor of innate antiviral signaling pathways (Basler et al., 2000; Cardenas et al., 2006; Leung et al., 2010; Luthra et al., 2013). VP40 protein is the major viral matrix protein and it drives virus budding and release. sGP and ssGP are both secreted from cells, though their functions are largely unknown. GP is the only viral protein present on the virion surface and it is responsible for mediating viral attachment and fusion with cell membranes. VP30 is a viral transcriptional regulator that interacts with NP, L and VP35 (Biedenkopf et al., 2013; Groseth et al., 2009). VP24, through interaction with NP and VP35, plays a role in formation of filamentous nucleocapsid structures, promotes virion infectivity, and, through interactions with karyopherin alpha proteins, suppresses interferon (IFN)-induced antiviral signaling (Banadyga et al., 2017; Huang et al., 2002; Reid et al., 2006; Reid et al., 2007; Xu et al., 2014). The enzymatic activities required for viral transcription and genome replication, including RNA-dependent RNA polymerase, guanyltransferase and methyltransferase activities, reside in the L protein (Boehmann et al., 2005; Muhlberger, 2007; Muhlberger et al., 1999).
To date, relatively little is understood about how these proteins interact with the cellular factors and the host pathways involved. Viruses modify the intracellular environment of infected host cells to both enable virus replication and subvert antiviral defenses. Many of these changes are attributable to virus-host protein-protein interactions. Due to the limited coding capacity of many viral genomes, especially of RNA viruses, viral proteins are often multifunctional and interact with several host proteins in one or more independent complexes (Shah et al., 2015). For interactions that are critical to viral replication and pathogenesis, small molecules or biologics that interrupt these interfaces could potentially serve as therapeutic agents. Systematic protein-protein interaction mapping has revealed critical insights into the lifecycle of several viral species, including human immunodeficiency virus (HIV), hepatitis C virus (HCV), influenza A virus (IAV), and Kaposi’s sarcoma-associated herpesvirus (KSHV) (Davis et al., 2015; Jager et al., 2011a; Ramage et al., 2015; Watanabe et al., 2014), among others, but while efforts have been made to identify interactors of individual EBOV proteins, a comprehensive understanding of EBOV-human protein-protein interactions is lacking (Garcia-Dorival et al., 2016; Garcia-Dorival et al., 2014; Pichlmair et al., 2012; Yamayoshi et al., 2008).
To better understand how EBOV re-wires the host cell and usurps host cell functions, we generated a systematic EBOV-human protein-protein interaction map that reflects the known functions of the EBOV viral proteins and reveals several novel connections that will inform further mechanistic studies. One of these novel interactions, between the viral protein VP30 and the host ubiquitin ligase RBBP6, was found to structurally mimic the viral-viral protein interaction between VP30 and NP, suggesting that RBBP6 may interfere with viral RNA synthesis. Indeed, while overexpression of RBBP6 decreased EBOV RNA synthesis, knock-down of RBBP6 increased transcriptional activity and increased viral replication. Furthermore, expression of an RBBP6 peptide sufficient to bind VP30 decreased EBOV RNA synthesis and severely inhibited replication, suggesting this interface could serve as a therapeutic target.
RESULTS AND DISCUSSION
Generation of an EBOV Protein-Human Protein Interaction Map
To gain further insight into the molecular underpinnings of EBOV infection, we employed a systematic affinity tag-purification mass spectrometry (AP-MS) approach to define the human proteins and complexes that physically interact with EBOV proteins (Figure 1A). The 7 processed EBOV proteins (NP, VP35, VP40, GP, VP30, VP24, and L; Figure 1B) were cloned and individually expressed with either N-terminal or C-terminal 2XStrep tags in HEK293T and Huh7 cells. Steady-state levels of the L protein were insufficient for AP-MS in either cell line, so these samples were excluded from further analysis. The other 6 tagged proteins were affinity purified in biological triplicate (at minimum) and subjected to analysis by mass spectrometry to identify co-purifying proteins (Figure 1C) (Davis et al., 2015; Jager et al., 2011a; Jager et al., 2011b; Mirrashidi et al., 2015; Ramage et al., 2015). To identify high-confidence protein-protein interactions, we used the MiST algorithm (Mass spectrometry interaction STatistics) (Jager et al., 2011b; Mirrashidi et al., 2015), which uses three criteria from the mass spectrometry data (specificity, reproducibility and abundance) to quantitatively score protein-protein interactions (PPIs) (Supplemental Table S1). Using a MiST cut-off of 0.75 (Jager et al., 2011a), we identified 194 high-confidence PPIs (147 in HEK293T, 47 in Huh7), with 24 interactions found in both cell lines (Figure 1D).
FIGURE 1. An affinity tag-purification mass spectrometry approach for the study of EBOV virus protein-protein interactions.

(A) A schematic representation of the AP-MS approach for identifying EBOV-human protein-protein interactions in HEK293T and Huh7 cells.
(B) A schematic representation of the EBOV genome and the principal functions of each encoded viral protein. The secreted glycoproteins (sGP and ssGP) are not represented and were not examined in this study.
(C) Silver stain of the eluted fraction following Strep affinity purification of the indicated bait proteins from HEK293T cells. Red arrows denote the bait protein in each lane.
(D) Bar graph summarizing the number of human proteins identified as interacting with each of the indicated EBOV baits. See also Supplemental Table S1.
(E) Heat map of KEGG terms significantly enriched (p-value < 0.05) among the human interacting proteins of the indicated EBOV baits. Darker shading indicates a more significant enrichment of the given KEGG term. There were no significantly enriched KEGG terms among the human proteins interacting with VP40 or NP. KEGG terms are clustered on the vertical axis by correlation between enrichment profiles across the depicted baits.
(F) Heat map of protein domain types significantly enriched (p-value < 0.05) among the human interacting proteins of the indicated EBOV baits. Darker shading indicates a more significant enrichment of the given domain type. There were no significantly enriched domain types among the human proteins interacting with VP40 or NP. KEGG terms are clustered on the vertical axis by correlation between enrichment profiles across the depicted baits.
(G) Venn diagram demonstrating the overlap in identified PPIs between this study and a previously published study by Garcia-Dorival et al. that focused on VP24 interactions in HEK293T cells. Nine PPIs were conserved among both studies as listed on the right.
Functional enrichment analysis of the prey identified a number of KEGG pathways enriched for the known functions and localizations of the baits. For example, VP35, which binds dsRNA and is required for viral replication, associates with proteins whose functions are enriched in ribosome biogenesis and RNA degradation pathways. Similarly, the viral glycoprotein, GP, co-purifies proteins linked to N-glycan biosynthesis, and the viral transcription factor, VP30, associates with factors involved with RNA transport and surveillance (Figure 1E). Domain enrichment analysis of the interacting proteins for each bait likewise revealed predictable associations, i.e. both VP35 and VP30 interactors are enriched for proteins that harbor nucleic acid binding domains (Figure 1F). Comparing these results to previous studies that identified cellular interactors of EBOV VP24 and NP in HEK293T cells using a similar MS-based approach (Garcia-Dorival et al., 2016; Garcia-Dorival et al., 2014), we observed an overlap of nine and two interactions, respectively (Figure 1G). This includes the well-studied interaction between VP24 and members of the karyopherin alpha (KPNA) family of proteins (Reid et al., 2006; Reid et al., 2007; Xu et al., 2014). Since we did not collect the data from cells infected with EBOV, it is possible that functionally significant interactions that are mediated by infection and/or that require multiple viral proteins to manifest remain to be identified.
These interactions were overlaid with known human complexes as annotated by the CORUM database (Ruepp et al., 2010) to generate an EBOV protein-human protein interaction map (Figure 2). This network recapitulates several examples of known biology, such as the interaction between VP24 and KPNA as well as the connection between VP35 and dynein light chain, and reveals several novel connections between the EBOV and human cellular machinery (Figure 2). For example, VP35 co-purified with several proteins that make up TFIIIC, a transcription factor for RNA polymerase III (RNAPIII). This is not only consistent with the viral protein acting as a transcriptional co-factor for the EBOV polymerase, but suggests that VP35 may also manipulate RNAPIII-based transcription of tRNAs in a way that is beneficial for the virus. Interestingly, we uncovered a physical connection between VP35 and the RNA exosome, a critical regulator of RNA degradation (Figure 2). We recently found that the RNA exosome associates with the polymerase complex of influenza A virus (IAV) and is required for efficient IAV RNA synthesis (Rialdi et al., 2017). Additional interactions between VP24 and the NuRD chromatin remodeling complex, VP40 and the mitochondrial TIMM13/TIMM8A/TIMM8B complex, and VP30 and the mRNA polyadenylation machinery suggest other ways in which the virus may hijack cellular systems for its optimal replication (Figure 2), though further work is required to fully understand the functional consequences of these interactions.
FIGURE 2. An EBOV-human protein-protein interaction network.

194 high-confidence, EBOV-human protein-protein interactions are represented (blue lines) between 6 EBOV proteins and 169 human proteins. Each EBOV bait node is colored according to the genome schematic (upper left). Each human prey node is colored according to the cell line in which it was identified: blue indicates HEK293T cells, green indicates Huh7 cells, and blue-green bifurcation indicates the protein was identified as an interactor in both cell types. The shade of the prey node correlates with the MiST score of the interaction (scale at lower left). Grey lines correspond to 164 human-human protein-protein interactions curated in the publicly available CORUM database. Human protein-protein complexes that are represented by at least three nodes are labeled. See also Supplemental Table S1.
EBOV VP30 interacts with the Pro- and Arg/Ser- domain of RBBP6
Our analysis of EBOV-human PPIs revealed several novel interactions that had not been previously reported. Of these novel interactions, one between the EBOV protein VP30 and the human protein Retinoblastoma Binding Protein 6 (RBBP6) was notable in that it scored the highest among all VP30 interactions in both cell types (Supplemental Table S1 and Figure 2). EBOV VP30 is a zinc-binding, RNA-binding protein that acts as a regulator of viral RNA synthesis and interacts with L, VP35 and NP (Biedenkopf et al., 2013; Biedenkopf et al., 2016; John et al., 2007; Kirchdoerfer et al., 2016; Modrof et al., 2003; Xu et al., 2017). VP30 phosphorylation regulates the balance between viral transcription (mRNA synthesis) and genome RNA replication, with dephosphorylated VP30 favoring transcription (Biedenkopf et al., 2013; Modrof et al., 2002). Recruitment of protein phosphatase 1 or 2A by NP leads to the dephosphorylation of VP30 and subsequently promotes transcriptional activity; other host interactors relevant to VP30 function have not yet been identified (llinykh et al., 2014; Kruse et al., 2018; Modrof et al., 2002). RBBP6 is a large multidomain protein that interacts with a variety of host molecules including RNA, the retinoblastoma protein (pRb), p53, MDM2, Zinc finger and BTB domain-containing protein 38 (ZBTB38) as well as Y-box binding protein 1 (YB1) (Baltz et al., 2012; Chibi et al., 2008; Li et al., 2007; Miotto et al., 2014; Sakai et al., 1995; Simons et al., 1997). Furthermore, it has been identified as a component of polyadenylation machinery and modulates the expression of mRNAs with AU-rich 3’ UTRs (Di Giammartino et al., 2014). It also functions as ubiquitin E3 ligase and is implicated in number of biological processes including cell cycle progression, nucleic acid metabolism and embryonic development (Di Giammartino et al., 2014; Miotto et al., 2014; Scott et al., 2003).
To independently validate the interaction, we performed a co-immunoprecipitation (co-IP) experiment, purifying with anti-HA magnetic beads in the presence and absence of HA-tagged VP30. Endogenous RBBP6 co-precipitated only in the presence of VP30, confirming our AP-MS result (Figure 3A). Reciprocal co-IPs with flag-tagged RBBP6 and HA-tagged VP30, VP35 and NP further confirmed that RBBP6 and VP30 interact specifically (Supplemental Figure S1). To determine whether VP30 proteins from other filoviruses also interact with RBBP6, co-IPs were performed with HA-tagged RBBP6 and simultaneous co-expression of flag-tagged VP30 proteins from EBOV, RESTV, MARV and LLOV. In each case, VP30 co-precipitated specifically in the presence of HA-RBBP6, indicating that the interaction is conserved across the filovirus family (Figure 3B).
FIGURE 3. Interaction between EBOV VP30 and human RBBP6.

(A) Co-immunoprecipitation of HA-VP30 with endogenous RBBP6. HEK293T cells were transfected with HA-VP30 and immunoprecipitation (IP) was performed using anti-HA magnetic beads. Representative western blots of whole cell lysates (WCL) and eluates after IP are shown, β-tubulin was used as a loading control in WCLs. See also Supplemental Figure S1.
(B) Flag-VP30 from Zaire ebolavirus (EBOV), Reston virus (RESTV), Lloviu virus (LLOV) and Marburg virus (MARV) co-immunoprecipitate with HA-RBBP6.
(C) A schematic representation of domain organization of RBBP6 isoform 1 and 3 (top). RBBP6 functional domains consists of domain with no name (DWNN), zinc knuckle, ring finger domain, proline and arginine-serine rich domains followed by retinoblastoma (Rb) and p53 binding domains. Bottom panel depicts co-immunoprecipitation of flag-tagged VP30 with transiently expressed HA-RBBP6 isoform 1 or 3. HEK293T cells were transfected with HA-RBBP6 alone or in combination with flag-VP30, as indicated followed by IP with anti-HA.
(D) Schematic drawing of RBBP6 truncation mutants used in domain mapping studies (top). Anti-HA IP was performed after co-expression of HA-tagged full-length RBBP6 or different truncations in combination with empty vector or flag-VP30.
(E) Immunoprecipitation with anti-HA in cell lysates expressing HA-RBBP6 and flag-tagged RNA binding mutants of VP30. 3RA: R26A/R28A/R40A.
RBBP6 has 4 known isoforms, the best studied of which are isoforms 1 and 3 (Gerhard et al., 2004). Isoform 1 is the longest version of the protein with several domains including the DWNN, Zinc, Ring, Pro-Ser, Rb binding and p53 binding domains and a molecular weight of approximately 200 kiloDaltons (kDa). Isoform 3, on the other hand, consists of only the amino-terminus of the protein and includes the DWNN domain with a molecular weight of approximately 20 kDa (Figure 3C). Co-IP experiments with HA-tagged isoform 1 or isoform 3 RBBP6 and flag-tagged VP30 demonstrated specific interaction with only isoform 1 (Figure 3C). These data are consistent with both our endogenous co-IPs, which pull down a specific RBBP6 band near 200kDa (Figure 3A) and our mass spectrometry data that detect peptides specific to isoform 1 (data not shown).
To further map the region of RBBP6 required for interaction with VP30, RBBP6 was divided into individual HA-tagged domains (Figure 3D). Each domain was then precipitated with anti-HA in the presence and absence of flag-VP30 and subjected to immunoblot. Only the Pro- and Arg/Ser- domain between residues 351-900 interacted with VP30 with an efficiency nearing that of full-length RBBP6 (Figure 3D). An apparent weak interaction was also detected between VP30 and RBBP6 residues 1401-1792, a region that includes the p53 binding domain (Figure 3D).
Finally, as both VP30 and RBBP6 interact with RNA (Baltz et al., 2012; Biedenkopf et al., 2016; John et al., 2007), we wanted to address the possible contribution of RNA to the interaction. The RNA binding region of VP30 has been previously mapped and so we cloned a series of previously described mutants that have weak or no RNA binding affinity including: R26A, R28A, R40A, R26A/R28A/R40A, and C72S (Biedenkopf et al., 2016). In co-IP experiments, each of these mutant VP30 proteins retained RBBP6 binding activity comparable to that seen with wild-type VP30, suggesting that RNA binding is not required for the interaction (Figure 3E).
An X-ray Crystal Structure Demonstrates that RBBP6 Targets the NP Interaction Motif on VP30
To determine whether the VP30-RBBP6 interaction is direct and to further map the VP30-binding site on RBBP6, a series of truncation mutants covering the C-terminal region of VP30 and the Pro- and RS-rich region of RBBP6 were expressed as maltose binding protein (MBP) fusion proteins, purified, and tested for interaction using an in vitro pull-down assay (Supplemental Figure S2A and B). These studies indicated that the C-terminal domain of VP30 (referred to below as VP30CTD) interact with the RBBP6 Pro-rich domain. We narrowed down the binding interaction to a peptide corresponding to RBBP6 residues 549-573 (549-SLPATPVFVPVPPPPLYPPPPHTLP-573) (Figure 4A). We further characterized this interaction by isothermal titration calorimetry (ITC) with the RBBP6 peptide serving as the injectant into a sample cell containing VP30CTD (Figure 4B), which yielded a KD = 0.75 ± 0.095 μM with a 1:1 stoichiometry. To define the precise molecular basis for this interaction, VP30CTD was crystallized with RBBP6 peptide and the structure was solved (PDB 6E5X) by molecular replacement to 1.5 Å resolution using our previous structure of VP30CTD bound to an NP peptide as the search model (PDB 5VAP). Strikingly, we find that the RBBP6 peptide binds to the same cleft on VP30 that interacts with NP (Figure 4C, Supplemental Figure S2C and Supplemental Table S2) (Kirchdoerfer et al., 2016; Xu et al., 2017). Comparison of the two crystal structures reveal that similar residues in the VP30CTD interact with NP- and RBBP6-derived peptides (Figure 4D). Furthermore, we defined a common binding motif between NP and RBBP6 proteins: PPxPxY (Figure 4D). Indeed, mutation of the PPxPxY motif (559-VPPPPLYP-566 to 559-DDPGALDA-566) in full-length RBBP6 resulted in a loss of interaction with VP30 as assessed by co-IP (Supplemental Figure S2D).
FIGURE 4. An X-ray crystal structure reveals that RBBP6 and NP bind the CTD of VP30 at the same interface.

(A) Summary of in vitro pull-down based binding results for RBBP6 truncated constructs to VP3089-288. +, binding; −, no binding. See also Supplemental Figure S2A-B.
(B) Representative ITC raw data and corresponding binding isotherm for VP30130-272 binding to RBBP6549.571. KD = 0.75 ± 0.095 μM. Reported measurements are the average of at least two independent experiments.
(C) Comparison between the X-ray crystal structures of VP30CTD/RBBP6 peptide complex (PDB: 6E5X, top) and VP30CTD/NP peptide complex (PDB: 5VAP, bottom). VP30CTD is shown in surface representation (teal), while RBBP6 (green) and NP (red) peptides are shown in stick representation. See also Supplemental Figure S2C and Supplemental Table S2.
(D) Overview of interacting residues at the interface between VP30 and peptides derived from RBBP6 and NP. See also Supplemental Figure S2D.
(E) Co-immunoprecipitation of HA-RBBP6 with flag-tagged VP30 mutants.
(F) Anti-flag immunoprecipitation of RBBP6 with VP30 in the presence of wtNP or NP mutants unable to interact with VP30. IP: immunoprecipitation; IB: immunoblot; WCL: whole-cell lysate.
Prior studies identified point mutations in the NP binding cleft of VP30 that either do or do not disrupt the VP30 interaction (Kirchdoerfer et al., 2016; Xu et al., 2017). When several of these mutations were tested for their impact on the VP30-RBBP6 interaction by co-IP, there was a near perfect concordance between RBBP6 binding and previously reported NP binding (Figure 4E). Specifically, E197A, and combinations of mutations including E197A, abrogate binding to both RBBP6 and NP. Similarly, W230A, alone or in combination with Q229A, impaired or eliminated binding to both RBBP6 and NP. Conversely, individual D202A or Q229A mutations did not impact either the RBBP6 or NP interaction (Figure 4E).
Given the common binding site and the potential of the RBBP6 peptide to mimic the viral NP interaction with VP30, we hypothesized that NP and RBBP6 could compete for binding to VP30. To test this hypothesis, we performed co-IPs between flag-RBBP6 and VP30 in the presence or absence of either wild type NP or NP mutants previously demonstrated to lose binding to VP30 (610-612AAA and 603-606AAGG) (Xu et al., 2017). Increasing amounts of wild type NP but neither mutant resulted in disruption of the RBBP6-VP30 interaction (Figure 4F). These results are consistent with our structural and mutagenesis data demonstrating that NP and RBBP6 share a common binding site on VP30 and suggest that the two may compete for VP30 binding in cellulo.
The 549-571 Amino Acid Region of RBBP6 is Sufficient to Interact with VP30 and Modulate Viral RNA Synthesis
The in vitro binding, X-ray crystallography, and mutagenesis data identified a 23 amino acid peptide containing a PPxPxY motif that was necessary for the binding of RBBP6 to VP30. To test whether or not that peptide was sufficient for binding to VP30, we fused RBBP6 amino acids 549-571 (RBBP6 peptide) to flag-tagged GFP. Anti-flag pull downs were performed in the presence of HA-tagged VP30 and flag-tagged RBBP6, GFP, or GFP fused to RBBP6 peptide. While GFP alone did not precipitate VP30, addition of RBBP6 peptide was sufficient to confer binding to VP30 (Figure 5A). Furthermore, GFP-RBBP6 peptide retained or lost binding to the same VP30 mutants as did full-length RBBP6 (Figure 4E and Figure 5B). This interaction could be disrupted by co-expression of NP, similar to what was observed with full-length RBBP6 (Figure 4F and Figure 5C). Finally, we performed competition fluorescence polarization (FP) assays to determine whether RBBP6 can disrupt the interaction between VP30 and NP (Figure 5D). RBBP6 peptide displaced FITC-NP peptide from the FITC-NP peptide-VP30CTD complex at concentrations lower than that of unlabeled NP peptide alone The dissociation constants, KD, for eNP and RBBP6 peptides are 89.23 ± 2.26 and 18.11 ±0.41 μM, respectively, indicating that RBBP6 has approximately 5-fold higher binding affinity to VP30CTD in comparison to NP (Figure 4B) (Xu et al., 2017). This suggests that RBBP6 peptide can out compete NP peptide for binding to VP30CTD. Collectively, these results demonstrate that the RBBP6 peptide is sufficient to bind VP30 and that this interaction occurs at the same interface as the VP30-NP interaction.
FIGURE 5. VP30 interacts with 549-571aa region of RBBP6.

(A) Representative immunoblots after Co-IP between HA-VP30 and RBB6P peptide fused to GFP-flag. GFP-flag was used as a control.
(B) Interaction between RBBP6 peptide and NP binding mutants of VP30.
(C) Co-IP experiment demonstrating that NP interferes with VP30-RBBP6 peptide interaction. IP was performed with anti-flag beads after co-expression of VP30, RBBP6 peptide fused to GFP-flag and NP. IP: immunoprecipitation; IB: immunoblot; WCL: whole-cell lysate.
(D) Fluorescence polarization assay showing RBBP6 peptide (green) displaces FITC-NP peptide (red) from the eVP30CTD-FITC-NP peptide complex. Error bars represent standard deviation of three independent experiments.
Because RBBP6 targets the NP binding interface on VP30 and the interaction between VP30 and NP modulates EBOV RNA synthesis (Kirchdoerfer et al., 2016; Xu et al., 2017), we next assessed how the RBBP6 interaction with VP30 affects EBOV RNA synthesis using an EBOV minigenome (MG) assay (Figure 6A). In this assay, the necessary components of EBOV RNA synthesis (NP, VP30, VP35, and L, referred to below as the viral polymerase complex) are provided in trans with a Renilla luciferase reporter gene flanked by the necessary EBOV genomic sequences for viral polymerase complex recruitment. These components are co-transfected with a firefly luciferase control into HEK293T cells and viral RNA synthesis monitored by Renilla luciferase activity. In the absence of VP30, only low activity was detected (Figure 6B), but activity increased over 50-fold upon the addition of VP30. However, when RBBP6 was knocked down with siRNA, activity increased even more, an additional 4-5 fold (Figure 6B and Supplemental Figure S3A). This held true regardless of how much VP30 was used in the assay. Conversely, over-expression of RBBP6 in the presence of different amounts of VP30 reproducibly inhibited activity in a dose dependent manner (Figure 6C and Supplemental Figure S3B). These data suggest that RBBP6 acts as a negative regulator of EBOV viral RNA synthesis.
FIGURE 6. RBBP6 suppresses EBOV RNA synthesis.

(A) Schematic diagram of the EBOV minigenome assay. Luc: Renilla luciferase
(B) Minigenome activity upon knockdown of RBBP6. HEK293T cells were transfected with 25nM scrambled siRNA or siRNA targeting RBBP6. 24 h post-transfection minigenome assay was performed using different concentrations of VP30. Data represent mean± S.D. from one representative experiment (n=3) of at least three independent experiments. See also Supplemental Figure S3A.
(C) Minigenome activity in RBBP6 overexpressing cells. RBBP6 was transiently expressed along with plasmids for minigenome assay at two different doses (50 and 500ng) in HEK293T cells. Reporter activity was read 48 h post-transfection. Data represent mean± S.D. from one representative experiment (n=4) of at least three independent experiments. Statistical significance was calculated using Student’s t-test. See also Supplemental Figure S3B.
(D) Minigenome assay was performed upon over-expression of peptides derived from RBBP6 and NP using VP30-wt and E197A mutant. Graph represents percent activity values and set relative to GFP expressing cells for each dose. Representative immunoblots are shown detecting protein levels of RBBP6/peptide and VP30. β-tubulin was used as a loading control. Data represent mean ± S.D. from one representative experiment (n=3) of at least three independent experiments. Statistical significance was calculated using ANOVA with Tukey’s multiple comparisons test. See also Supplemental Figure S3C-F and Supplemental Figure S4A-E.
As RBBP6 is a multi-domain, multifunctional protein, it could act in a number of ways to inhibit EBOV RNA synthesis beyond its interaction with VP30. To determine if binding of RBBP6 to VP30 was sufficient to inhibit activity, we tested the impact of expressing GFP fused to RBBP6 peptide in the MG assay. GFP and GFP fused to an NP-derived VP30 binding peptide previously demonstrated to inhibit MG activity were used as controls (Xu et al., 2017). This was done in the presence of either wild type VP30 or the VP30 E197A mutant, which is impaired for binding to either RBBP6 or NP (Figure 4E), but does retain activity in the MG assay (Xu et al., 2017). Compared to overexpression of GFP alone, both RBBP6 peptide and the NP-derived peptide fusions inhibited MG activity in the presence of wild type VP30 (Figure 6D and Supplemental Figure S3C). In the presence of VP30 E197A, reporter activity remains unaffected by expression of any of the proteins (Figure 6D). These results suggest that the negative regulation of EBOV RNA synthesis by RBBP6 is a direct consequence of its interaction with VP30.
To further address whether the effect of RBBP6 on viral RNA synthesis is related to its interaction with VP30, we compared the effects of overexpressing either RBBP6 isoform 1, which binds to VP30, or RBBP6 isoform 3, which does not bind to VP30. In the MG assay, we found that isoform 1, but not isoform 3, exhibited an inhibitory effect (Supplemental Figure S3D). Additionally, we tested the effects of RBBP6 expression in an alternate MG model wherein disruption of a predicted stem-loop near the NP transcriptional start site renders the MG less dependent on VP30 (Weik et al., 2002). As expected, this mutant MG was less sensitive to VP30 activity and not detectably affected by expression of RBBP6 (Supplemental Figure S3E) or GFP fused to RBBP6 peptide (Supplemental Figure S3F).
In some instances, higher levels of RBBP6 expression correlate with decreased steady-state levels of VP30 (i.e. Figure 6C and Supplemental Figure S3B). As RBBP6 is an E3 ligase, we hypothesized that the RBBP6-VP30 interaction may lead to the degradation of VP30 and that this degradation may also partially explain the observed decrease in viral RNA synthesis. To test the impact of RBBP6 on VP30 steady-state levels, VP30 was co-expressed with RBBP6 in the presence or absence of increasing amounts of VP35 or NP. As expected, RBBP6 decreased VP30 levels in a dose-dependent manner. While VP35 did not modulate the effect of RBBP6 on VP30 levels, NP expression restored VP30 levels, consistent with the RBBP6-VP30 interaction mediating VP30 expression levels (Supplemental Figure S4A). Steady-state levels of the VP30 E197A mutant, which does not bind RBBP6, are much less impacted by co-expression of RBBP6 (Supplemental Figure S4B). Similarly, viral RNA synthesis driven by VP30 E197A is less impacted by RBBP6 overexpression in the MG assay (Supplemental Figure S4C), though a partial decrease was observed. This is in contrast to GFP-RBBP6 peptide, which had no impact on VP30 E197A steady-state levels or viral RNA synthesis (Figure 6D, Supplemental Figure S3C). This suggests additional mechanisms of inhibition by full-length RBBP6 that are not possessed by the RBBP6 peptide alone. In support of this, overexpression of RBBP6 was found to modestly decrease the steady-state mRNA levels of both wild type and E197A mutant VP30 (Supplemental Figure S4D), though it had no impact on the levels of NP mRNA (Supplemental Figure S4E). The impact of RBBP6 expression on VP30 mRNA levels may explain the decrease in VP30 E197A expression, but alone this is insufficient to explain the differential impact on wild type VP30 steady-state levels and activity. Taken together, these results suggest that RBBP6 overexpression may inhibit MG activity in three independent ways: 1) through disruption of the VP30-NP interaction 2); through downregulation at the protein level as mediated by direct protein-protein interaction; and 3) through downregulation at the level of mRNA transcripts.
RBBP6 Suppresses Ebola Virus Replication
Given the impact of RBBP6 knockdown on EBOV RNA synthesis in the MG assay, we hypothesized that RBBP6 knock-down may increase EBOV infection. To test this hypothesis, HeLa cells were transfected with siRNAs targeting RBBP6, alongside a scrambled siRNA and an siRNA targeting NPC1, a host factor essential for EBOV entry (Miller et al., 2012). These cells were challenged with EBOV containing an EGFP reporter, and infected cells were quantified by microscopy 24 hours later. As expected, NPC1 knock-down inhibited infection relative to the mock transfected and scrambled siRNA treated controls (Figure 7A, Figure 7B, and Supplemental Figure S5A). RBBP6 knockdown, however, strongly enhanced EBOV infection (Figure 7A, Figure 7B, and Supplemental Figure S5A), consistent with an increase in VP30 and NP protein levels (Figure 7C).
FIGURE 7. RBBP6 restricts Ebola virus replication.

(A) HeLa cells were mock-transfected or transfected with a scrambled siRNA (SCR si) or siRNAs targeting either NPC1 (NPC1 si) or RBBP6 (RBBP6 si_1, RBBP6 si_2). After 48 h, cells were infected with EBOV-EGFP at an MOI of 0.1. Twenty-four hours later, samples were fixed, incubated with Hoechst dye to stain nuclei, and imaged.
(B) The numbers of nuclei and EGFP-positive (infected) HeLa cells were counted using CellProfiler software, and infection efficiencies were determined as the ratio of infected cells to nuclei and shown relative to the infection level seen for the mock control. Mean relative infection efficiencies from three replicates ± SD are shown. Statistical significance was calculated relative to SCR siRNA treated cells using ANOVA with Tukey’s multiple comparisons test. See also Supplemental Figure S5A.
(C) Expression levels of VP30 and NP in EBOV infected HeLa cell lysates upon knockdown of RBBP6 and NPC1. Percent protein levels were calculated relative to mock treated cells from two replicates. Statistical significance was calculated relative to SCR siRNA treated cells using ANOVA with Tukey’s multiple comparisons test.
(D) HeLa cells were transfected with plasmids encoding (i) GFP-flag (ii) GFP-RBBP6 peptide (iii) GFP-RBBP6 peptide-flag (iv) GFP-linker-RBBP6 peptide. Transfected cells were distributed in 7 wells of a 96 well plate. Each well was challenged with EBOV for 24 h followed by Hoechst staining to identify nuclei and staining for viral glycoprotein (GP) to identify infected cells. Images were analyzed by CellProfiler software to quantify the intensity of GP signal. The impact of peptide expression on infection efficiency was measured as the relative infection efficiency seen in cells expressing GFP-flag compared to cells expressing GFP with the indicated RBBP6 peptide constructs. Statistical significance was calculated relative to GFP-flag expressing cells using ANOVA with Tukey’s multiple comparisons test.
(E) Primary cells (MDM and HUVEC) were mock transfected or transfected with scrambled siRNA or siRNA targeting RBBP6, followed by infection with EBOV-EGFP at an MOI=0.04. Twenty-four hours post-infection, cells were fixed, stained and imaged.
(F) The number of infected cells was calculated in MDM and HUVEC siRNA-treated cells and mean infection efficiencies relative to mock treatment from three replicates ± SD are shown. Statistical significance for RBBP6 siRNA treatment was calculated relative to SCR siRNA treated cells using ANOVA with Tukey’s multiple comparisons test. See also Supplemental Figure S5B and C.
(G) MDM from two different donors and HUVEC cells were transfected with plasmids expressing GFP-flag or GFP-RBBP6 peptide-flag, followed by infection with EBOV (MOI=1). Twenty-four hours post-infection, cells were fixed and stained for GP and nuclei (Hoechst dye). The impact of peptide expression on infection efficiency was measured as for (D) and percent infection ± SD values were plotted. Statistical significance was calculated using unpaired Student’s t-test. See also Supplemental Figure S5D.
(H) Model for the inhibition of EBOV replication by RBBP6.
To test if the RBBP6-VP30 interaction could similarly be leveraged to inhibit EBOV infection, HeLa cells were transfected with GFP or GFP fused to the RBBP6 peptide. These cells were infected with wild type EBOV and stained for GP expression after 24 hours. As predicted, expression of GFP fused to the RBBP6 peptide was sufficient to strongly inhibit EBOV replication (Figure 7D).
To determine whether similar effects would be observed in primary cells, we carried out experiments in human monocyte-derived macrophages (MDM) and human umbilical vein endothelial cells (HUVEC). Consistent with the HeLa cell data, knockdown of RBBP6 in each primary cell type resulted in a significant increase of EBOV infection (Figure 7E, Figure 7F and Supplemental Figure S5B and C). Furthermore, overexpression of the RBBP6 peptide strongly inhibited EBOV infection in both MDM and HUVEC (Figure 7G and Supplemental Figure S5D).
Cumulatively, these data suggest that RBBP6 inhibits EBOV infection through a combination of impairing the VP30-NP interaction and decreasing VP30 levels (Figure 7H). Upon interaction with VP30, NP recruits the host PP2A-B56 protein phosphatase to dephosphorylate VP30 and thereby promote viral transcription (Kruse et al., 2018). Disruption of the VP30-NP interaction through competitive binding to the same PPxPxY motif presumably prevents VP30 dephosphorylation and so impairs viral transcription. Interestingly, this PPxPxY motif is conserved among the NP proteins of all filoviruses (Kirchdoerfer et al., 2016; Xu et al., 2017), suggesting that RBBP6 may similarly inhibit the infection of other filovirus family members. Of note, our VP30 interactome includes three additional interacting proteins, hnRNPL, hnRNPUL1 and PEG10, with proline-rich stretches that include a PPxPxY motif (data not shown). It will be of interest to determine if these factors can also serve as inhibitors of EBOV RNA synthesis. If so, it will be important to assess the combined impact of these motifs on viral replication rates and whether loss of this inhibition enhances production of new virus progeny or if it is deleterious, for example, by skewing the balance of viral RNA production versus suppression of innate immunity.
VP30 has previously been explored as a potential therapeutic target. As VP30 is regulated by PP2A-B56, phosphatase inhibitors and other small molecules that promote VP30 phosphorylation inhibit EBOV replication (Ilinykh et al., 2014; Modrof et al., 2002). A peptide that targets VP30 oligomerization, which is also required for its transcription activation function, has also been shown to inhibit EBOV growth (Hartlieb et al., 2003). Our data with RBBP6 suggest a unique approach where a peptide or peptidomimetic may synergize with host factors such as RBBP6 to disrupt the VP30-NP interaction to impair virus replication. Additional detailed characterization of this and the other PPIs revealed by this study is expected to reveal even more insights into filovirus biology and to identify more potential targets for drug development.
STAR METHODS
CONTACT FOR REAGENT AND RESOURCE SHARING
Further information and requests for resources and reagents should be directed to and will be fulfilled by the Lead Contact, Dr. Nevan Krogan at nevan.krogan@ucsf.edu, and/or the co-corresponding author, Dr. Christopher Basler at cbasler@gsu.edu.
EXPERIMENTAL MODEL AND SUBJECT DETAILS
Primary cells and Cell Lines
HEK293T (human embryonic kidney SV40 Tag transformed; ATCC, CRL-3216), Huh7 (generous gift from the Frydman lab at Stanford University), Vero (ATCC, CCL-81), and HeLa cells (ATCC, CCL-2) were maintained in Dulbecco’s modified Eagle’s medium (Corning Cellgro or ThermoFisher scientific) with 10% fetal calf serum (Gibco or Gemini Bio-Products) at 37°C in a humidified atmosphere with 5% CO2. HEK293T and Huh7 cells for affinity purification were additionally cultured in the presence of 4.5g/L glucose, 0.584g/L L-glutamine, 3.7g/L NaHCO3, 1% Penicillin/Streptomycin (Corning), 1% Sodium Pyruvate, and 1% Non-Essential Amino Acids (UCSF Cell Culture Facility). MDMs were isolated as described elsewhere (Schlesinger, 1993; Schlesinger and Horwitz, 1990). Briefly, human peripheral blood was collected from healthy donors, following UTHealth approved IRB protocols. All donor samples were provided anonymously without identifiers such as that the research performed here was not considered Human Subjects Research. Heparinized blood was layered on a Ficoll-Paque cushion (GE Healthcare, Uppsala, Sweden) to allow for collection of peripheral blood mononuclear cells (PBMCs). PBMCs were cultured in RPMI (Life Technologies, Carlsbad, CA) with 20% autologous serum in Teflon wells (Savillex, Eden Prairie, MN) for 5 days at 37°C/5% CO2. MDMs were harvested and adhered to tissue culture dishes for 2-3 h in RPMI with 10% autologous serum, lymphocytes washed away, and remaining MDMs were incubated overnight in RPMI with 10% autologous serum. Such MDM monolayers are 99% pure and viable. Primary HUVEC (ATCC, PCS-100-013) cells were maintained in Vascular Cell Basal Medium supplemented with Endothelial Cell Growth Kit-BBE (ATCC) at 37°C in a humidified atmosphere with 5% CO2.
METHOD DETAILS
Antibodies
The antibodies used in the study include: polyclonal rabbit anti-RBBP6 antibody (Origene Technologies, TA309830), monoclonal mouse anti-FLAG M2 antibody (Sigma Aldrich, F1804), polyclonal rabbit anti-flag antibody (Sigma Aldrich, F7425), monoclonal mouse anti-HA antibody (Sigma Aldrich, H3663), polyclonal rabbit anti-HA antibody (Sigma Aldrich, H6908), monoclonal mouse anti-β-tubulin antibody (Sigma Aldrich, T8328), monoclonal mouse anti-myosin Va antibody (sc-365986), monoclonal mouse anti-ANP32A antibody (sc-100767), Anti-KPNA5 antibody (sc-517105), Anti-Ebola GP antibody clone 4F3 (IBT Bioservices, 0201-020), Goat IgG (H+L) anti-mouse Alexa Flour 546 conjugate (ThermoFisher scientific, A11030), rabbit antipeptide serum raised against EBOV VP30 (2-25aa) and NP (97-119aa) (Pacific Immunology Corp.).
Plasmid Constructs
For affinity purification, the coding sequences of each individual EBOV protein (NP, VP35, VP40, GP, VP30, VP35, and L) from Zaire ebolavirus (NC_002549.1) were cloned into pLVX-TetOne-Puro (Clontech) with either N-terminal or C-terminal 2XStrep tags using Gibson assembly. The coding sequences of EBOV, MARV, RESTV, and LLOV VP30 were synthesized in vitro (GenScript) and cloned into the pCAGGS vector (Addgene) by restriction digest for mammalian expression. The coding sequence of EBOV VP30 was additionally cloned with a modified maltose binding protein (MBP) fusion tag into the pET15b vector (Novagen) for bacterial expression and in vitro purification. RNA binding mutants of VP30 (R26A, R28A, R40A, 3RA, C72S) were generated by QuikChange site-directed mutagenesis (Agilent).
The coding sequence of human RBBP6 isoform 1 (NM_006910) was amplified from the RNA of HEK293T cells by reverse transcription (RT)-PCR using primers 5’-CAT ACG GCG GCC GCT TCC TGT GTG CAT TAT AAA TTT-3’ and 5’-AGA TCC CTC GAG TTA CAC AGT GAC AGA TTT CAC-3’. This insert was cloned into the NotI/XhoI sites of the pCAGGS plasmid (Addgene) by restriction digest for mammalian expression. Different domains of RBBP6, isoform 3 (NM_032626), and the multi-residue mutant of RBBP6 in the region 559-666aa (DDPGALDA) were all cloned using isoform 1 as a template. The coding sequence of human RBBP6 isoform 1 was subcloned with a modified maltose binding protein (MBP) fusion tag into the pET15b vector (Novagen) for bacterial expression and in vitro purification. The VP30 interacting region of RBBP6 from amino acids 549-571 was cloned into pCAGGS with an N-terminal GFP-tag, with or without an SGGSGGSG linker between GFP and the peptide, and with or without a C-terminal flag tag.
All expression plasmids for the EBOV minigenome assay, all VP30 mutant constructs (E197A, D202A, E197A/D202A/Q203A, Q229A, W230A, Q229A/W230A), and all NP mutant constructs (610-612AAA, 603-606AAGG) have been previously described (Edwards et al., 2015; Hoenen et al., 2010; Xu et al., 2017). All the above constructs were validated by Sanger DNA sequencing prior to use.
Preparation of EBOV Stocks
All experiments with EBOV were performed in the biosafety level 4 (BSL-4) laboratory at the Texas Biomedical Research Institute (San Antonio, TX). EBOV (Zaire ebolavirus, Mayinga variant) and recombinant EBOV expressing enhanced GFP (EBOV-EGFP) were grown and concentrated as described previously (Anantpadma et al., 2016). Briefly, virus was amplified in Vero cells in DMEM containing 2% FBS for 7 days. Culture supernatants from infected Vero cells were centrifuged at 1800 ×g for 15 minutes to pellet any cell debris. The virus was then pelleted by overlaying the clarified culture supernatant over a 20% sucrose cushion in PBS and then centrifugation at 141,118 ×g for 2 h at 4°C. The pelleted virus was resuspended in PBS and stored at −80°C until used. To determine the ti ter of the stock, HeLa, MDM, or HUVEC cells were incubated with 10-fold serial dilutions of the stock for 24 h. The samples were subsequently fixed in 10% buffered formalin (VWR), incubated with Hoechst dye (ThermoFisher) to stain nuclei, and photographed using Nikon Ti-Eclipse microscope running high content analysis software (Nikon). The numbers of cell nuclei and EGFP-expressing cells were counted using CellProfiler software (Broad Institute).
Strep-tag Affinity Purification for Mass Spectrometry
1 × 10⁷ HEK293T cells or 2-6 × 10⁶ Huh7 cells were plated in 15-cm dishes and allowed to adhere overnight prior to transfection with each of the pLVX-TetOne-puro EBOV expression constructs using PolyJet transfection reagent at a 3:1 or 6:1 μL PolyJet:μg plasmid ratio respectively (SignaGen Laboratories). Depending on the expression level of the EBOV bait protein, up to four 15-cm dishes were transfected per bait in biological triplicate and induced with doxycyline (1μg/mL; Clontech). 40-60 hours post-transfection, the cells were dissociated from the plate surface with 1x Phosphate Buffered Saline (PBS) containing 10mM EDTA. After dissociation, all steps proceeded at 4°C or on ice. Cells were pelleted by centrifugation in a spinning bucket rotor at 200 × g for 5 minutes, washed once in cold PBS, and suspended in 1 mL cold immunoprecipitation (IP) buffer (50mM Tris-HCl, pH 7.4, 150mM NaCl, 1mM EDTA) supplemented with 0.5% Nonidet P 40 Substitute (NP-40, Fluka Analytical), complete mini EDTA-free protease inhibitor tablets (Roche), and PhosSTOP phosphatase inhibitor tablets (Roche). Cells were lysed for 30 minutes at 4°C with constant rotation, and the lysates were cleared by centrifugation at 3,500 × g and 4°C for 20 minutes. 50μL of each lysate was removed for western blot analysis (whole cell lysate fraction). The remaining lysate was incubated with 30μL of Strep-Tactin Sepharose beads (IBA Lifesciences) that had been washed in IP buffer and suspended in 0.6 ml IP Buffer. Bead incubation proceeded for 2 h with constant rotation at 4°C. The beads were washed three times with 1mL of IP buffer containing 0.05% NP-40 followed by one final wash in detergent-free IP Buffer in a fresh detergent-free tube. Proteins were eluted by agitating beads in 40μL IP buffer supplemented with 2.5 mM D-Desthiobiotin (IBA Lifesciences) on a vortex mixer at room temperature for 30 minutes. 5 μL eluate was removed for silver staining and 5 μL was removed for immunoblotting (IP fraction). Whole cell lysates and eluates were resolved on 4-20% Tris-HCl Criterion SDS-PAGE gels (Bio-Rad Laboratories) to assess Strep-tagged protein expression and affinity purification by immunoblotting and silver stain (ThermoFisher Scientific), respectively. After verifying protein expression and purification, 10μL eluate was removed for mass spectrometry. At least three independent biological replicates were performed for each Strep-tagged protein in each cell line. The L protein was never found to express to suitable levels for AP-MS and so these samples were not prepared for MS analysis.
Preparation of Peptides for Mass Spectrometry
Eluates (10μL) were incubated with 20μL reduction-alkylation buffer [50mM Tris-HCl, pH8.0, 2M Urea, 1mM Dithiothreitol (DTT), 3mM iodoacetamide (IAA)] in the dark at room temperature for 45 minutes. After quenching IAA with 3mM DTT, trypsin (Promega) was added to samples at a 1:100 enzyme:substrate ratio and incubated overnight at 37°C. Peptides were acidified with formic acid (1% final concentration) and desalted using OMIX C18 10μL tips (Agilent) following the manufacturer’s protocol. Briefly, tips were conditioned with 50% acetonitrile, 0.1% formic acid and sequentially equilibrated in two volumes of 0.1% formic acid before binding peptides. Bound peptides were sequentially rinsed in two volumes of 0.1% formic acid and eluted twice, first in 50% acetonitrile, 0.1% formic acid, and then in 90% acetonitrile, 0.1% formic acid. Elutions were combined, dried under vacuum centrifugation, and suspended in 12μL of 3.0% acetonitrile, 0.1% formic acid prior to mass spectrometry.
Protein Identification by Liquid Chromatography Tandem Mass Spectrometry (LC MS/MS)
Digested peptide mixtures were analyzed by LC-MS/MS on a Thermo Scientific Velos Pro dual linear ion trap mass spectrometer equipped with a Proxeon Easy-nLC HPLC, pre-column (2cm × 100μm I.D. packed with ReproSil Pur C18 AQ 5μm particles; Thermo Scientific), and analytical column (10cm × 75μm I.D. packed with ReproSil Pur C18 AQ 3μm particles; Thermo Scientific). The system delivered a gradient from 5% to 30% ACN in 0.1% formic acid over one hour, and collected data in a data-dependent fashion. The Velos Pro collected one full scan followed by 20 collision-induced dissociation MS/MS scans of the 20 most intense peaks from the full scan. Dynamic exclusion was enabled on both systems for 30 seconds with a repeat count of 1.
Raw MS files were analyzed by Protein Prospector (http://prospector.ucsf.edu/), version 5.10.1 against a database containing reviewed SwissProt human and EBOV protein sequences. The searched data was then scored for protein-protein interactions (PPIs) using the MiST algorithm (PMID: 25754993), with spectral counts as the quantifying feature of the data. High-confidence PPIs was required a MiST score greater than or equal to 0.75 (Jager et al., 2011a).
Complex Enrichment Scoring
Annotation enrichment analysis was calculated to determine whether specific complexes, domain types, or pathways were enriched among prey of a given bait. To assess whether the enrichment was statistically significant, adjusted p-values were computed using a hypergeometric test (Falcon and Gentleman, 2007) and g:ProfileR (https://biit.cs.ut.ee/gprofiler/).
Co-immunoprecipitation Assays
HEK293T cells were transfected with the mammalian expression constructs as indicated using lipofectamine 2000 (Invitrogen) according to the manufacturer's instructions. Cells were harvested in NP-40 lysis buffer (50mM Tris-Cl pH 7.5, 280 mM NaCl, 0.5% NP-40, 2mM EDTA, 10% glycerol) supplemented with complete mini protease inhibitor tablets (Roche). Clarified cell lysates were incubated with anti-HA or flag-magnetic beads (Sigma-Aldrich) for 1-2 h at 4°C, followed by 5 washes with NP-40 lysis buffer. Protein complexes were eluted from the beads by direct incubation in 1X SDS loading buffer. Eluates and whole-cell lysates were analyzed by immunoblotting with the antibodies as indicated.
Protein Expression and in vitro Purification
VP30 and RBBP6 were expressed as MBP fusion proteins in BL21(DE3) E. coli cells (Novagen) in Luria Broth media. Protein expression was induced at an OD600 (optical density at 600 nm) of 0.6 with 0.5 mM isopropylthiogalactoside and continued for 15 h at 18°C. Cells were then harvested and suspended in lysis buffer containing 25 mM sodium phosphate pH 7.5, 250 mM NaCl, and 5 mM 2-mercaptoethanol (β-ME). Suspended cells were further lysed using an EmulsiFlex-C5 homogenizer (Avestin) and clarified by centrifugation at 24,000 × g at 4°C for 40 minutes. MBP-VP30 protein was purified using a series of affinity and ion exchange chromatographic columns. The MBP tag was subsequently removed by digestion with Tobacco Etch Virus protease. The resulting sample was further purified using a size-exclusion column. The purity of the samples was determined by SDS-PAGE.
In vitro Pull-down Assays
Amylose resin (NEB) was equilibrated with buffer containing 20 mM Tris pH 7.5, 150 mM NaCl, and 5 mM β-ME. Equilibrated resin was incubated with cell lysate for 15 min at 4°C, washed, and resuspended in buffer. Purified MBP-VP30s were then applied to the resin and allowed to incubate for 20 min. The resin was repeatedly washed. Gel samples were taken at each step and visualized on SDS-PAGE by Coomassie blue staining.
Isothermal Titration Calorimetry
VP30/RBBP6 binding assay was performed on a VP-isothermal titration calorimeter (VP-ITC) (MicroCal). Protein samples were dialyzed against buffer containing 20 mM Tris pH 7.5, 150 mM NaCl, and 2 mM Tris (2-carboxyethyl) phosphine for 12 h at 4°C. Titrations were set up with 150 μM VP30CTD protein in the syringe and 10 μM RBBP6 peptide in the cell. A reference was performed using power rate of 3 μcal/s. The resulting ITC data were processed and fit to a one-site-binding model to determine KD (dissociation constant) using the ORIGIN 7.0 software.
Protein Crystallization
The initial crystallization condition was obtained from Hampton Research crystal screen kits using the vapor diffusion sitting drop method. Briefly, 10 mg/ml of VP30130–272 was mixed with RBBP6549-571 peptide in a 1:1.5 molar ratio. Protein crystals were observed in 3 different conditions. Initial hit conditions were then optimized using in-house reagents at 20 °C. The dataset from which the structure was solved was obtained from a crystal that grew in 0.2 M calcium acetate hydrate, 0.1 M sodium cacodylate trihydrate pH 6.3, 16% polyethylene glycol 8,000 and vitrified in mother liquor supplemented with 20% glycerol as the cryoprotectant.
Fluorescence Polarization Assay (FPA)
FPA experiments were performed on a Cytation5 plate reader (BioTek; Winooski, VT) operating on Gen5 software. Excitation and emission wavelengths were set to 485 and 528 nm, respectively, with a band pass of 20 nm. Sample read height was 8.5 nm and G factor was set to 1.26 using the autogain function within the Gen5 software. For competition experiments, 0.5 μM of fluorescein isothiocyanate (FITC) labeled NP600-615 (FITC-NP peptide) was incubated with 24 μM of VP30CTD in buffer containing 20 mM Tris (pH 7.5), 150 mM NaCl, 2mM Tris(2- carboxyethyl)phosphine). RBBP6 or NP peptides at concentrations ranging from 0.13 to 500 μM with 2.5 fold dilution were loaded into a 96-well plate. After 20 min of incubation, fluorescence polarization signals were read. The fluorescence polarization values were plotted against RBBP6 or eNP peptide concentrations to fit the dissociation constant, KD, using GraphPad Prism software (La Jolla, CA).
Minigenome Assays
HEK293T cells were transfected with plasmids expressing viral proteins pCAGGS-VP35, -L, -NP, -VP30 or -VP30 mutants along with pCAGGS-T7 polymerase and minigenome reporter plasmid (pM1-MG) that encodes for Renilla luciferase flanked by the minimally required cis-acting transcription and replication signals from the EBOV genome. For some of the minigenome assays, a 5’UTR mutant minigenome was used as a template in which a stem loop at transcriptional start site of NP was disrupted (Weik et al., 2002). A plasmid that expresses Firefly luciferase were co-transfected and served as an internal control. Reporter activity was read 48 h post-transfection using the Dual-luciferase Reporter assay system (Promega). Renilla luciferase activity was normalized to Firefly luciferase values and plotted as fold activity calculated relative to either the no VP30 or VP35 control.
Gene Silencing using siRNA
For the minigenome assay, HEK293T cells were transfected with 25nM of SMARTpool:Accell siRNA against RBBP6 (Dharmacon) or control ON-TARGET plus Non-targeting siRNA (ThermoFisher Scientific) using lipofectamine RNAiMAX (Invitrogen). The minigenome assay was performed 24 h post-siRNA transfection. For the EBOV infection studies, HeLa cells were seeded into 24-well plates and transfected with siRNA duplexes targeting RBBP6 or NPC1 (QIAgen, Germantown, MD) at a final concentration of 5nM using RNAiMAX transfection reagent according to the manufacturer’s protocol. For gene knockdown in MDMs, cells maintained in 96-well or 24-well plates were transfected with 150 nM RBBP6 siRNA (SMARTpool:Accell siRNA) or the same concentration of scrambled control siRNA with TransIT-X2 Transfection reagent (Mirus), following the manufacturer’s recommendations. HUVEC cells grown in 96-well or 6-well plates were transfected with 30 nM RBBP6 siRNA (SMARTpool:Accell siRNA) or the same concentration of scrambled control siRNA using RNAiMAX transfection reagent (Thermo Fisher), following the manufacturer’s recommendations. Infections and RBBP6 knockdown assessment in all cell types were carried out 48 h post-siRNA transfection.
RNA Isolation and Quantitative RT-PCR
Total RNA was extracted from cells using the RNeasy mini kit (QIAgen) as per the manufacturer’s protocol. Residual plasmid DNA was removed by on-column DNase digestion using RNase-free DNase (Qiagen). For cDNA synthesis, ~1μg RNA was reverse transcribed using a Superscript® III First-Strand Synthesis kit (ThermoFisher Scientific) using an oligo dT primer. Real-time PCR was performed using the PerfeCTa SYBR Green FastMix (QuantaBio) on a CFX96 Real-Time PCR detection system (Bio-Rad), with a PCR temperature profile as follows: 95°C for 30 seconds and then 40 cycles of 95°C for 5 seconds, 55°C for 15 seconds and 68°C for 10 seconds. The expression levels of V P30, NP, RBBP6 and actin mRNA were analyzed using gene specific primers as listed in Key Resources Table. Expression levels were normalized to the actin house-keeping gene and mRNA copies calculated relative to mock-transfected cells.
KEY RESOURCES TABLE
| REAGENT or RESOURCE | SOURCE | IDENTIFIER |
|---|---|---|
| Antibodies | ||
| Rabbit polyclonal anti-RBBP6 | Origene | Cat#TA309830; RRID:AB_2721115 |
| Mouse monoclonal anti-FLAG M2 antibody | Sigma Aldrich | Cat#F1804; RRID:AB_262044 |
| Rabbit polyclonal anti-flag antibody | Sigma Aldrich | Cat#F7425; RRID:AB_439687 |
| Mouse monoclonal anti-HA antibody | Sigma Aldrich | Cat#H3663; RRID:AB_262051 |
| Rabbit polyclonal anti-HA antibody | Sigma Aldrich | Cat#H6908; RRID:AB_260070 |
| Mouse monoclonal anti-β-tubulin antibody | Sigma Aldrich | Cat# T8328; RRID:AB_1844090 |
| Mouse monoclonal anti-myosinVa antibody | Santa Cruz | Cat#sc-365986; RRID:AB_10917581 |
| Mouse monoclonal anti-ANP32a antibody | Santa Cruz | Cat#sc-100767; RRID:AB_1124655 |
| Anti-KPNA5 antibody (1D2) | Santa Cruz | Cat#sc-517105; RRID:AB_2721174 |
| Rabbit anti-Ebola VP30 sera | This paper | N/A |
| Rabbit anti-Ebola NP sera | This paper | N/A |
| Anti-Ebola GP antibody clone 4F3 | IBT Bioservices | Cat#0201-020 |
| Goat IgG (H+L) anti-mouse Alexa Flour 546 conjugate | ThermoFisher scientific | Cat#A11030; RRID:AB_2534089 |
| Bacterial and Virus Strains | ||
| E. coli TOP10 | Invitrogen | Cat#C404003 |
| E. coli BL21(DE3) | Novagen | Cat#69450-3 |
| EBOV: Mayinga variant (GENBANK: NC_002549.1) | Texas Biomedical Research Institute | N/A |
| EBOV-EGFP: Mayinga variant (GENBANK: KF990213.1) | Heinz Feldmann (NIH, Hamilton, MT) | N/A |
| Chemicals, Peptides, and Recombinant Proteins | ||
| Lipofectamine2000 | Invitrogen | Cat#11668500 |
| TransIT-X2 | Mirus | Cat#MIR6003 |
| Lipofectamine LTX | Thermo Fisher Scientific | Cat#15338500 |
| Lipofectamine RNAiMAX | Thermo Fisher Scientific | Cat#13778-150 |
| PolyJet | SignaGen Laboratories | Cat#SL100688 |
| Protease inhibitor cocktail | Sigma Aldrich (Roche) | Cat#11836170001 |
| RBBP6 peptide (SLPATPVFVPVPPPPLYPPPPHT) | Genscript | N/A |
| Perfecta SYBR Green Fastmix | VWR | Cat#101414-270 |
| Doxycycline | Clontech | Cat#631311 |
| PhosSTOP Phosphatase Inhibitor | Sigma-Aldrich | Cat#4906845001 |
| Nonidet P 40 Substitute | Fluka Analytical/Sigma-Aldrich | Cat#74385 |
| D-Desthiobiotin | IBA Lifesciences | Cat# 2-1000-001 |
| Sequencing Grade Modified Trypsin | Promega | Cat#V5113 |
| Critical Commercial Assays | ||
| QIAGEN Plasmid Plus Maxi Kit | Qiagen | Cat#12963 |
| RNeasy Mini Kit | Qiagen | Cat#74104 |
| QIAquick Gel Extraction Kit | Qiagen | Cat#28704 |
| QIAquick PCR Purification Kit | Qiagen | Cat#28104 |
| Dual-Glo® Luciferase Assay System | Promega | Cat#E2940 |
| QuikChange multi site-directed mutagenesis kit | Agilent Technologies | Cat#200514 |
| SuperScript® III First-Strand Synthesis System | Thermo Fisher Scientific | Cat#18080051 |
| Hampton Research crystal screen kits | Hampton research | Cat#HR2-110 |
| Neon transfection system 10 μl kit | Thermo Fisher Scientific | Cat#MPK1096 |
| Human Macrophage Nucleofector kit | Lonza | Cat#VPA-1008 |
| Pierce Silver Stain Kit | Thermo Scientific | Cat#24612 |
| Deposited Data | ||
| Crystal Structure of EBOV VP30 bound to RBBP6 peptide 553-567 | This paper | PDB: 6E5X |
| Experimental Models: Mammalian Cells | ||
| HEK293T | ATCC | CRL-3216 |
| HuH-7 | Frydman Lab | N/A |
| HeLa, female, authenticated by Bio-Synthesis, Inc | ATCC | CLL-2 |
| Vero | ATCC | CLL-81 |
| MDM | Texas Biomedical Research Institute | N/A |
| HUVEC | ATCC | Cat#PCS-100-013 |
| Oligonucleotides | ||
| Refer to Table S3. | n/a | n/a |
| Recombinant DNA | ||
| pCAGGS-RBBP6 isoform 1 | This paper | N/A |
| pCAGGS-RBBP6 isoform 3 | This paper | N/A |
| pCAGGS-NP | Hoenen et al.,2010; Edwards et al., 2015 | N/A |
| pCAGGS-VP30 | Hoenen et al.,2010; Edwards et al., 2015 | N/A |
| pCAGGS-VP35 | Hoenen et al.,2010; Edwards et al., 2015 | N/A |
| pCAGGS-L | Hoenen et al.,2010; Edwards et al., 2015 | N/A |
| pCAGGS-VP30 E197A | Xu et al., 2017 | N/A |
| pCAGGS-VP30 D202A | Xu et al., 2017 | N/A |
| pCAGGS-VP30 197/202/203AAA | Xu et al., 2017 | N/A |
| pCAGGS-VP30 Q229A | Xu et al., 2017 | N/A |
| pCAGGS-VP30 W230A | Xu et al., 2017 | N/A |
| pCAGGS-VP30 229/230AA | Xu et al., 2017 | N/A |
| pCAGGS-NP 610-612AAA | Xu et al., 2017 | N/A |
| pCAGGS-NP 603-606AAGG | Xu et al., 2017 | N/A |
| pCAGGS-VP30 R26A | This paper | N/A |
| pCAGGS-VP30 R28A | This paper | N/A |
| pCAGGS-VP30 R40A | This paper | N/A |
| pCAGGS-VP30 3RA | This paper | N/A |
| pCAGGS-VP30 C72S | This paper | N/A |
| pCAGGS-VP30 Reston virus | This paper | N/A |
| pCAGGS-VP30 Lloviu virus | This paper | N/A |
| pCAGGS-GFP-RBBP6 549-571aa | This paper | N/A |
| pMBP-VP30 truncations | Xu et al., 2017; this paper | N/A |
| pMBP-RBBP6 truncations | This paper | N/A |
| pLVX-TetOne-Puro-Nter2XStrep-ebovNP | This paper | N/A |
| pLVX-TetOne-Puro-Nter2XStrep-ebovVP35 | This paper | N/A |
| pLVX-TetOne-Puro-Nter2XStrep-ebovVP40 | This paper | N/A |
| pLVX-TetOne-Puro-Cter2XStrep-ebovGP | This paper | N/A |
| pLVX-TetOne-Puro-Cter2XStrep-ebovVP30 | This paper | N/A |
| pLVX-TetOne-Puro-Nter2XStrep-ebovVP24 | This paper | N/A |
| pLVX-TetOne-Puro-Nter2XStrep-ebovVP35-K319A-R322A | Leung et al., 2010; Prins et al., 2010 | N/A |
| pLVX-TetOne-Puro-Nter2XStrep-ebovVP35-Q74A | Kubota et al., 2009; Luthra et al., 2015 | N/A |
| pLVX-TetOne-Puro-Nter2XStrep-ebovVP24-F134A-M136A | Xu et al., 2014 | N/A |
| pLVX-TetOne-Puro-Nter2XStrep-ebovVP24-L201A-E203A-P204A-D205A-S207A | Xu et al., 2014 | N/A |
| pLVX-TetOne-Puro | This paper | N/A |
| pLVX-TetOne-Puro-Cter2XStrep-EGFP | This paper | N/A |
| Software and Algorithms | ||
| GraphPad Prism 7 | GraphPad Software | www.graphpad.com |
| CFX96 Real-Time PCR detection system | Bio-Rad | N/A |
| CellProfiler software | Broad Institute | http://cellprofiler.org/ |
| Nikon Ti-Eclipse microscope running high content analysis software | Nikon | https://www.nikoninstruments.com/Products/High-Content-Imaging-Systems/HCA-High-Content-Microscope-System |
| ORIGIN 7.0 software | OriginLab | https://www.originlab.com |
| CCP4 program suite | Collaborative Computational Project No.4 | http://www.ccp4.ac.uk/ |
| HKL3000 | HKL Research, Inc. | http://www.hkl-xray.com/hkl-3000 |
| PyMOL | Schrödinger | https://pymol.org/2/ |
| LigPlot+ | The European Bioinformatics Institute (EMBL-EBI) | https://www.ebi.ac.uk/thornton-srv/software/LigPlus/ |
| MiST algorithm | Jager et al., 2011 | n/a |
| Other | ||
| EASY-Column Capillary Columns (0.1mm × 20mm, 5um particles) | Thermo Scientific | Cat#SC001 |
| EASY-Column Capillary Columns (0.075mm × 100mm, 3um particles) | Thermo Scientific | Cat#SC200 |
| Strep-Tactin Sepharose 50% suspension | IBA Lifesciences | Cat#2-1201-010 |
| OMIX C18 pipette tips, 2 - 10 μL | Agilent | Cat#A5700310 |
| 4–20% Criterion Tris-HCl Protein Gel | Bio-Rad Laboratories | Cat#3450034 |
| 4–20% Criterion TGX Precast Gel | Bio-Rad Laboratories | Cat#5671095 |
EBOV Infection Assay
To test if RBBP6 affected EBOV infection, siRNA-treated HeLa cells were collected 48 h after siRNA transfection. Twenty thousand cells were plated into wells of a 96-well plate in triplicate for infection with EBOV-EGFP; the remaining cells were plated into wells of new 24-well plates to be tested for gene silencing. After allowing 24 h for the cells to adhere, virus was added at an MOI of 0.1 for 24 h. The cells were then fixed in 10% buffered formalin, stained with the Hoechst dye, and the infection rate was calculated as the ratio of infected cells to cell nuclei. RBBP6 protein depletion was assessed by immunoblotting as described with cells collected at the same time as infection took place. For quantification, ≥7,000 cells, in triplicate were analyzed. MDMs or HUVEC cells grown in 96-well plates were incubated with EBOV-EGFP at MOI of 0.04 or 0.2 in triplicate at 37°C for 1 h. Then, virus inoculum was removed, and cells were overlaid with fresh medium and incubated at 37°C for either 24 h or 48 h. Subsequently, samples were fixed and stained with the Hoechst dye. Imaged, and analysis in ≥3,000 MDMs or ≥500 HUVEC cells, in triplicate for each cell type, were performed as described for HeLa cells. Gene knockdown was assessed by qRT-PCR in siRNA-treated cells grown in 24-well (MDM) or 6-well (HUVEC) plates. To test the effect of RBBP6-derived peptide on EBOV infection, HeLa cells were transfected with plasmids expressing GFP-flag or GFP-RBBP6 peptide-flag by electroporation using the Neon transfection system (ThermoFisher) as per the manufacturer’s protocol. Briefly, trypsinized HeLa cells were pelleted by centrifugation at 400 ×g for 3.5 minutes followed by suspension in PBS. Cells in PBS were pelleted again and suspended in buffer R at a final concentration of 5×10⁶ cells/mL. 1.5μg of plasmid DNA was electroporated into cells using a 10μl tip (1005 Volts, 35ms pulse width, 2 pulses). 20,000 electroporated cells were plated in each well of a 96-well plate. 24 h post-transfection, cells were carried to a BSL-4 lab and challenged with EBOV at an MOI of 0.5. Cells were fixed after 24 h in 10% neutral buffered formalin and stained for EBOV GP by using a previously described protocol (Anantpadma et al., 2016). Briefly, 24 h post-infection, cells were fixed by immersing the plate in formalin. Fixed cells were washed in PBS, permeabilized with 0.1% triton-X, and blocked with 3.5% BSA. Blocking was followed by incubation with a primary anti-EBOV GP antibody (IBT Bioservices) for 2 h at room temperature. Unbound antibody was washed off by rinsing twice in PBS. This was followed by incubating with a secondary anti-Mouse Alexa 546 antibody (ThermoFisher) for 1 h. Excess antibody was washed off by rinsing three times with PBS followed by addition of Hoechst dye to stain cell nuclei (ThermoFisher). Plates were imaged on a Nikon Ti-Eclipse microscope. Images corresponding to nuclei (Hoechst-420nm), transfected cells (GFP, 488nm) and infected cells (orange-red channel, 546nm) were acquired (14 images per well). Images were analyzed using CellProfiler software. GP expression was used as a marker to identify cells undergoing active virus replication. For this, GFP positive cells were defined as objects and the corresponding intensity of each object in the 546nm red channel was measured. The intensity measurements were exported to FCS express and the intensities were plotted as histograms. The intensity of the 546 channel in non-infected cells was used as a cutoff for defining the lower threshold of the specific GP signal. A minimum of 10,000 cells per well (~600 per field) were analyzed for quantification. The number of cells that were above the threshold and the total number of cells were determined. The number of co-expressing cells was divided by the total number of GFP positive cells to calculate percent infection values. These values were plotted with Graphpad prism software. For plasmid-based overexpression of RBBP6 peptide in MDMs, day 5 PBMCs were re-suspended in Amaxa Nucleofector solution (Lonza) and incubated for 5 min at RT with 3 μg plasmid DNA, then nucleofected following the manufacturer’s recommendations. Transfected PBMCs were seeded into 24-well plates, incubated for 2-3h in RPMI with 10% autologous serum, then lymphocytes were washed away, and remaining MDMs were incubated overnight in RPMI with 10% autologous serum. All transfections were performed in duplicate. Cells were subsequently incubated with EBOV at MOI of 1 for 24 h, fixed, stained with anti-GP antibody and the Hoechst dye, imaged, and analyzed as described for HeLa cells. ~20 GFP positive cells from each replicate were analyzed for quantification. HUVEC cells plated into wells of a 96-well plate were transfected with 0.05 μg plasmid DNA per well using Lipofectamine LTX transfection reagent (Thermo Fisher), following the manufacturer’s recommendations. After 24 h, cells were incubated with EBOV at MOI of 1 for 24 h, fixed, stained with anti-GP antibody and Hoechst dye, imaged, and analyzed as described for HeLa cells. To quantify for percent infection, ~100 cells expressing GFP in 5 different fields were analyzed.
Isolation of proteins from EBOV-infected lysates
HeLa cells were transfected with scrambled siRNA or siRNA targeting RBBP6, followed by EBOV infection. 24 h post-infection, cells were lysed in Trizol reagent and proteins were isolated as by following the manufacturer’s protocol (Invitrogen). Briefly, 0.2mL of chloroform was added per 1mL of Trizol used, mixed and incubated for 10 min at room temperature. Samples were centrifuged for 15 min at 12,000g at 4°C. The upper aqueous phase was removed and 0. 3mL of 100% ethanol was added to the lower phenol-chloroform phase. Proteins were precipitated by adding isopropanol and protein pellet was washed twice in 0.3M guanidine hydrochloride in 95% ethanol. Pellet was air dried and re-suspended in 1% SDS.
QUANTIFICATION AND STATISTICAL ANALYSIS
Quantification and statistical analysis of the mass spectrometry data was performed using Protein Prospector and the MiST algorithm as described above. Enrichment analyses were carried out using publicly available enrichment databases (KEGG) and were assigned statistical values using the hypergeometric test and g:ProfileR as described above. ITC data were fit to a one-site-binding model to determine KD (dissociation constant) using the ORIGIN 7.0 software. Quantification of the microscopy images was carried out using CellProfiler software as described above. Quantification of western blot images was performed by densitometry in Image Lab 6.0 software (Bio-Rad). All other statistical analysis was performed using GraphPad Prism 7. All statistical details and the appropriate definition of parameters can be found in the figure legends and text. Data points were considered significantly different if the p-value was <0.05.
DATA AND SOFTWARE AVAILABILITY
Scored mass spectrometry data files have been uploaded here as Supplemental Table S1. The crystal structure of VP30 bound to the RBBP6 peptide is available for downloading as a PDB file (PDB: 6E5X). All structure analyses were carried out by various programs as implemented in the CCP4 program suite. Final structure figures are prepared using PyMOL.
Supplementary Material
FIGURE S1, related to Figure 3.
Co-immunoprecipitation was performed between flag-RBBP6 and HA-tagged VP30, VP35 and NP.
FIGURE S2, related to Figure 4.
(A) Constructs of RBBP6 and VP30 used for in vitro studies.
(B) Representative gel images of in vitro pull-down assay showing binding to VP30CTD Of RBBP6 peptide 549-573 (left) and lack of binding to VP30CTD by RBBP6 peptide 579-625 (right); M, marker; B, beads; W, wash; I, input; IB, input beads; FB, final beads; E, elution. Green boxes indicate binding and red boxes indicate no binding.
(C) Surface representation of the VP30CTD structure with a 1σ electron density (σA-weighted 2Fo – Fc) mesh for RBBP6 peptide.
(D) Co-IP to assess interaction between HA-VP30 and wild-type or multi-residue mutants of RBBP6 in 559-666aa (DDPGALDA) region.
FIGURE S3, related to Figure 6.
(A) Quantification of western blot images by densitometry of bands in Figure 6B. Percent VP30 levels were plotted relative to scrambled siRNA from two independent experiments. Statistical significance was calculated using Student’s t-test.
(B) Densitometry analysis of VP30 protein levels of bands in Figure 6C. Percent levels were calculated relative to vector control for each VP30 concentration used, from three replicates. Statistical significance was calculated using Tukey’s multiple comparisons test.
(C) Graph representing percent VP30 levels of western blots in Figure 6D, analyzed by densitometry. Percent values were calculated relative to GFP control for each VP30 concentration used, from two replicates. Statistical significance was calculated using Tukey’s multiple comparisons test.
(D) A minigenome assay was performed in the presence of transiently expressed RBBP6 isoform 1 and 3 at two different concentrations: 50 ng and 500 ng.
(E) RBBP6 was over-expressed in the minigenome assay using 5’UTR mutant minigenome as a template that has reduced dependency on VP30 for transcription. Fold activity was calculated relative to no VP35 control.
(F) Reporter activity was measured upon over-expression of GFP fused to peptides derived from NP and RBBP6 at indicated doses. Representative western blots probing levels of VP30 and peptide are shown.
FIGURE S4, related to Figure 6.
(A) 293T cells were co-transfected with HA-VP30 and flag-RBBP6 along with titration of HA-tagged VP35 and NP. Protein levels of VP30, VP35 and NP were analyzed in total cell lysates using indicated antibodies. Relative levels of VP30, VP35 and NP were analyzed by densitometry.
(B) Protein levels of wtVP30 and E197A were analyzed in RBBP6 over-expressed cells. Relative VP30 levels were analyzed by densitometry.
(C) Effect of RBBP6 on minigenome activity was tested using wtVP30 and E197A. Graph represents percent activity values and set relative to vector control.
(D) mRNA levels of wtVP30 and E197A were analyzed in RBBP6 over-expressed cells.
(E) mRNA copies of VP30 and NP were quantified by real-time PCR upon over-expression of RBBP6. Data represent mean ± S.D. from one representative experiment (n= 3). Statistical significance was calculated using Student’s t-test. ****p<0.0001; ***p<0.001, **p<0.01, *p<0.03.
FIGURE S5, related to Figure 7.
(A) Efficacy of RBBP6 knockdown was tested in HeLa cells upon transfection of 5 nM scrambled siRNA or siRNAs targeting RBBP6. Seventy-two hours post-transfection, cellular levels of RBBP6 were analyzed using anti-RBBP6 antibody in the whole cell lysate.
(B) Analysis of mRNA levels of RBBP6 in MDM or HUVEC after indicated siRNA treatments by qRT-PCR.
(C) Infection efficiency after treatment of MDM and HUVEC with indicated siRNA. Cells were treated with siRNA and then challenged with EBOV-GFP at each indicated MOI. Cells were then fixed in formalin at the indicated hour post infection (hpi) and stained for EBOV GP (green) and cell nuclei with Hoechst stain (blue) then imaged by microscopy. The relative number of infected cells for each indicated treatment compared to mock treated cells is indicated ± SD for 3 replicates. ANOVA with Tukey’s multiple comparisons test was used to determine significance.
(D) Representative images of MDM or HUVEC transfected with plasmids encoding GFP-flag or GFP-RBBP6 peptide-flag. Cells were stained with EBOV GP antibody and imaged for both GFP (green) and GP staining (red). Scale bars are 100 μm.
TABLE S1, related to Figures 1-3.
List of host proteins identified by AP-MS with MiST score greater than or equal to 0.75.
TABLE S2, related to Figure 4.
Data collection and refinement statistics for the VP30-RBBP6 peptide structure.
HIGHLIGHTS.
194 high-confidence Ebola virus-host protein interactions identified by AP-MS
Host protein RBBP6 targets the VP30 protein at the viral nucleoprotein binding cleft
RBBP6 competes with NP for binding to VP30 and inhibits Ebola virus RNA synthesis
RBBP6-derived peptides potently inhibit Ebola virus infection
ACKNOWLEDGEMENTS
This work was supported by NIH grants P50GM082250 (N.J.K.), U19AI106754 (N.J.K.), R01AI120694 (N.J.K.), P01AI063302 (N.J.K.), U19AI109664 (C.F.B.), U19AI109945 (C.F.B.), P01120943 (G.K.A., D.W.L., D.J.L., R.A.D. and C.F.B.) and R01AI114814 (D.J.L and R.A.D.). J.F.H. is supported by amfAR grant 109504-61-RKRL with funds raised by generationCURE. O.S. is supported by Forum grant by Texas Biomedical Research Institute. G.I.S. was funded in part by BioSURf and HHMI. C.F.B. is a Georgia Research Alliance Eminent Scholar in Microbial Pathogenesis.
Footnotes
Publisher's Disclaimer: This is a PDF file of an unedited manuscript that has been accepted for publication. As a service to our customers we are providing this early version of the manuscript. The manuscript will undergo copyediting, typesetting, and review of the resulting proof before it is published in its final citable form. Please note that during the production process errors may be discovered which could affect the content, and all legal disclaimers that apply to the journal pertain.
Lead Contact
DECLARATION OF INTERESTS
The authors declare no competing interests.
REFERENCES
- Afonso CL, Amarasinghe GK, Banyai K, Bao Y, Basler CF, Bavari S, Bejerman N, Blasdell KR, Briand FX, Briese T, et al. (2016). Taxonomy of the order Mononegavirales: update 2016. Arch Virol 161, 2351–2360. [DOI] [PMC free article] [PubMed] [Google Scholar]
- Anantpadma M, Kouznetsova J, Wang H, Huang R, Kolokoltsov A, Guha R, Lindstrom AR, Shtanko O, Simeonov A, Maloney DJ, et al. (2016). Large-Scale Screening and Identification of Novel Ebola Virus and Marburg Virus Entry Inhibitors. Antimicrob Agents Chemother 60, 4471–4481. [DOI] [PMC free article] [PubMed] [Google Scholar]
- Baltz AG, Munschauer M, Schwanhausser B, Vasile A, Murakawa Y, Schueler M, Youngs N, Penfold-Brown D, Drew K, Milek M, et al. (2012). The mRNA-bound proteome and its global occupancy profile on protein-coding transcripts. Mol Cell 46, 674–690. [DOI] [PubMed] [Google Scholar]
- Banadyga L, Hoenen T, Ambroggio X, Dunham E, Groseth A, and Ebihara H (2017). Ebola virus VP24 interacts with NP to facilitate nucleocapsid assembly and genome packaging. Sci Rep 7, 7698. [DOI] [PMC free article] [PubMed] [Google Scholar]
- Baron RC, McCormick JB, and Zubeir OA (1983). Ebola virus disease in southern Sudan: hospital dissemination and intrafamilial spread. Bull World Health Organ 61, 997–1003. [PMC free article] [PubMed] [Google Scholar]
- Basler CF, Wang X, Muhlberger E, Volchkov V, Paragas J, Klenk HD, Garcia-Sastre A, and Palese P (2000). The Ebola virus VP35 protein functions as a type I IFN antagonist. Proc Natl Acad Sci U S A 97, 12289–12294. [DOI] [PMC free article] [PubMed] [Google Scholar]
- Bausch DG, and Rojek A (2016). West Africa 2013: Re-examining Ebola. Microbiol Spectr 4. [DOI] [PubMed] [Google Scholar]
- Biedenkopf N, Hartlieb B, Hoenen T, and Becker S (2013). Phosphorylation of Ebola virus VP30 influences the composition of the viral nucleocapsid complex: impact on viral transcription and replication. J Biol Chem 288, 11165–11174. [DOI] [PMC free article] [PubMed] [Google Scholar]
- Biedenkopf N, Schlereth J, Grunweller A, Becker S, and Hartmann RK (2016). RNA Binding of Ebola Virus VP30 Is Essential for Activating Viral Transcription. J Virol 90, 7481–7496. [DOI] [PMC free article] [PubMed] [Google Scholar]
- Boehmann Y, Enterlein S, Randolf A, and Muhlberger E (2005). A reconstituted replication and transcription system for Ebola virus Reston and comparison with Ebola virus Zaire. Virology 332, 406–417. [DOI] [PubMed] [Google Scholar]
- Cardenas WB, Loo YM, Gale M Jr., Hartman AL, Kimberlin CR, Martinez-Sobrido L, Saphire EO, and Basler CF (2006). Ebola virus VP35 protein binds double-stranded RNA and inhibits alpha/beta interferon production induced by RIG-I signaling. J Virol 80, 5168–5178. [DOI] [PMC free article] [PubMed] [Google Scholar]
- Chibi M, Meyer M, Skepu A, DJ GR, Moolman-Smook JC, and Pugh DJ (2008). RBBP6 interacts with multifunctional protein YB-1 through its RING finger domain, leading to ubiquitination and proteosomal degradation of YB-1. J Mol Biol 384, 908–916. [DOI] [PubMed] [Google Scholar]
- Davis ZH, Verschueren E, Jang GM, Kleffman K, Johnson JR, Park J, Von Dollen J, Maher MC, Johnson T, Newton W, et al. (2015). Global mapping of herpesvirus-host protein complexes reveals a transcription strategy for late genes. Mol Cell 57, 349–360. [DOI] [PMC free article] [PubMed] [Google Scholar]
- Di Giammartino DC, Li W, Ogami K, Yashinskie JJ, Hoque M, Tian B, and Manley JL (2014). RBBP6 isoforms regulate the human polyadenylation machinery and modulate expression of mRNAs with AU-rich 3' UTRs. Genes Dev 28, 2248–2260. [DOI] [PMC free article] [PubMed] [Google Scholar]
- Edwards MR, Pietzsch C, Vausselin T, Shaw ML, Bukreyev A, and Basler CF (2015). High-Throughput Minigenome System for Identifying Small-Molecule Inhibitors of Ebola Virus Replication. ACS Infect Dis 1, 380–387. [DOI] [PMC free article] [PubMed] [Google Scholar]
- Falcon S, and Gentleman R (2007). Using GOstats to test gene lists for GO term association. Bioinformatics 23, 257–258. [DOI] [PubMed] [Google Scholar]
- Feldmann H, Sanchez A, and Geisbert TW (2015). Filoviridae: Marburg and Ebola Viruses (Philadelphia: :: Wolters Kluwer; ). [Google Scholar]
- Garcia-Dorival I, Wu W, Armstrong SD, Barr JN, Carroll MW, Hewson R, and Hiscox JA (2016). Elucidation of the Cellular Interactome of Ebola Virus Nucleoprotein and Identification of Therapeutic Targets. J Proteome Res 15, 4290–4303. [DOI] [PubMed] [Google Scholar]
- Garcia-Dorival I, Wu W, Dowall S, Armstrong S, Touzelet O, Wastling J, Barr JN, Matthews D, Carroll M, Hewson R, et al. (2014). Elucidation of the Ebola virus VP24 cellular interactome and disruption of virus biology through targeted inhibition of host-cell protein function. J Proteome Res 13, 5120–5135. [DOI] [PubMed] [Google Scholar]
- Georges AJ, Leroy EM, Renaut AA, Benissan CT, Nabias RJ, Ngoc MT, Obiang PI, Lepage JP, Bertherat EJ, Benoni DD, et al. (1999). Ebola hemorrhagic fever outbreaks in Gabon, 1994–1997: epidemiologic and health control issues. J Infect Dis 179 Suppl 1, S65–75. [DOI] [PubMed] [Google Scholar]
- Gerhard DS, Wagner L, Feingold EA, Shenmen CM, Grouse LH, Schuler G, Klein SL, Old S, Rasooly R, Good P, et al. (2004). The status, quality, and expansion of the NIH full-length cDNA project: the Mammalian Gene Collection (MGC). Genome Res 14, 2121–2127. [DOI] [PMC free article] [PubMed] [Google Scholar]
- Groseth A, Charton JE, Sauerborn M, Feldmann F, Jones SM, Hoenen T, and Feldmann H (2009). The Ebola virus ribonucleoprotein complex: a novel VP30-L interaction identified. Virus Res 140, 8–14. [DOI] [PMC free article] [PubMed] [Google Scholar]
- Hartlieb B, Modrof J, Muhlberger E, Klenk HD, and Becker S (2003). Oligomerization of Ebola virus VP30 is essential for viral transcription and can be inhibited by a synthetic peptide. J Biol Chem 278, 41830–41836. [DOI] [PubMed] [Google Scholar]
- Hoenen T, Biedenkopf N, Zielecki F, Jung S, Groseth A, Feldmann H, and Becker S (2010). Oligomerization of Ebola virus VP40 is essential for particle morphogenesis and regulation of viral transcription. J Virol 84, 7053–7063. [DOI] [PMC free article] [PubMed] [Google Scholar]
- Huang Y, Xu L, Sun Y, and Nabel GJ (2002). The assembly of Ebola virus nucleocapsid requires virion-associated proteins 35 and 24 and posttranslational modification of nucleoprotein. Mol Cell 10, 307–316. [DOI] [PubMed] [Google Scholar]
- Ilinykh PA, Tigabu B, Ivanov A, Ammosova T, Obukhov Y, Garron T, Kumari N, Kovalskyy D, Platonov MO, Naumchik VS, et al. (2014). Role of protein phosphatase 1 in dephosphorylation of Ebola virus VP30 protein and its targeting for the inhibition of viral transcription. J Biol Chem 289, 22723–22738. [DOI] [PMC free article] [PubMed] [Google Scholar]
- Jager S, Cimermancic P, Gulbahce N, Johnson JR, McGovern KE, Clarke SC, Shales M, Mercenne G, Pache L, Li K, et al. (2011a). Global landscape of HIV-human protein complexes. Nature 481, 365–370. [DOI] [PMC free article] [PubMed] [Google Scholar]
- Jager S, Kim DY, Hultquist JF, Shindo K, LaRue RS, Kwon E, Li M, Anderson BD, Yen L, Stanley D, et al. (2011b). Vif hijacks CBF-beta to degrade APOBEC3G and promote HIV-1 infection. Nature 481, 371–375. [DOI] [PMC free article] [PubMed] [Google Scholar]
- John SP, Wang T, Steffen S, Longhi S, Schmaljohn CS, and Jonsson CB (2007). Ebola virus VP30 is an RNA binding protein. J Virol 81, 8967–8976. [DOI] [PMC free article] [PubMed] [Google Scholar]
- Kirchdoerfer RN, Moyer CL, Abelson DM, and Saphire EO (2016). The Ebola Virus VP30-NP Interaction Is a Regulator of Viral RNA Synthesis. PLoS Pathog 12, e1005937. [DOI] [PMC free article] [PubMed] [Google Scholar]
- Kirchdoerfer RN, Wasserman H, Amarasinghe GK, and Saphire EO (2017). Filovirus Structural Biology: The Molecules in the Machine. Curr Top Microbiol Immunol 411, 381–417. [DOI] [PubMed] [Google Scholar]
- Kruse T, Biedenkopf N, Hertz EPT, Dietzel E, Stalmann G, Lopez-Mendez B, Davey NE, Nilsson J, and Becker S (2018). The Ebola Virus Nucleoprotein Recruits the Host PP2A-B56 Phosphatase to Activate Transcriptional Support Activity of VP30. Mol Cell 69, 136–145 e136. [DOI] [PubMed] [Google Scholar]
- Lamunu M, Lutwama JJ, Kamugisha J, Opio A, Nambooze J, Ndayimirije N, and Okware S (2004). Containing a haemorrhagic fever epidemic: the Ebola experience in Uganda (October 2000-January 2001). Int J Infect Dis 8, 27–37. [DOI] [PubMed] [Google Scholar]
- Le Guenno B, Formenty P, and Boesch C (1999). Ebola virus outbreaks in the Ivory Coast and Liberia, 1994–1995. Curr Top Microbiol Immunol 235, 77–84. [DOI] [PubMed] [Google Scholar]
- Leung DW, Prins KC, Borek DM, Farahbakhsh M, Tufariello JM, Ramanan P, Nix JC, Helgeson LA, Otwinowski Z, Honzatko RB, et al. (2010). Structural basis for dsRNA recognition and interferon antagonism by Ebola VP35. Nat Struct Mol Biol 17, 165–172. [DOI] [PMC free article] [PubMed] [Google Scholar]
- Li L, Deng B, Xing G, Teng Y, Tian C, Cheng X, Yin X, Yang J, Gao X, Zhu Y, et al. (2007). PACT is a negative regulator of p53 and essential for cell growth and embryonic development. Proc Natl Acad Sci U S A 104, 7951–7956. [DOI] [PMC free article] [PubMed] [Google Scholar]
- Luthra P, Ramanan P, Mire CE, Weisend C, Tsuda Y, Yen B, Liu G, Leung DW, Geisbert TW, Ebihara H, et al. (2013). Mutual antagonism between the Ebola virus VP35 protein and the RIG-I activator PACT determines infection outcome. Cell Host Microbe 14, 74–84. [DOI] [PMC free article] [PubMed] [Google Scholar]
- Messaoudi I, Amarasinghe GK, and Basler CF (2015). Filovirus pathogenesis and immune evasion: insights from Ebola virus and Marburg virus. Nat Rev Microbiol 13, 663–676. [DOI] [PMC free article] [PubMed] [Google Scholar]
- Miller EH, Obernosterer G, Raaben M, Herbert AS, Deffieu MS, Krishnan A, Ndungo E, Sandesara RG, Carette JE, Kuehne AI, et al. (2012). Ebola virus entry requires the host-programmed recognition of an intracellular receptor. EMBO J 31, 1947–1960. [DOI] [PMC free article] [PubMed] [Google Scholar]
- Miotto B, Chibi M, Xie P, Koundrioukoff S, Moolman-Smook H, Pugh D, Debatisse M, He F, Zhang L, and Defossez PA (2014). The RBBP6/ZBTB38/MCM10 axis regulates DNA replication and common fragile site stability. Cell Rep 7, 575–587. [DOI] [PubMed] [Google Scholar]
- Mirrashidi KM, Elwell CA, Verschueren E, Johnson JR, Frando A, Von Dollen J, Rosenberg O, Gulbahce N, Jang G, Johnson T, et al. (2015). Global Mapping of the Inc-Human Interactome Reveals that Retromer Restricts Chlamydia Infection. Cell Host Microbe 18, 109–121. [DOI] [PMC free article] [PubMed] [Google Scholar]
- Modrof J, Becker S, and Muhlberger E (2003). Ebola virus transcription activator VP30 is a zinc-binding protein. J Virol 77, 3334–3338. [DOI] [PMC free article] [PubMed] [Google Scholar]
- Modrof J, Muhlberger E, Klenk HD, and Becker S (2002). Phosphorylation of VP30 impairs ebola virus transcription. J Biol Chem 277, 33099–33104. [DOI] [PubMed] [Google Scholar]
- Muhlberger E (2007). Filovirus replication and transcription. Future Virol 2, 205–215. [DOI] [PMC free article] [PubMed] [Google Scholar]
- Muhlberger E, Weik M, Volchkov VE, Klenk HD, and Becker S (1999). Comparison of the transcription and replication strategies of marburg virus and Ebola virus by using artificial replication systems. J Virol 73, 2333–2342. [DOI] [PMC free article] [PubMed] [Google Scholar]
- Negredo A, Palacios G, Vazquez-Moron S, Gonzalez F, Dopazo H, Molero F, Juste J, Quetglas J, Savji N, de la Cruz Martinez, M., et al. (2011). Discovery of an ebolavirus-like filovirus in europe. PLoS Pathog 7, e1002304. [DOI] [PMC free article] [PubMed] [Google Scholar]
- Pichlmair A, Kandasamy K, Alvisi G, Mulhern O, Sacco R, Habjan M, Binder M, Stefanovic A, Eberle CA, Goncalves A, et al. (2012). Viral immune modulators perturb the human molecular network by common and unique strategies. Nature 487, 486–490. [DOI] [PubMed] [Google Scholar]
- Ramage HR, Kumar GR, Verschueren E, Johnson JR, Von Dollen J, Johnson T, Newton B, Shah P, Horner J, Krogan NJ, et al. (2015). A combined proteomics/genomics approach links hepatitis C virus infection with nonsense-mediated mRNA decay. Mol Cell 57, 329–340. [DOI] [PMC free article] [PubMed] [Google Scholar]
- Reid SP, Leung LW, Hartman AL, Martinez O, Shaw ML, Carbonnelle C, Volchkov VE, Nichol ST, and Basler CF (2006). Ebola virus VP24 binds karyopherin alpha1 and blocks STAT1 nuclear accumulation. J Virol 80, 5156–5167. [DOI] [PMC free article] [PubMed] [Google Scholar]
- Reid SP, Valmas C, Martinez O, Sanchez FM, and Basler CF (2007). Ebola virus VP24 proteins inhibit the interaction of NPI-1 subfamily karyopherin alpha proteins with activated STAT1. J Virol 81, 13469–13477. [DOI] [PMC free article] [PubMed] [Google Scholar]
- Rialdi A, Hultquist J, Jimenez-Morales D, Peralta Z, Campisi L, Fenouil R, Moshkina N, Wang ZZ, Laffleur B, Kaake RM, et al. (2017). The RNA Exosome Syncs IAV-RNAPII Transcription to Promote Viral Ribogenesis and Infectivity. Cell 169, 679–692 e614. [DOI] [PMC free article] [PubMed] [Google Scholar]
- Ruepp A, Waegele B, Lechner M, Brauner B, Dunger-Kaltenbach I, Fobo G, Frishman G, Montrone C, and Mewes HW (2010). CORUM: the comprehensive resource of mammalian protein complexes--2009. Nucleic Acids Res 38, D497–501. [DOI] [PMC free article] [PubMed] [Google Scholar]
- Sakai Y, Saijo M, Coelho K, Kishino T, Niikawa N, and Taya Y (1995). cDNA sequence and chromosomal localization of a novel human protein, RBQ-1 (RBBP6), that binds to the retinoblastoma gene product. Genomics 30, 98–101. [DOI] [PubMed] [Google Scholar]
- Schlesinger LS (1993). Macrophage phagocytosis of virulent but not attenuated strains of Mycobacterium tuberculosis is mediated by mannose receptors in addition to complement receptors. J Immunol 150, 2920–2930. [PubMed] [Google Scholar]
- Schlesinger LS, and Horwitz MA (1990). Phagocytosis of leprosy bacilli is mediated by complement receptors CR1 and CR3 on human monocytes and complement component C3 in serum. J Clin Invest 85, 1304–1314. [DOI] [PMC free article] [PubMed] [Google Scholar]
- Scott RE, Giannakouros T, Gao S, and Peidis P (2003). Functional potential of P2P-R: a role in the cell cycle and cell differentiation related to its interactions with proteins that bind to matrix associated regions of DNA? J Cell Biochem 90, 6–12. [DOI] [PubMed] [Google Scholar]
- Shah PS, Wojcechowskyj JA, Eckhardt M, and Krogan NJ (2015). Comparative mapping of host-pathogen protein-protein interactions. Curr Opin Microbiol 27, 62–68. [DOI] [PMC free article] [PubMed] [Google Scholar]
- Simons A, Melamed-Bessudo C, Wolkowicz R, Sperling J, Sperling R, Eisenbach L, and Rotter V (1997). PACT: cloning and characterization of a cellular p53 binding protein that interacts with Rb. Oncogene 14, 145–155. [DOI] [PubMed] [Google Scholar]
- Su Z, Wu C, Shi L, Luthra P, Pintilie GD, Johnson B, Porter JR, Ge P, Chen M, Liu G, et al. (2018). Electron Cryo-microscopy Structure of Ebola Virus Nucleoprotein Reveals a Mechanism for Nucleocapsid-like Assembly. Cell 172, 966–978 e912. [DOI] [PMC free article] [PubMed] [Google Scholar]
- Towner JS, Khristova ML, Sealy TK, Vincent MJ, Erickson BR, Bawiec DA, Hartman AL, Comer JA, Zaki SR, Stroher U, et al. (2006). Marburgvirus genomics and association with a large hemorrhagic fever outbreak in Angola. J Virol 80, 6497–6516. [DOI] [PMC free article] [PubMed] [Google Scholar]
- Towner JS, Sealy TK, Khristova ML, Albarino CG, Conlan S, Reeder SA, Quan PL, Lipkin WI, Downing R, Tappero JW, et al. (2008). Newly discovered ebola virus associated with hemorrhagic fever outbreak in Uganda. PLoS Pathog 4, e1000212. [DOI] [PMC free article] [PubMed] [Google Scholar]
- Watanabe T, Kawakami E, Shoemaker JE, Lopes TJ, Matsuoka Y, Tomita Y, Kozuka-Hata H, Gorai T, Kuwahara T, Takeda E, et al. (2014). Influenza virus-host interactome screen as a platform for antiviral drug development. Cell Host Microbe 16, 795–805. [DOI] [PMC free article] [PubMed] [Google Scholar]
- Weik M, Modrof J, Klenk HD, Becker S, and Muhlberger E (2002). Ebola virus VP30-mediated transcription is regulated by RNA secondary structure formation. J Virol 76, 8532–8539. [DOI] [PMC free article] [PubMed] [Google Scholar]
- Xu W, Edwards MR, Borek DM, Feagins AR, Mittal A, Alinger JB, Berry KN, Yen B, Hamilton J, Brett TJ, et al. (2014). Ebola virus VP24 targets a unique NLS binding site on karyopherin alpha 5 to selectively compete with nuclear import of phosphorylated STAT1. Cell Host Microbe 16, 187–200. [DOI] [PMC free article] [PubMed] [Google Scholar]
- Xu W, Luthra P, Wu C, Batra J, Leung DW, Basler CF, and Amarasinghe GK (2017). Ebola virus VP30 and nucleoprotein interactions modulate viral RNA synthesis. Nat Commun 8, 15576. [DOI] [PMC free article] [PubMed] [Google Scholar]
- Yamayoshi S, Noda T, Ebihara H, Goto H, Morikawa Y, Lukashevich IS, Neumann G, Feldmann H, and Kawaoka Y (2008). Ebola virus matrix protein VP40 uses the COPII transport system for its intracellular transport. Cell Host Microbe 3, 168–177. [DOI] [PMC free article] [PubMed] [Google Scholar]
Associated Data
This section collects any data citations, data availability statements, or supplementary materials included in this article.
Supplementary Materials
FIGURE S1, related to Figure 3.
Co-immunoprecipitation was performed between flag-RBBP6 and HA-tagged VP30, VP35 and NP.
FIGURE S2, related to Figure 4.
(A) Constructs of RBBP6 and VP30 used for in vitro studies.
(B) Representative gel images of in vitro pull-down assay showing binding to VP30CTD Of RBBP6 peptide 549-573 (left) and lack of binding to VP30CTD by RBBP6 peptide 579-625 (right); M, marker; B, beads; W, wash; I, input; IB, input beads; FB, final beads; E, elution. Green boxes indicate binding and red boxes indicate no binding.
(C) Surface representation of the VP30CTD structure with a 1σ electron density (σA-weighted 2Fo – Fc) mesh for RBBP6 peptide.
(D) Co-IP to assess interaction between HA-VP30 and wild-type or multi-residue mutants of RBBP6 in 559-666aa (DDPGALDA) region.
FIGURE S3, related to Figure 6.
(A) Quantification of western blot images by densitometry of bands in Figure 6B. Percent VP30 levels were plotted relative to scrambled siRNA from two independent experiments. Statistical significance was calculated using Student’s t-test.
(B) Densitometry analysis of VP30 protein levels of bands in Figure 6C. Percent levels were calculated relative to vector control for each VP30 concentration used, from three replicates. Statistical significance was calculated using Tukey’s multiple comparisons test.
(C) Graph representing percent VP30 levels of western blots in Figure 6D, analyzed by densitometry. Percent values were calculated relative to GFP control for each VP30 concentration used, from two replicates. Statistical significance was calculated using Tukey’s multiple comparisons test.
(D) A minigenome assay was performed in the presence of transiently expressed RBBP6 isoform 1 and 3 at two different concentrations: 50 ng and 500 ng.
(E) RBBP6 was over-expressed in the minigenome assay using 5’UTR mutant minigenome as a template that has reduced dependency on VP30 for transcription. Fold activity was calculated relative to no VP35 control.
(F) Reporter activity was measured upon over-expression of GFP fused to peptides derived from NP and RBBP6 at indicated doses. Representative western blots probing levels of VP30 and peptide are shown.
FIGURE S4, related to Figure 6.
(A) 293T cells were co-transfected with HA-VP30 and flag-RBBP6 along with titration of HA-tagged VP35 and NP. Protein levels of VP30, VP35 and NP were analyzed in total cell lysates using indicated antibodies. Relative levels of VP30, VP35 and NP were analyzed by densitometry.
(B) Protein levels of wtVP30 and E197A were analyzed in RBBP6 over-expressed cells. Relative VP30 levels were analyzed by densitometry.
(C) Effect of RBBP6 on minigenome activity was tested using wtVP30 and E197A. Graph represents percent activity values and set relative to vector control.
(D) mRNA levels of wtVP30 and E197A were analyzed in RBBP6 over-expressed cells.
(E) mRNA copies of VP30 and NP were quantified by real-time PCR upon over-expression of RBBP6. Data represent mean ± S.D. from one representative experiment (n= 3). Statistical significance was calculated using Student’s t-test. ****p<0.0001; ***p<0.001, **p<0.01, *p<0.03.
FIGURE S5, related to Figure 7.
(A) Efficacy of RBBP6 knockdown was tested in HeLa cells upon transfection of 5 nM scrambled siRNA or siRNAs targeting RBBP6. Seventy-two hours post-transfection, cellular levels of RBBP6 were analyzed using anti-RBBP6 antibody in the whole cell lysate.
(B) Analysis of mRNA levels of RBBP6 in MDM or HUVEC after indicated siRNA treatments by qRT-PCR.
(C) Infection efficiency after treatment of MDM and HUVEC with indicated siRNA. Cells were treated with siRNA and then challenged with EBOV-GFP at each indicated MOI. Cells were then fixed in formalin at the indicated hour post infection (hpi) and stained for EBOV GP (green) and cell nuclei with Hoechst stain (blue) then imaged by microscopy. The relative number of infected cells for each indicated treatment compared to mock treated cells is indicated ± SD for 3 replicates. ANOVA with Tukey’s multiple comparisons test was used to determine significance.
(D) Representative images of MDM or HUVEC transfected with plasmids encoding GFP-flag or GFP-RBBP6 peptide-flag. Cells were stained with EBOV GP antibody and imaged for both GFP (green) and GP staining (red). Scale bars are 100 μm.
TABLE S1, related to Figures 1-3.
List of host proteins identified by AP-MS with MiST score greater than or equal to 0.75.
TABLE S2, related to Figure 4.
Data collection and refinement statistics for the VP30-RBBP6 peptide structure.
Data Availability Statement
Scored mass spectrometry data files have been uploaded here as Supplemental Table S1. The crystal structure of VP30 bound to the RBBP6 peptide is available for downloading as a PDB file (PDB: 6E5X). All structure analyses were carried out by various programs as implemented in the CCP4 program suite. Final structure figures are prepared using PyMOL.