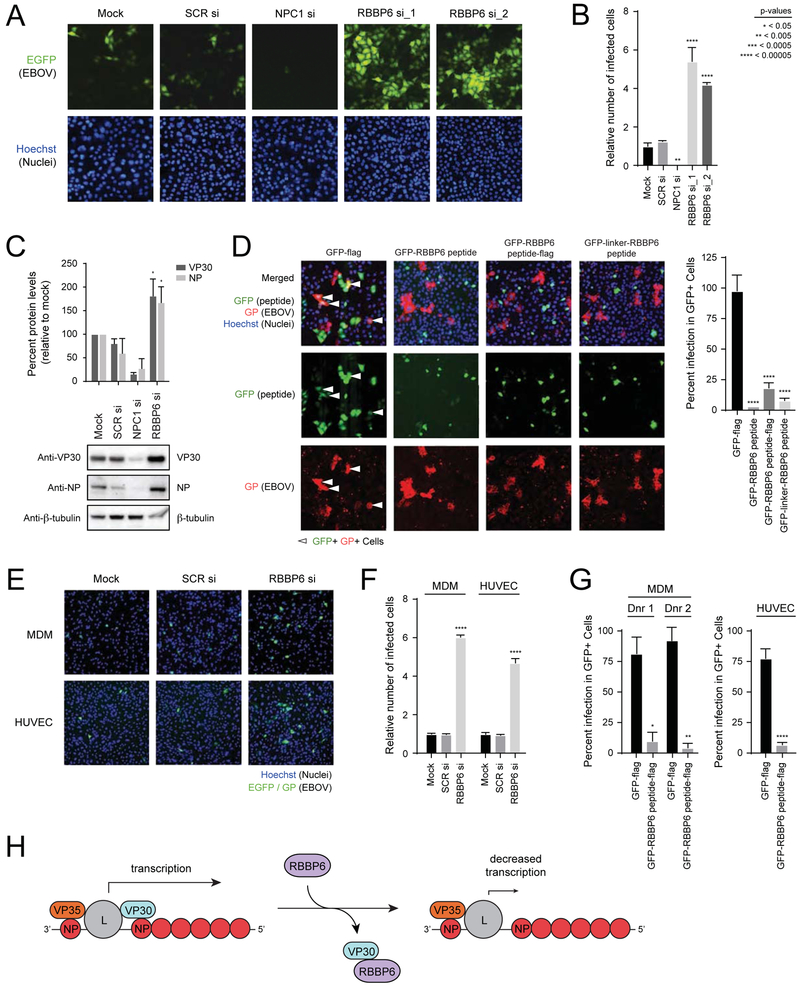
FIGURE 7. RBBP6 restricts Ebola virus replication.
(A) HeLa cells were mock-transfected or transfected with a scrambled siRNA (SCR si) or siRNAs targeting either NPC1 (NPC1 si) or RBBP6 (RBBP6 si_1, RBBP6 si_2). After 48 h, cells were infected with EBOV-EGFP at an MOI of 0.1. Twenty-four hours later, samples were fixed, incubated with Hoechst dye to stain nuclei, and imaged.
(B) The numbers of nuclei and EGFP-positive (infected) HeLa cells were counted using CellProfiler software, and infection efficiencies were determined as the ratio of infected cells to nuclei and shown relative to the infection level seen for the mock control. Mean relative infection efficiencies from three replicates ± SD are shown. Statistical significance was calculated relative to SCR siRNA treated cells using ANOVA with Tukey’s multiple comparisons test. See also Supplemental Figure S5A.
(C) Expression levels of VP30 and NP in EBOV infected HeLa cell lysates upon knockdown of RBBP6 and NPC1. Percent protein levels were calculated relative to mock treated cells from two replicates. Statistical significance was calculated relative to SCR siRNA treated cells using ANOVA with Tukey’s multiple comparisons test.
(D) HeLa cells were transfected with plasmids encoding (i) GFP-flag (ii) GFP-RBBP6 peptide (iii) GFP-RBBP6 peptide-flag (iv) GFP-linker-RBBP6 peptide. Transfected cells were distributed in 7 wells of a 96 well plate. Each well was challenged with EBOV for 24 h followed by Hoechst staining to identify nuclei and staining for viral glycoprotein (GP) to identify infected cells. Images were analyzed by CellProfiler software to quantify the intensity of GP signal. The impact of peptide expression on infection efficiency was measured as the relative infection efficiency seen in cells expressing GFP-flag compared to cells expressing GFP with the indicated RBBP6 peptide constructs. Statistical significance was calculated relative to GFP-flag expressing cells using ANOVA with Tukey’s multiple comparisons test.
(E) Primary cells (MDM and HUVEC) were mock transfected or transfected with scrambled siRNA or siRNA targeting RBBP6, followed by infection with EBOV-EGFP at an MOI=0.04. Twenty-four hours post-infection, cells were fixed, stained and imaged.
(F) The number of infected cells was calculated in MDM and HUVEC siRNA-treated cells and mean infection efficiencies relative to mock treatment from three replicates ± SD are shown. Statistical significance for RBBP6 siRNA treatment was calculated relative to SCR siRNA treated cells using ANOVA with Tukey’s multiple comparisons test. See also Supplemental Figure S5B and C.
(G) MDM from two different donors and HUVEC cells were transfected with plasmids expressing GFP-flag or GFP-RBBP6 peptide-flag, followed by infection with EBOV (MOI=1). Twenty-four hours post-infection, cells were fixed and stained for GP and nuclei (Hoechst dye). The impact of peptide expression on infection efficiency was measured as for (D) and percent infection ± SD values were plotted. Statistical significance was calculated using unpaired Student’s t-test. See also Supplemental Figure S5D.
(H) Model for the inhibition of EBOV replication by RBBP6.

