Abstract
Purpose:
Clinically evaluate a modified surface Goldmann (GAT) tonometer prism for IOP accuracy, repeatability, and safety.
Design:
Prospective, open-label, randomized, controlled, multicenter reference device reliability and validity analysis
Methods:
A GAT and a modified surface GAT prism measured IOP on 173 unique eyes. The study design and analysis complied with FDA 510(k) and ANSIZ80.10–2014 guidelines. All eyes were randomized to IOP measurement by one of 5 standard prisms or 5 modified prisms, each from different manufacturing lot. Pressures were measured by 6-investigators, 2-times with each prism for a total of 1384 IOP measurements. Analysis included Bland-Altman difference accuracy, intra-operator and inter-operator IOP measurement and manufactured lot repeatability.
Results:
Bland-Altman indicated no IOP measurements pairs outside the +/−5mmHg guidelines. Operator and manufactured lot repeatability F-tests and one way ANOVAs indicated no statistical difference between the standard and modified prisms (all p>0.10). The difference in IOP measurements of the standard and modified prisms correlated well to Dresdner CCT correction (p=0.01).
Conclusion:
A modified surface replacement prism is statistically equivalent to a flat-surfaced prism. The modified surface prism indicated statistically significant correction for CCT requiring further testing outside the ANSI standard limits (0.500mm<CCT<0.600mm) to examine its full potential.
Introduction:
For 60 years, the Goldmann Applanation Tonometry (GAT) has been established as the standard for measurement of intraocular pressure (IOP). However, biomechanical variability in corneal thickness, rigidity, curvature, or corneal tear film among patients can lead to numerous errors in the GAT IOP measurement. These additive errors may result in potentially sight threatening conditions in a significant population of patients such as those with glaucoma or undiagnosed ocular hypertension from other causes.1
Data from the Ocular Hypertension Treatment Study (OHTS) first noted that IOP readings tend to be overestimated in thick corneas, while are underestimated in thinner corneas. This error may lead to a misdiagnosis of glaucoma.2 Based upon these findings, the preferred practice has since changed to include a measurement of central corneal thickness (CCT) with a nomogram to adjust the pressure based upon CCT.3,4,5 Additionally, it is recognized that the effects of LASIK surgery and the corneal biomechanical differences found in children render accurate IOP measurement by the GAT problematic.6,7,8,9 Attempts have been made to correct the various error components in GAT measurement to yield a standard IOP reading that is comparable between patients.10,11 However, the process in practice is error prone and cumbersome, leading to almost no clinical adoption by clinicians, with the exception of CCT.
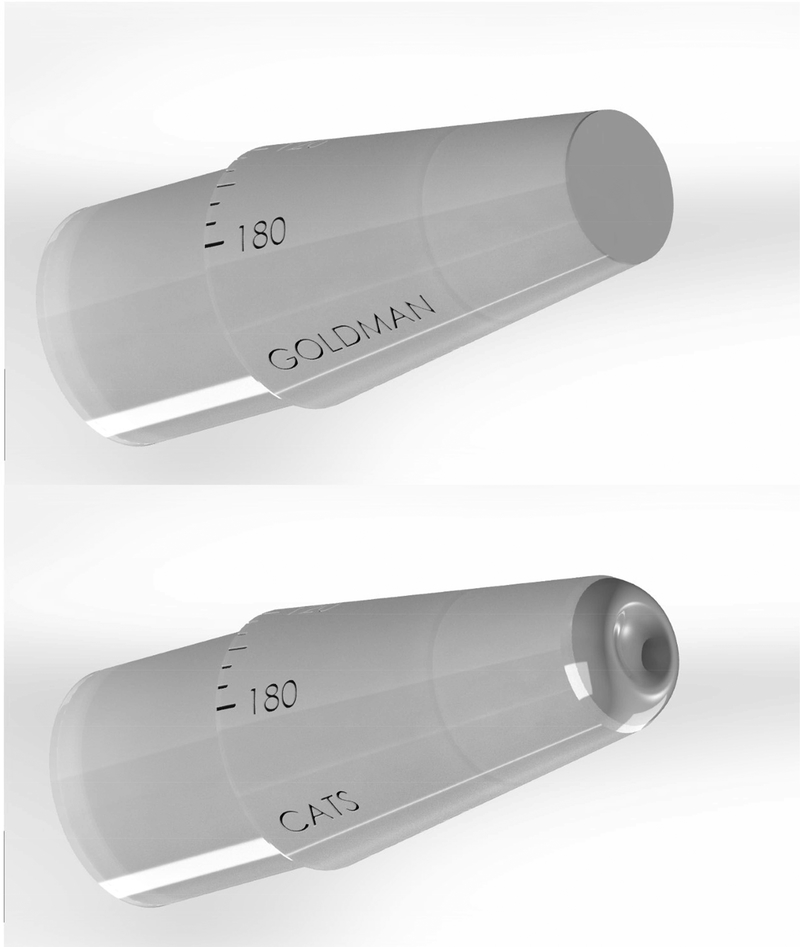
The correcting applanation tonometry surface (CATS) tonometer prism is a modification of the standard Goldmann Applanation Tonometer (GAT) prism. The CATS prism is cleared by the U.S. FDA for the measurement of IOP in applanation tonometers. The only alterations to the original GAT design are the modification of the flat applanating surface to a sinusoidal curved surface and a compensatory lengthening of the prism.10 The compensatory lengthening of the prism was necessary to maintain a zero average bias between the GAT and CATS prisms over a large standard patient population. The zero bias maintains long established GAT IOP bench marks (i.e.- 16mmHg as average normal and 21mmHg as borderline high). The prism was designed to significantly decrease patient IOP dependence on corneal biomechanical and tear-film properties, which is the primary source of individual error. No new materials were introduced in the design process (Figure 1, additional descriptive material at AJO.com). The CATS prism has demonstrated improved IOP accuracy mathematically and by direct GAT comparison, as well as by comparison to transducer intracameral pressure.12,13,14,15,16
Figure 1:
Rendering of the applanating surfaces of the GAT and CATS prisms demonstrating the flat (GAT) verses centrally concave and annularly convex (CATS) prisms. supplemental descriptive material at AJO.com
The CATS prism uses the existing Goldmann measurement armature without recalibration and the clinician measures IOP using the same measurement protocol and techniques as the current GAT prism. Sensitivity to the corneal biomechanical error parameters is reduced by partially matching the negative curvature of the tonometer to positive curvature of the cornea. 12,13,14,15,16 The scientific premise of the CATS tonometer prism is a minimization of the intra-corneal stress during applanation. The reduced intra-corneal stress minimizes the contribution of the corneal deformation to the total force on the prism face thus measuring predominantly the force due to IOP. 12 Simultaneously, the annular outer curvature (away from the cornea) minimizes the tear-film adhesion force and subsequent tear-film error. 12,16
The present study was designed to evaluate the performance accuracy of the CATS prism as compared to the reference GAT tonometer prism in IOP measurement in healthy subjects. The study was designed to comply with ISO 8612:2009, ANSI Z80.10–2014, and Guidance for Industry and FDA Staff Tonometers - Premarket Notification [510(k)] Submissions standards.
Methods:
Healthy adult subjects were enrolled to a series of IOP measurements with the CATS tonometer prism and the GAT prism at a single visit. The study was designed as a prospective, open-labeled, randomized, controlled, multicenter reference device comparison. It was prospectively registered with clinicaltrials.gov under NCT02989909 and prospectively IRB approved with informed consent by Chesapeake IRB. Eligible subjects were screened, enrolled, and evaluated according to the study protocol on the same day (Day 1). Subjects were recruited from two (2) US sites in Arizona. Subjects meeting the inclusion and exclusion criteria, 18 years or older, who provided written informed consent participated in the study.
This clinical study was conducted in accordance with the ethical principles contained within Declaration of Helsinki, Protection of Human Volunteers (21 CFR 50), Institutional Review Boards (21 CFR 56), and Obligations of Clinical Investigators (21 CFR 812).
Description of Study Population:
Healthy adult subjects, including those with refractive errors and high-astigmatism, as well as high IOP subjects were enrolled into the study. The selection of the sample size was based upon ISO 8612:2009, ANSI Z80.10–2014, and Guidance for Industry and FDA Staff Tonometers - Premarket Notification [510(k)] Submissions.
The subjects with the following conditions were excluded from participation in the study: corneal scarring, lid, corneal, or ocular conditions, disease, disorders, or infection that may have confounded the study results, and subjects with uncontrolled systemic disease that in the opinion of the Investigator would put the subject’s health at risk. Additionally, pregnant or nursing women and contact lens wearers were excluded. Ocular surgery within 3 months of enrollment or corneal surgery at any time was prohibited. Furthermore, eyes displaying an oval contact image, or CCT > 0.600 mm or < 0.500 mm were excluded.
Protocol:
Each subject underwent a standard ophthalmic exam by one of six trained and licensed investigators. A Zeiss HD-OCT-5000 spectral domain ocular coherence tomographer (Zeiss, Jena, Germany) was used by the assistant to measure central corneal thickness. Finally, the assistant investigator completed a corneal topography with a Zeiss Atlas model 9000 (Jena, Germany) and a corneal curvature was used for analysis over the central 3mm diameter of the cornea in accordance with ANSI Z80.23. Each investigator conducting IOP measurements was masked to the results of the assistant investigator’s tests. Investigators were also masked to the randomized and alternated use of the CATS and GAT prism. Use of the test or reference device was chosen by random number generator and each subsequent IOP measurement was alternated. Topical anesthetic drops with Fluorescein (fluorescein sodium and benoxinate hydrochloride ophthalmic solution 0.25%/0.4%, Bausch & Lomb, Tampa, FL) were applied prior to each measurement so that examination conditions were equivalent. Measurements were conducted on a daily calibrated Haag-Streit model 900 applanation tonometer armature (Mason, OH) utilizing one of five (5) cleaned and disinfected Haag-Streit standard GAT prisms and alternatively one of five (5) cleaned and disinfected CATS prisms. Measurements of IOP were made two (2) times with the CATS prism (one measurement was considered by averaging measurements at 180 and 90 degrees to correct for astigmatism) and two (2) times with the Goldmann prism (again axis averaged). If the sequential measurements with one prism were more than 2mm Hg different, then a third measurement was obtained. All three measurements were then averaged. The third measurements was included in the study if it was within the range of the first two, otherwise all measurements were discarded. Four measurements were taken (2 with each prism, 4 total) with at least 5 minutes, but no more than 10 minutes, between each measurement.
Test Product:
Five (5) Correcting Applanation Tonometry Surface (CATS) Tonometer prisms from different lot numbers
Control Product:
Five (5) Haag-Streit Goldmann Applanation Tonometer (GAT) prisms from different lot numbers
Objectives:
The primary performance objective of the clinical study was to demonstrate equivalence of the CATS tonometer prism (test) to the GAT tonometer prism (control) in the measurement of IOP.
The secondary performance objective was to assess the operator repeatability of IOP measurement. An exploratory objective was to examine improved IOP accuracy in accordance with expected standard Dresdner CCT correction for IOP.
Endpoints:
The primary performance endpoint was accuracy of IOP measurement readings, as measured by applanation tonometry. The success criteria for the primary endpoint was that no more than 5% of the paired differences between the reference tonometer (GAT prism) and the test tonometer (CATS prism) readings would be greater than ANSI Z80.10–2014 prescribed tolerance levels (Table 1).
Table 1–
ANSI Z80.10–2014 IOP measurement category tolerance levels demonstrating substantial equivalence.
| Intraocular Pressure Measurement Category Tolerances for Demonstrating Paired Difference Substantial Equivalence | |
|---|---|
| IOP range (mmHg) | Tolerance of paired differences (mmHg) |
| 7 to 16 | ± 5 |
| >16 to < 23 | ± 5 |
| >23 | ± 5 |
Intraocular pressure measurements were taken from participating subjects, using the CATS tonometer prism and the Goldmann applanation tonometer (GAT) prism. Enrollment continued until a minimum of 40 eligible eyes were identified in each of the pre-specified IOP range categories as defined by ISO 8612:2009 and ANSI Z80.10–2014. At least 10 highly astigmatic eyes (>3 D of corneal astigmatism) were required in each of the low (7–16 mmHg), medium (>16 to <23 mmHg), and high (≥23 mmHg) IOP ranges in the study.
Statistical Methods:
The Full Analysis Set (FAS) was the primary analysis set for the analysis of the effectiveness endpoint and the safety data. All eligible eyes were included in the FAS.
Descriptive statistics were provided on continuous variables including mean, standard deviation, median, and range. An assessment of change from baseline was provided for IOP, using two-sided CIs and α = 0.05 or one-sided CIs and α = 0.025. The primary endpoint was analyzed per the ANSI Z80.102014 using a total least square regression (TLSR) as well as a Bland-Altman type paired differences analysis according to the above table.
For the secondary performance endpoint, a homoscedastic, 2-tailed t-test (α = 0.05) was performed as well as an analysis of variance (ANOVA) to determine the variance between the individual operator readings and collective readings. Furthermore, a student’s t-test and ANOVA were completed for the analysis of difference in means between the CATS and GAT measurements within individual operators. Finally, a linear regression analysis of the difference in paired GAT and CATS IOP measurements was correlated to CCT.
Results:
One hundred seventy-three (173) eyes were measured. There were 139 eyes in the low (< 3 D) astigmatism group and 34 eyes in the high astigmatism (>3 D) group. The analysis included 170 unique eyes (Table 2). The only subset which included repeat measurements was the group which required both high astigmatism (> 3 diopters) and high IOP (≥23 mmHg). This group included 8 unique eyes for a total of 11 separate measurements to meet the required 10 measurements in this category per ANSI Z80.10 2014. Measurements within all groups were completed in accordance with the ANSI Z80.10– 2014 guidelines. There were 60 (36%) males and 110 (64%) females who completed the study. The average age was 58.0 +18.6 years. There was no outlier data in the paired difference primary effectiveness described in table 3 and as defined by ANSI A80.10–2014.
Table 2:
Table of quantities of individual measurements in each category.
| Intraocular Pressure Measurements in each Pressure and Astigmatism Category | ||||
|---|---|---|---|---|
| INDIVUAL MEASUREMENTS: Astigmatism\IOP: |
Low(≤16mmHg): | Med(>16 to <23mmHg): | High(≥23mmHg): | Total: |
| Low (<3D): | 42 | 57 | 40 | 139 |
| High (≥3D): | 13 | 10 | 11 | 34 |
| Total: | 55 | 67 | 51 | 173 |
Table 3:
Summary of Effectiveness Objectives, Endpoints, and Statistical Methods
| Objective | Endpoint | Methods and Summary Statistics Used for Analysis |
|---|---|---|
|
Primary:
To demonstrate equivalence of the CATS tonometer prism to the GAT prism in the measurement of IOP. |
Primary:
Accuracy of IOP measurement: No more than 5% of the paired differences between the reference GAT tonometer (Goldmann prism) and the test tonometer (CATS prism) readings for each pressure range, are greater than the tolerance level of ±5 mmHg. |
Primary:
Descriptive statistics including mean, SD, median, min, and max, using 95% CI, and α = 0.05. Scatter plots of the test and reference measurements as well as Bland-Altman paired difference analysis. |
|
Secondary:
To assess the interoperator reliability of IOP measurement interpretation. |
Secondary:
Repeatability of IOP measurement compared to GAT found statistically equivalent. |
Secondary:
Summary statistics of the individual and overall measurement variations, t-test, F test, one way ANOVA and a GLME analysis. |
|
Exploratory:
CATS-GAT Correction Correlation to CCT |
Exploratory:
CATS CCT corrected IOP measurement similar to std. GAT correction. |
Exploratory:
Descriptive statistics of test minus reference measurements. |
Accuracy of IOP (Primary Effectiveness Endpoint)
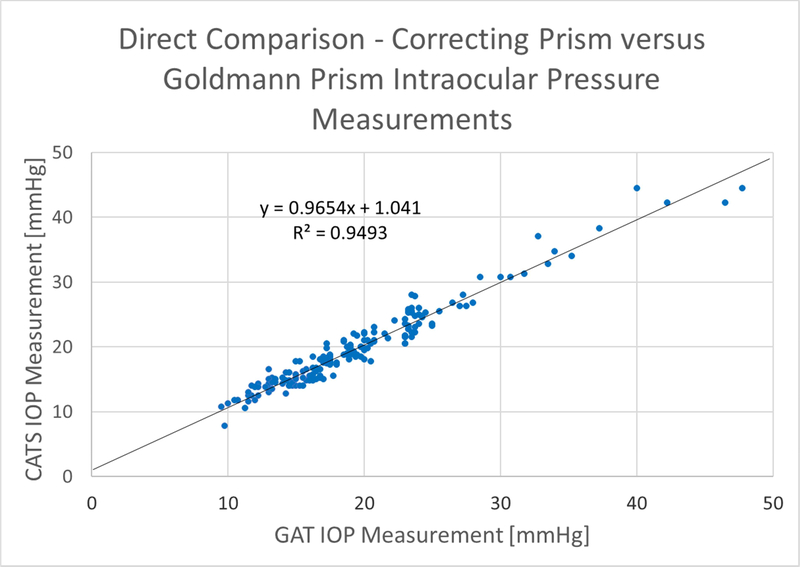
Figure 2 shows the CATS vs. GAT prism scatter-plot of all data according to FDA Tonometer Guidelines section 5a: (Scatter Plot of Measured IOP Values). It includes the regression line slope, intercept, and correlation coefficient. The scatterplot indicates excellent correlation between the CATS and GAT IOP measurements throughout the useful range of measurement IOPs with a correlation coefficient of R2 = 0.95, Slope = +0.97, and y-intercept of +1.04.
Figure 2:
Scatter plot of the average IOP values from each of the 173 measurements for GAT and CATS prisms along with a reference y=x line
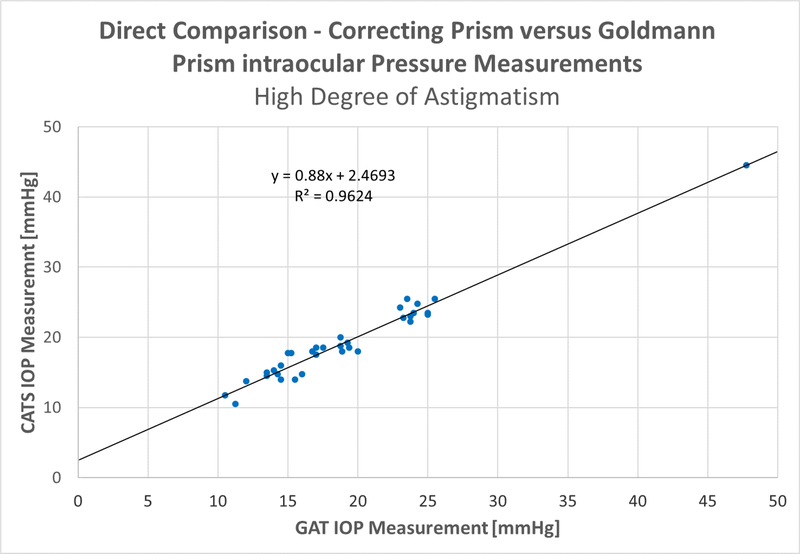
The subgroups of low (<3 D) astigmatism and high (>3 D) astigmatism are broken out in figure 3, below. The (<3 D) astigmatism group indicates a correlation coefficient of R2=0.95, with a slope of +0.99 and a Y-intercept of +0.68. The (>3 D) astigmatism sub-group shows a correlation coefficient of R2=0.96, with a slope of +0.88 and a Y-intercept of +2.47. Both the high and low astigmatism groups indicated an excellent correlation between CATS and GAT IOP measurements meeting the primary study endpoint.
Figure 3A & B:
Scatter plots for the A- low astigmatism (<=3 diopters) and B- high astigmatism groups (>3diopters)
The subgroups of low (<3 D) astigmatism and high (>3 D) astigmatism are broken out in figure 3, below. The (<3 D) astigmatism group indicates a correlation coefficient of R2=0.95, with a slope of +0.99 and a Y-intercept of +0.68. The (>3 D) astigmatism sub-group shows a correlation coefficient of R2=0.96, with a slope of +0.88 and a Y-intercept of +2.47. Both the high and low astigmatism groups indicated an excellent correlation between CATS and GAT IOP measurements meeting the primary study endpoint.
The Bland-Altman Type Plot in figure 4 shows the paired differences to the average IOP between the CATS and GAT according to ANSI Z80.10–2014 Section 4.2.1 Table 1. The (<=3 D) astigmatism group indicates a mean difference of +0.41+/−1.49mmHg(+/−1 S.D.). The (>3 D) astigmatism sub-group shows a mean difference of +0.18+/−1.43mmHg(+/−1 S.D.). All paired measurement differences reside within the +5mmHg tolerance given in Table 1 in both groups and satisfy the ANSI requirement on the paired testing of reference tonometer with test tonometers. A separate analysis of paired differences in the IOP range between 25–35 was completed and shown to be statistically equivalent by paired t-Test (p=0.28).
Figure 4A & B:
Bland-Altman Type Plot, A- low astigmatism (<=3 diopters) and B- high astigmatism (>3diopters).
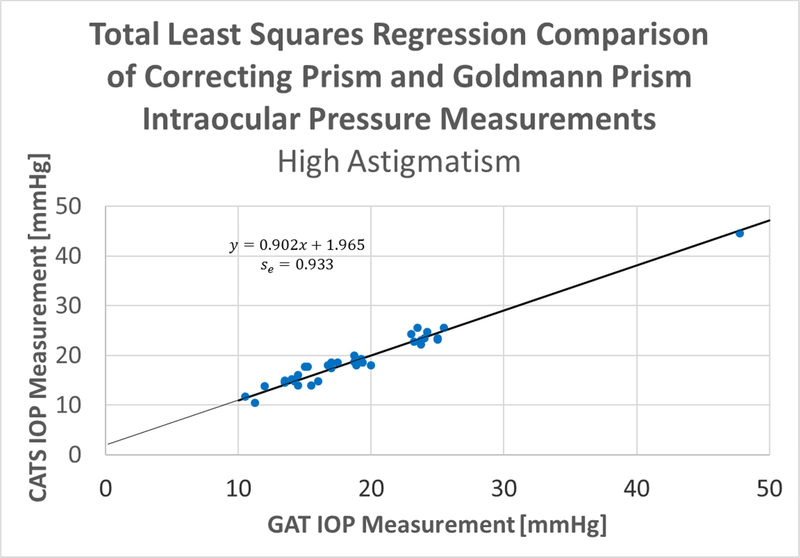
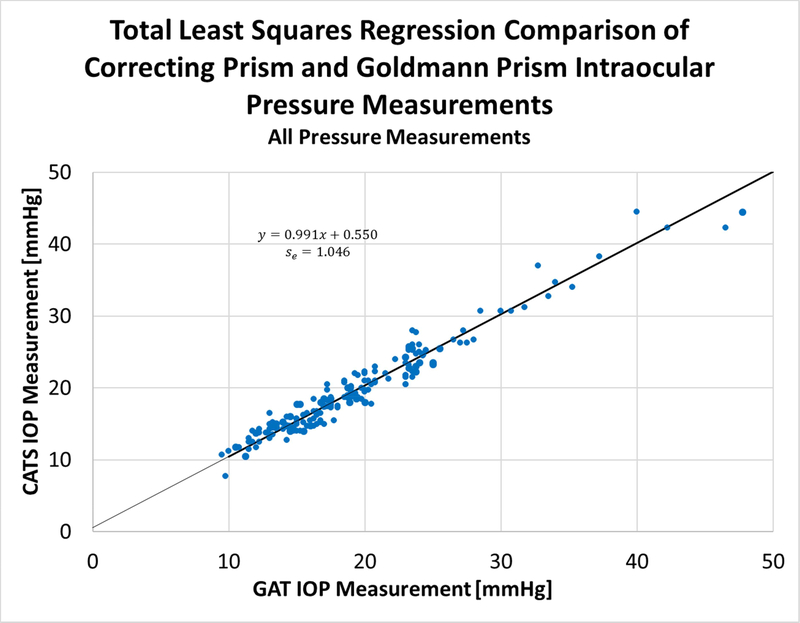
The Total Least Squares (TLS) Regression fit of the CATS average values against the GAT average values results in the TLS fit shown are shown separately in both the high (>3 D) and low (<=3 D) astigmatism categories in Figure 5.
Figure 5A & B:
Total Least Squares (TLS) regression of CATS average values against GAT average values, A- low (<= 3 D) and B- high (>3 D) astigmatism.
The slope of the low (<3 D) astigmatism TLS regression is +1.02, the offset of the regression is +0.11 mmHg, and the standard error of the regression is 1.03 mmHg (Figure 6). The slope of the high (>3D) astigmatism TLS regression is +0.90, the offset of the regression is +1.96 mmHg, and the standard error of the regression is 0.93 mmHg. The results support the primary endpoint of the study and indicate statistical equivalence between the CATS and GAT prisms satisfying ANSI Z80.10–2014 4.2.2: Total Least Squares Regression, in both high and low astigmatism groups.
Figure 6:
Total Least Squares (TLS) regression of CATS average values against GAT average values, all tested eyes, combined astigmatism groups.
The slope of the combined astigmatism group regression is +0.99, the offset of the regression is +0.55 mmHg, and the standard error of the regression is 1.04 mmHg. The combined astigmatism groups’ TLSR confirms the statistical equivalence between the CATS and GAT prisms.
Repeatability of IOP (Secondary Effectiveness Endpoint)
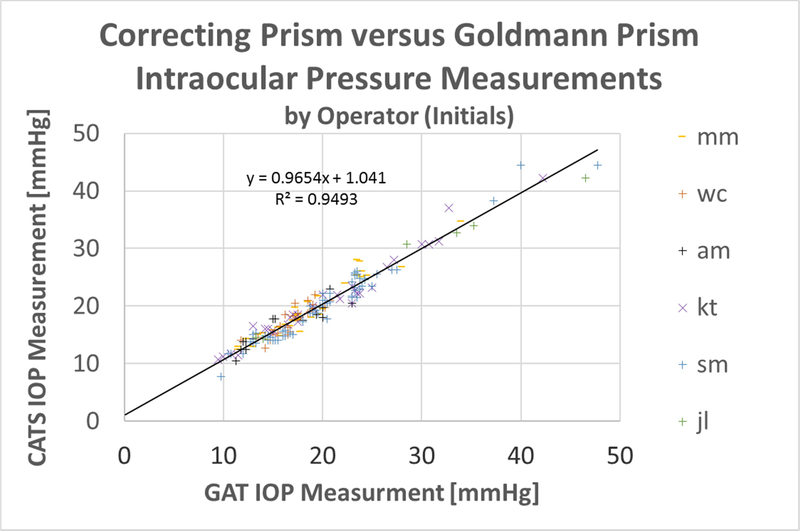
Figure 7 shows the scatter plot with the markers colored by the operator – person performing the measurement. The spread of operators across the GAT average IOP Value shows little visual indication of tonometer operator bias between the CATS and GAT prisms.
Figure 7:
Scatter plot of average IOP measurements, colored by operator performing measurement (noted by initials).
Intra-Operator Measurement Repeatability
Each IOP measurement consisted of two separate measurements with the CATS and the GAT prisms. A two-sample t-test on the mean IOP examining intra-operator IOP measurement repeatability produced a p-value of 0.524. Therefore, at the 5% significance level, there is no significant difference in repeatability between the CATS and GAT prisms.
A two-sample F-test on the standard deviation examining intra-operator IOP measurement repeatability produced a p-value of 0.132. Therefore, at the 5% significance level, there is no significant difference in repeatability between the CATS and GAT prisms.
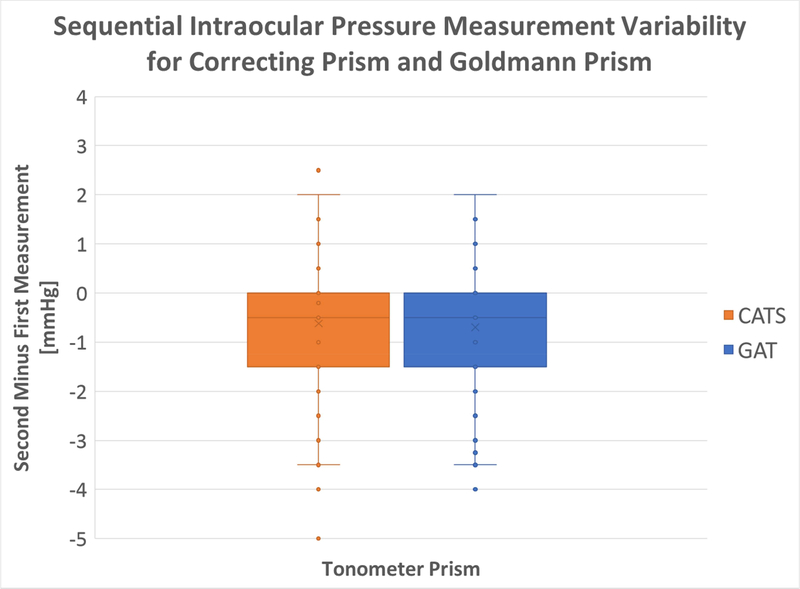
Each of the 173 lines of measurement consisted of 2 GAT measurements and 2 CATS measurements. A statistical analysis examined the difference (delta) between the first and second measurements with both the CATS and GAT prisms. The variances were found to be almost identical as shown in the box plot in figure 8 below.
Figure 8:
Difference in First Measurement from Second Measurement using GAT and CATS tonometer prisms
Inter-Operator IOP measurement repeatability
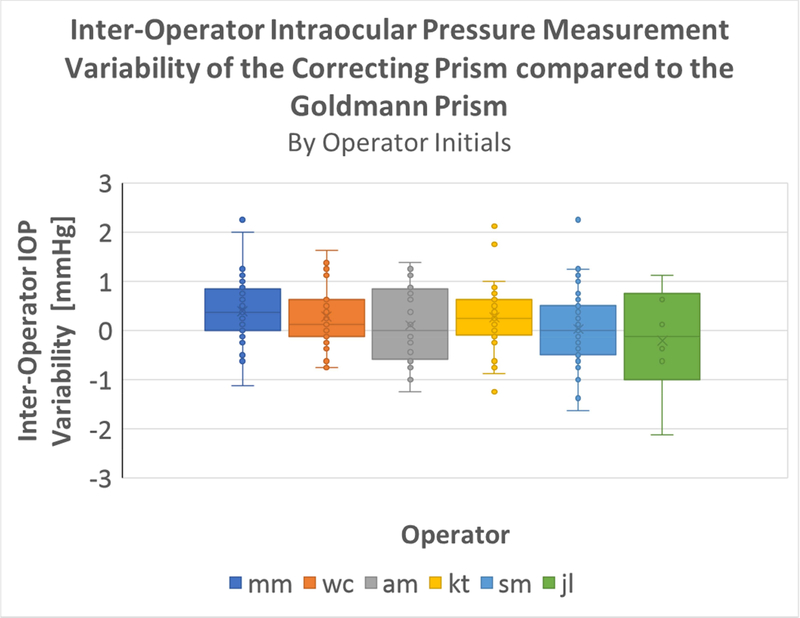
Each of the 173 lines of measurements were performed by 1 of 6 operators where each line consists of 2 GAT measurements and 2 CATS measurements.
The means for variability in paired IOP measurement for all individual operators were compared, using a one-way ANOVA (α=0.05 significance level). The observed difference in inter-operator variability was not statistically significant (p = 0.1487), indicating no significant inter-operator variability in the measurement of IOP with the CATS prism (figure 9).
Figure 9:
One-Way ANOVA for Inter-Operator Variability ANOVA and boxplot outputs
The one-way ANOVA was performed on the differences of the CATS IOP readings from the GAT IOP readings. In other words, the ANOVA assumes the GAT reading to be the true IOP of the eye and measures only the variance for the CATS IOP readings. It should be noted, however, that this is a very conservative statistical comparison. The GAT devices themselves have some error in measurement. From the perspective of the one way ANOVA, the effects of the GAT inter-operator variability are observed as solely the effects of the CATS inter-operator variability. Even with this conservative approach the CATS prism is not statistically different than the GAT prism. Considering the infeasibility of a third true intracameral IOP measurement comparison, this approach was determined to be most appropriate and robust in analyzing inter-operator variability.
Lot Number Variability
The means for variability in IOP measurement for all CATS prism manufactured lot numbers were compared, using a one-way ANOVA (α=0.05 significance level). The observed difference (figure 10) in inter-operator variability was not statistically significant (p = 0.090), indicating no significant lot number variability in the measurement of IOP with the CATS prism.
Figure 10:
One-way ANOVA boxplot of IOP Measurements versus CATS Lot Number.
In a like-wise fashion to the inter-operator variability above, a one-way ANOVA was performed on the differences in the CATS and GAT IOP readings for lot number variability. Again, this assumes the GAT reading to be the true IOP and is a very conservative statistical comparison. Even with this conservative approach the CATS prism is not statistically different than the GAT prism in regard to lot number repeatability.
Analysis of Safety
There were no unanticipated adverse events (AEs) in the study. (Table 4)
Table 4:
Summary of Safety
| Objective | Endpoint/Criteria for Success | Outcome |
|---|---|---|
| To demonstrate equivalence of the CATS tonometer prism to the GAT prism in the measurement of IOP. | Incidence of AEs | The rate of any AE Type was 0.0% |
Supplemental Analysis (Exploratory Endpoint)
The paired IOP measurement difference in CATS and GAT prisms was calculated and correlated to central corneal thickness (CCT). The subject’s average CCT was 551+/− 24μm which was restricted in the protocol to between 500 and 600μm. The results shown in Figure 11 indicate a negative GAT correction slope of −0.023 mmHg/μm for CCT. The mean IOP with the CATS prism was 19.8 mmHg compared to 19.5 mmHg with the Goldmann. The CATS prism reduced the IOP error due to CCT by +/−1.7mmHg over the GAT prism, which compares well to the published Dresdner GAT error over this same range of CCT values.17 The correlation coefficient associated with CCT was statistically significant (p=0.01) indicating good correlation between the difference in IOP between the CATS and GAT prisms over the range of corresponding CCT values (R2=0.14).
Figure 11:
Measured IOP difference between CATS minus GAT correlated to study limited CCT (500μm<CCT<600μm), 95% CI on average mean difference and slope indicated by dashed lines.
CONCLUSIONS
The CATS prism had no statistically significant difference in IOP measurement during assessment from the reference GAT prism according to ANSI Z80.10 2014 and the FDA tonometer guidelines for 510(k) submission standards. There were no adverse events or device failures.
The IOP measurement assessment included a robust analysis of inter-operator and intra-operator repeatability as well as manufacture lot repeatability. The study examined the clinical accuracy, repeatability, and safety of CATS tonometer prism, compared to the reference GAT tonometer prism, and provided statistical evidence that the CATS prism is as accurate, repeatable, and safe as the GAT prism. Although the CATS and GAT tonometer prisms where statistically equivalent in the low, medium, and high ranges of IOP, the sample size was insufficient to substantiate equivalence in those subjects with pressures less than or equal to 10mmHg and greater than 35mmHg.
Measurement variability assessment was limited due to the number of possible repeat measurements on a given subject due to anesthetic corneal toxicity. A previously completed cadaver eye study demonstrating statistical equivalence was better suited to assess intra-operator and same eye inter-operator measurement variability. 15
The clinical study indicates a significant reduction in CATS prism sensitivity to CCT which is a recognized corneal biomechanical error in GAT IOP measurement.18 The results verify the previously published mathematical modeling, direct CATS/GAT comparisons and intracameral IOP comparisons examining the difference between CATS and GAT measurements when correlated to corneal thickness.12,13,14,15,16 There are several other tonometers which have been compared to GAT to demonstrate substantial equivalence for FDA clearance. Since the scope of this study was a direct comparison to the GAT reference tonometer and the CATS prism is simply a replacement part for the GAT, no comparison to other tonometers was completed. Although previous studies on the CATS prism did show statistically significant CATS minus GAT IOP correlation to corneal hysteresis and corneal resistance factor measured by an Ocular Response Analyzer (ORA- Reichert, Depew, NY). 13,15
The present study was limited by the protocol to healthy eyes with nominal CCTs between 500 and 600μm. An additional study examining those patients with CCTs greater than 600μm and less than 500 μm is underway. Future studies in pediatric patients will examine CATS prism and GAT prism IOP measurements compared to intracameral pressure. Another planned study will be conducted on patients before and after a LASIK refractive procedure. These two populations, which together comprise nearly 30% in the United States, could benefit greatly from improved IOP accuracy. 19
Lastly, a study is underway comparing the difference in CATS and GAT IOP measurements in keratoconus patients both before and after a corneal cross-linking procedure. The difference in CATS and GAT IOP measurement is in effect a population standardized measurement of the corneal contribution to applanation IOP. The CATS minus GAT difference is predominantly a measurement of the biomechanical “bendability” of the cornea, which is a combined effect of corneal thickness and corneal rigidity or modulus of elasticity. Therefore, we can use this difference in CATS/GAT IOP to measure procedurally induced corneal biomechanical changes in live human eyes.
Supplementary Material
Acknowledgements/Disclosure:
A. Funding/Support:
This study was supported in part by NIH SBIR Grant R43 EY026821–01 and Arizona Eye Consultants, Tucson, AZ.
B. Financial Disclosures:
Sean McCafferty has an interest in Intuor Technologies (Tucson, AZ) which owns the technology being examined in this clinical trial. Additional grant support unrelated to this study has been provided by Abbott Medical Optics (Santa Ana, CA), and Alcon, Inc.(Ft. Worth, TX).
Jason Levine has unrelated study grant support from Innfocus, Inc.
All other authors have no competing interests.
C. Other Acknowledgements:
Arizona Eye Consultants, Tucson, AZ for extensive facilities use.
List of Abbreviations:
- GAT
Goldmann applanation tonometer
- IOP
Intraocular Pressure
- CATS
Correcting applanation tonometry surface
- CCT
Central Corneal Thickness
- FDA
Food and Drug Administration
- AE
Adverse Event
- TLSR
Total Least Squared Regression
- ANSI
American National Standards Institute
- ISO
International Standards Organization
- CFR
Code of Federal Regulations
Footnotes
Ethics and consent to participate:
This clinical study was conducted in accordance with the ethical principles contained within Declaration of Helsinki, Protection of Human Volunteers (21 CFR 50), Institutional Review Boards (21 CFR 56), and Obligations of Clinical Investigators (21 CFR 812).
Supplemental Material available at AJO.com
Publisher's Disclaimer: This is a PDF file of an unedited manuscript that has been accepted for publication. As a service to our customers we are providing this early version of the manuscript. The manuscript will undergo copyediting, typesetting, and review of the resulting proof before it is published in its final citable form. Please note that during the production process errors may be discovered which could affect the content, and all legal disclaimers that apply to the journal pertain.
Contributor Information
Sean McCafferty, Arizona Eye Consultants, Intuor Technologies, 6422 E. Speedway Blvd. Tucson, AZ 85710 (520) 327-3487 SJMccafferty66@hotmail.com.
Kyle Tetrault, Denver Eye Surgeons, 13772 Denver West Parkway Bldg. 55 Suite 100 Lakewood, CO 80401 (303) 279-6600 TetraultOD@gmail.com.
Ann McColgin, Cornea Associates, 6422 E. Speedway Blvd. Tucson, AZ 85710 (520) 325-9400 AZMccolgin@me.com.
Warren Chue, Arizona Eye Consultants, 395 N. Silverbell Rd. Tucson, AZ 85745 (520) 791-7401 wsachue@gmail.com.
Jason Levine, Arizona Eye Consultants, 6422 E. Speedway Blvd. Tucson, AZ 85710 (520) 327-3487 Jlevine46@comcast.net.
Melissa Muller, Arizona Eye Consultants, 395 N. Silverbell Rd. Tucson, AZ 85745 (520) 791-7401 drmuller@arizonaeyeconsultants.com.
References
- [1].Susanna JR, De Moraes CG, Cioffi GA, Ritch R. Why do people (still) go blind from glaucoma? Trans Vis Sci Tech 2015;4(2):1. [DOI] [PMC free article] [PubMed] [Google Scholar]
- [2].Kass M, Heuer D, Higginbotham E, Johnson C, Keltner J, Miller J, Parrish R, Wilson M, Gordon M. The Ocular Hypertension Treatment Study: a randomized trial determines that topical ocular hypotensive medication delays or prevents the onset of primary open-angle glaucoma. Arch Ophthalmol. 2002;120:701–13 [DOI] [PubMed] [Google Scholar]
- [3].Lester M, Mete M, Figus M, Frezzotti P. Incorporating corneal Pachymetry into the management of glaucoma. J Cataract Refract Surg 2009;35(9):1623–8 [DOI] [PubMed] [Google Scholar]
- [4].Kotecha A, Elsheikh A, Roberts C, Haogang Z, Garway-Heath D. Corneal thickness- and Age Related Biomechanical Properties of the Cornea Measured with the Ocular Response Analyzer. Invst Ophthalmol Vis Sci 2006;47:5337–47 [DOI] [PubMed] [Google Scholar]
- [5].Whitacre M, Stein R. Sources of error with use of Goldmann-type tonometers. Surv Ophthalmol 2002;38(1):1–30 [DOI] [PubMed] [Google Scholar]
- [6].Schallhorn J, Schallhorn S, 0u Y Factors that Influence Intraocular Pressure Changes after Myopic and Hyperopic LASIK and Photorefractive Keratectomy: A Large Population Study. Ophthalmol 2015;122(3):471–79 [DOI] [PubMed] [Google Scholar]
- [7].Tsai A, Loon S. Intraocular pressure assessment after laser in situ keratomileusis: a review. Clin & Exper Ophthal. 2012;40:295–304 [DOI] [PubMed] [Google Scholar]
- [8].Beck A, Giangiacomo A. Pediatric glaucoma: review of recent literature. Curr Opin Ophthalmol 2017;28(2):199–203 [DOI] [PMC free article] [PubMed] [Google Scholar]
- [9].Feng C, Jin K, Yi K, Choi D. Comparison of Intraocular Pressure Measurements Obtained by Rebound, Noncontact, and Goldmann Applanation Tonometry in Children. Am J Ophthalmol 2015:160;937–43 [DOI] [PubMed] [Google Scholar]
- [10].Damji K, Muni R, Munger R. Influence of corneal variables on accuracy of intraocular pressure measurement. J Glaucoma, 2003;12(1):69–80 [DOI] [PubMed] [Google Scholar]
- [11].Liu J, Roberts C. Influence of cornea biomechanical properties on intraocular pressure measurement: Quantitative analysis. J Cat and Ref Surg 2005;31(1):146–155 [DOI] [PubMed] [Google Scholar]
- [12].McCafferty S, Lim G, Duncan W, Enikov E, Schwiegerling J. Goldmann Tonometer Prism with an Optimized Error Correcting Applanation Surface. Transl Vis Sci Technol 2016;5:1–5 [DOI] [PMC free article] [PubMed] [Google Scholar]
- [13].McCafferty S, Lim G, Duncan W, Enikov E, Schwiegerling J. Goldmann Tonometer Error Correcting Prism: Clinical Evaluation. Clin Ophthalmol. 2017;11:835–40 [DOI] [PMC free article] [PubMed] [Google Scholar]
- [14].McCafferty S, Levine J, Schwiegerling J, Enikov E. Goldmann applanation tonometry error relative to true intracameral Intraocular pressure in vitro and in vivo. BMC Ophthalmol 2017;17:215. [DOI] [PMC free article] [PubMed] [Google Scholar]
- [15].McCafferty S, Levine J, Schwiegerling J, Enikov ET. Goldmann and Error Correcting Tonometry Prisms Compared to Intracameral Pressure. BMC Ophthalmol 2018;18:2. [DOI] [PMC free article] [PubMed] [Google Scholar]
- [16].McCafferty S, Enikov E, Schwiegerling J, Ashley S. Goldmann tonometry tear-film error and partial correction with a shaped applanation surface. Clin Ophthal 2018;1:71–8 [DOI] [PMC free article] [PubMed] [Google Scholar]
- [17].Kohlhaas M, Boehm AG, Spoerl E, Pursten A, Grein HJ, Pillunat LE. Effect of central corneal thickness, corneal curvature, and axial length on applanation tonometry. Arch Ophthalmol 2006; 124(6):471–6 [DOI] [PubMed] [Google Scholar]
- [18].Prum B, Rosenberg L, Gedde S, Mansberger S, Stein J, Moroi S, Herndon L, Lim M, Williams R. American Academy of Ophthalmology. Preferred Practice Pattern; Primary Open-Angle Glaucoma 2015. 10.1016/j.ophtha.2015.10.053 Accessed August 7, 2018 [DOI]
- [19].Eisenberg D, Sherman B, Mckeown C, Schuman J. Tonometry in Adults and Children: A manometric evaluation of pneumotonometry, applanation, and tonopen in vitro and in vivo. Ophthalmol 1998;105:1173–81 [DOI] [PubMed] [Google Scholar]
Associated Data
This section collects any data citations, data availability statements, or supplementary materials included in this article.


