

Abstract
Background:
Outcomes for pancreatic resection have been studied extensively due to the high morbidity and mortality rates, with high-volume centers achieving superior outcomes. Ongoing investigations include healthcare costs given the national focus on reducing expenditures. Therefore, we sought to evaluate the relationships between pancreatic surgery costs with perioperative outcomes and volume status.
Methods:
We performed a retrospective analysis of 27,653 patients who underwent elective pancreatic resections from 10/2013–6/2017 using the Vizient database. Costs were calculated from charges using cost-charge ratios and adjusted for geographic variation. Generalized linear modeling adjusting for demographic, clinical, and operation characteristics was performed to assess the relationships between cost and length of stay (LOS), complications, in-hospital mortality, readmissions, and hospital volume. High-volume centers were defined as hospitals performing ≥19 operations annually.
Results:
The unadjusted mean cost for the pancreatic resection and corresponding hospitalization was $20,352. There were no differences in mean costs for pancreatectomies performed at high- and low-volume centers (-$1,175, 95%CI -$3,254-$904, p=0.27). In subgroup analysis comparing adjusted mean costs at high- and low-volume centers, there was no difference among patients without an adverse outcome (-$99, 95%CI -$1,612–1,414, p=0.90), with ≥1 adverse outcomes (-$1,586, 95%CI -$4,771–1,599, p=0.33), or with ≥1 complications (-$2,835, 95%CI -$7,5881,919, p=0.24).
Conclusion:
While high-volume hospitals have fewer adverse outcomes, there is no relationship between surgical volume and costs; this suggests that surgical volume is not an indicator in itself of improved healthcare efficiency reflected by lower costs. Patient referral to high-volume centers may not reduce overall healthcare expenditures for pancreatic operations.
Keywords: pancreatic surgery, cost, complications, hospital volume, mortality
Introduction
With healthcare costs continually rising in the United States (US), research on this topic has become increasingly important. Surgical expenditures alone are expected to increase by approximately 60% and represent 7% of the US gross domestic product by 2025.1 Therefore, the primary goal of healthcare costs-related research is to determine modifiable measures that may be employed by hospitals and physicians to reduce costs, while maintaining and/or improving the quality of care provided.2–4 Pancreatic surgeries are complex operations associated with high morbidity and mortality.5 Although relatively uncommon procedures, pancreatic resections have been studied extensively in health care outcomes research as a model system for informative analysis that may be more broadly generalizable to other surgical procedures.
Hospital volume has consistently been identified as a reliable predictor of perioperative outcomes for pancreatic resections.5,6 Although definitions have varied with the threshold for high-volume center designation consisting of performing from 10 to 54 pancreatic resections annually, high-volume centers have consistently demonstrated improved outcomes with respect to hospital length of stay (LOS), morbidity, and perioperative mortality.6–9 However, the impact of hospital volume on healthcare costs for pancreatic surgery has not been well established despite evidence suggesting that postoperative complications, increased LOS, and failure to rescue are significant contributors to greater healthcare costs.10,11 Furthermore, recent evidence suggests that the gap in the rates of both complications and mortality has been narrowing, potentially mitigating the impact of perioperative outcomes on costs of high-risk surgical procedures.12,13 The objective of this study was to expand on previous research and investigate the relationship between the costs of the pancreatic surgery with hospital volume and perioperative outcomes, hypothesizing that high-volume centers would be associated with lower costs due to fewer complications and shorter LOS.
Methods
The research protocol was approved by the University of California, Davis Institutional Review Board. We performed a retrospective analysis of patients with benign and malignant disease who underwent elective pancreatic resections from October 1, 2013 to June 30, 2017 using the Vizient (previously University HealthSystem Consortium) database. The Vizient database consists of hospital- and patient-level administrative data collected from more than 200 medical centers across the US and has been previously validated as a reliable data source to examine pancreatic surgery outcomes and healthcare costs.14–16 Patient hospitalizations for partial pancreatic resection were selected from International Classification of Disease Ninth and Tenth edition (ICD-9 & ICD-10) procedure codes (ICD-9: 52.51, 52.52, 52.53, 52.59, 52.7; ICD-10: 0FBG0ZZ, 0FBG3ZZ, 0FBG4ZZ). Total pancreatectomies were not included to improve cohort homogeneity, as they represented only 5% of pancreatic operations with higher complication rates and LOS compared to partial pancreatic resections.17,18 Patients ≤18 years of age and non-elective operations were excluded. The final cohort consisted of 27,653 patients treated at 180 hospitals.
Patient demographics, principal diagnosis, medical comorbidities, severity of illness scores, and principal payer were abstracted from Vizient. Severity of illness scores were created by 3M health information systems based on diagnosis related groups (DRGs) present on admission to measure physiologic decompensation or organ system loss of function. The Elixhauser comorbidity index (ECI), a validated measure of mortality risk from administrative databases based on 29 diagnoses, was used to assess patient comorbidities.19–21 High-volume centers were defined as hospitals performing ≥19 partial pancreatectomies annually. This cut-off was determined based on previous research22 and sequential regression analyses of this study’s cohort finding that ≥19 pancreatectomies had the optimal fit (R2) for complications and in-hospital mortality outcomes.
Perioperative complications were identified from ICD-9 and ICD-10 codes for the index hospitalization and included standard complications (i.e. stroke, pulmonary failure, pneumonia, gastrointestinal hemorrhage, surgical site/organ space infections, myocardial infarction, cardiac arrest, pulmonary embolism, deep vein thrombosis, and systemic shock),23 in addition to clostridium difficile enteritis, delayed gastric emptying, gastro/enterocutaneous fistula, and bile leak. Pancreatic fistula was not included as ICD-9 and ICD-10 lacks a specific code for this complication. Prolonged LOS was defined as LOS for the index hospitalization >75th percentile, which was >10 days.24 In-hospital mortality was defined as death occurring during the pancreatic resection hospitalization, while failure to rescue was defined as in-hospital death after experiencing ≥1 postoperative complications.11
The primary outcome was total costs of the pancreatic surgery and associated hospitalization. Costs were estimated from the summation of individual itemized charges for the hospitalization in which the pancreatic resection occurred. These charges were multiplied by hospital revenue code specific cost-to-charge ratios and adjusted or geographic variation with wage indices. Costs were adjusted for inflation to 2016 U.S. dollars.
Statistical analysis
Patient and operation characteristics were presented as means with standard deviations (SD), medians with interquartile ranges (IQR), and frequencies with percentages, as appropriate. Chi-squared tests and multivariable logistic regression analyses were performed to compare perioperative outcomes for high- and low-volume centers. Generalized linear models were used to analyze costs adjusted for patient covariates with inverse Gaussian distribution and identity or log link as determined appropriate with the modified Parks and link tests.25 Separate multivariable models were performed for perioperative outcomes and hospital volume. Multivariable logistic regression models for perioperative outcomes included the following covariates: age, race, sex, severity of illness, ECI, and operation year, type (pancreaticoduodenectomy vs. other partial pancreatectomy), and approach (minimally invasive vs. open). Generalized linear models included these same covariates and payer (private insurance, government, or other). Robust standard errors adjusted for clustering of patients at the same hospital was performed. Adjusted mean differences in costs were estimated from the generalized linear model using the predictive margins command (Stata 13, StataCorp, College Station, TX). Chi-squared and Kruskal-Wallis tests were used to compare failure to rescue rates and LOS by number of complications. All tests were two-sided. Statistical significance was set at p<0.05. Analyses were performed using SAS 9.4 (SAS Institute Inc, Cary, NC), and Stata 13.
Results
Table 1 describes demographics, clinical characteristics, and perioperative outcomes for patients treated at high- and low-volume centers. Of the 180 hospitals, 98 (54.6%) were high-volume centers and 82 (45.6%) were low-volume centers. Most patients were treated at high-volume centers (n=26,257, 95.0%), with only 5.0% (n=1,396) of patients treated at low-volume centers. The median annual number of pancreatic resections was 2.5 (IQR 0.5–7.2) at low-volume centers and 58.3 (IQR 34.1–95.5) at high-volume centers. Pancreaticoduodenectomies were more common at high-volume centers (58.8%) than low-volume centers (49.7%, p<0.0001). Minimally invasive surgeries including laparoscopic and robotic operations were similar at both high- (14.9%, n=3,923) and low-volume centers (16.6%, n=232).
Table 1.
Patient demographic, clinical, and operation characteristics, and perioperative outcomes at high- and low-volume centers.
| High-Volume N=26,257 |
Low-Volume N=1,396 |
All Patients N=27,653 |
|||||
|---|---|---|---|---|---|---|---|
| N/Mean | %/SD | N/Mean | %/SD | P-value* | N/Mean | %/SD | |
| Age (mean, SD) | 62.6 | 12.9 | 60.9 | 13.4 | <0.0001 | 62.5 | 12.9 |
| Sex | 0.10 | ||||||
| Male | 13,203 | 50.3% | 661 | 47.4% | 13,864 | 50.1% | |
| Race | <0.0001 | ||||||
| Caucasian | 20,862 | 79.5% | 933 | 66.8% | 21,795 | 78.8% | |
| Black | 2,546 | 9.7% | 246 | 17.6% | 2,792 | 10.1% | |
| Asian | 805 | 3.1% | 67 | 4.8% | 872 | 3.2% | |
| Other/Unknown | 2,044 | 7.8% | 150 | 10.7% | 2,194 | 7.9% | |
| Diagnosis | <0.0001 | ||||||
| Malignancy | 18,648 | 71.0% | 913 | 65.4% | 19,561 | 70.7% | |
| Benign Tumor | 3,601 | 13.7% | 187 | 13.4% | 3,788 | 13.7% | |
| Neoplasm of uncertain behavior | 718 | 2.7% | 57 | 4.1% | 775 | 2.8% | |
| Pancreatitis | 998 | 3.8% | 45 | 3.2% | 1,043 | 3.8% | |
| Other medical condition | 1,876 | 7.1% | 178 | 12.8% | 2,054 | 7.4% | |
| Unknown | 416 | 1.6% | 16 | 1.2% | 432 | 1.6% | |
| Severity of illness | <0.0001 | ||||||
| Minor | 13,556 | 51.6% | 779 | 55.8% | 14,335 | 51.8% | |
| Moderate | 10,305 | 39.2% | 499 | 35.7% | 10,804 | 39.1% | |
| Major | 2,300 | 8.8% | 108 | 7.7% | 2,408 | 8.7% | |
| Extreme | 86 | 0.3% | 10 | 0.7% | 96 | 0.3% | |
| Elixhauser Comorbidity Index (mean, SD) | 4.3 | 8.4 | 3.8 | 8.3 | 0.03 | 4.2 | 8.4 |
| Operation | <0.0001 | ||||||
| Pancreaticoduodenectomy | 15,453 | 58.9% | 694 | 49.7% | 16,147 | 58.4% | |
| Partial pancreatectomy | 10,804 | 41.1% | 702 | 50.3% | 11,506 | 41.6% | |
| Minimally Invasive Resection | 3,923 | 14.9% | 232 | 16.6% | 0.09 | 4,155 | 15.0% |
| Laparoscopic | 3,003 | 11.4% | 143 | 10.2% | 3,146 | 11.4% | |
| Robotic | 920 | 3.5% | 89 | 6.4% | 1,009 | 3.6% | |
| Payer | <0.0001 | ||||||
| Private insurance | 10,910 | 41.6% | 454 | 32.5% | 11,364 | 41.1% | |
| Government | 14,850 | 56.6% | 867 | 62.1% | 15,717 | 56.8% | |
| Other (e.g. self-pay, charity) | 497 | 1.9% | 75 | 5.4% | 572 | 2.1% | |
| Prolonged length of stay* | 6,384 | 24.3% | 435 | 31.2% | <0.0001 | 6,819 | 24.7% |
| Adj. Odds Ratio (95% Cl)** | Reference | 1.61 | (1.42–1.82) | <0.0001 | |||
| Complications* | 5,159 | 19.7% | 331 | 23.7% | 0.0002 | 5,490 | 19.9% |
| Adj. Odds Ratio (95% Cl)** | Reference | 1.37 | (1.20–1.57) | <0.0001 | |||
| Readmissions* | 4,798 | 18.3% | 296 | 21.2% | 0.006 | 5,094 | 18.4% |
| Adj. Odds Ratio (95% Cl)** | Reference | 1.22 | (1.07–1.39) | 0.004 | |||
| In-hospital mortality* | 312 | 1.2% | 24 | 1.7% | 0.08 | 336 | 1.2% |
| Adj. Odds Ratio (95% Cl)** | Reference | 1.59 | (1.03–2.45) | 0.03 | |||
SD, standard deviation. Adj. adjusted;
Student’s t-test (continuous) or Chi-Square test (categorical) analyses except for otherwise stated.
Multivariable logistic regression model adjusted for covariates: age, sex, severity of illness, Elixhauser comorbidity index, and operation year, type, and approach.
The unadjusted mean cost ± SD for the initial pancreatic resection was $20,352 ± $20,301. There were no significant differences in mean costs for pancreatic resection performed at high-volume versus low-volume centers (-$1,175, 95%CI -$3,254-$904, p=0.27, Table 2/A1, Supplement). When analyzing hospital volume as a continuous variable, there continued to be no relationship between hospital volume and costs in univariable (p=0.56) and multivariable models (p=0.64). This absence of relationship between hospital volume and cost is further illustrated in Figure 1A, which depicts annual hospital volume by mean pancreatic resection costs for each hospital. Furthermore, as shown in Figure 1B, in subgroup analyses comparing adjusted mean costs at high- and low-volume centers among patients (1) without any adverse outcome (i.e. prolonged LOS, complication, readmission, and in-hospital death), (2) with ≥1 adverse outcomes and (3) with ≥1 complications, there were no significant differences in mean costs at high- and low-volume centers (mean cost difference -$99, 95%CI -$1,612–1,414, p=0.90; -$1,586, 95%CI -$4,771–1,599, p=0.33; -$2,835, 95%CI -$7,588–1,919, p=0.24, respectively).
Table 2.
Adjusted* mean differences in healthcare costs for pancreatic resection hospitalizations with adverse perioperative outcomes and volume status.
| Mean Cost Differences | 95% Cl | P-value | ||
|---|---|---|---|---|
| Complications | $16,815 | $15,582 | $18,047 | <0.001 |
| Prolonged length of stay | $19,822 | $18,557 | $21,087 | <0.001 |
| Readmissions | $2,671 | $2,137 | $3,205 | <0.001 |
| In-hospital death | $41,596 | $34,484 | $48,707 | <0.001 |
| High-volume center | −$1,175 | −$3,254 | $904 | 0.27 |
CI, confidence interval;
Adjusted for age, sex, severity of illness, Elixhauser comorbidity index, operation year, type, and approach, and payer.
Figure 1 A/B.
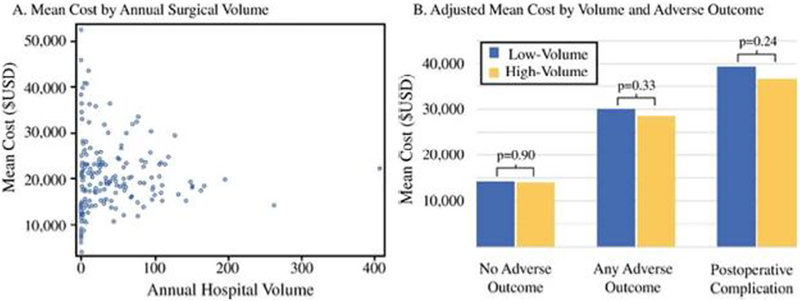
(A) Scatterplot of the mean cost per hospital by annual pancreatic resection volume. (B) Adjusted mean costs for pancreatic resection hospitalizations at high- and low- volume hospitals among patients who experienced no adverse outcome (i.e. prolonged length of stay, readmission, complication, and in-hospital death), one or more adverse outcomes, and one or more postoperative complications. Costs were adjusted for age, race, sex, severity of illness, Elixhauser comorbidity index, operation year, type, and approach, and payer. USD, United States Dollar.
Adjusted mean differences in pancreatic resection hospitalization costs for perioperative outcomes are presented in Table 2. Prolonged LOS, ≥1 complication, and in-hospital death was associated with a mean cost increase of $19,822, $16,815, and $41,596, respectively (p<0.001). Patients readmitted within 30-days had a mean cost increase of $2,671 at the initial surgical hospitalization (p<0.001). The number of complications significantly increased pancreatic resection hospitalization costs (Table 3). One complication was associated with a moderate increase in costs ($7,938) compared to no complications (p<0.001). A second complication was associated with a mean cost increase of $21,351; a third complication was associated with a mean cost increase of $42,817; a fourth complication was associated with a mean cost increase of $58,839 and ≥5 complications were associated with a mean cost increase of $105,294 (p<0.001 all). LOS and rates of failure to rescue increased as the number of complications increased (Figure 2A/B, p<0.0001).
Table 3.
Number of complications and adjusted* mean difference for pancreatic resection hospitalization costs.
| Number of Complications | Mean Cost Differences | 95% Cl | P value | |
|---|---|---|---|---|
| None (reference) | ||||
| 1 | $7,938 | $7,154 | $8,721 | <0.001 |
| 2 | $21,351 | $19,072 | $23,630 | <0.001 |
| 3 | $42,817 | $38,193 | $47,441 | <0.001 |
| 4 | $58,839 | $51,667 | $66,011 | <0.001 |
| >5 | $105,294 | $88,879 | $121,909 | <0.001 |
CI, confidence interval.
Adjusted for age, race, sex, severity of illness, Elixhauser comorbidity index, operation year, type, and approach, and payer.
Figure 2 A/B.

(A) Length of stay and (B) failure to rescue rates by the number of complications among patients who underwent a pancreatic resection. Length of stay and failure to rescue rates increased as the number of complications rose (p<0.0001 both).
To validate the impact of high-volume status, we analyzed these groups based on traditional quality outcomes (Table 1). High-volume centers had lower rates of prolonged LOS, complications, and 30-day readmissions in both unadjusted and multivariable analyses (p<0.05). Although not significant in the univariate analysis (p=0.08), operations performed at high-volume centers were associated with lower odds of in-hospital death compared to those performed at low-volume centers in multivariable analysis (p=0.03).
Discussion
In this study, pancreatic surgery at high-volume centers was not associated with a reduction in healthcare costs. This is surprising as high-volume centers had improved perioperative outcomes, which do significantly impact costs, including decreased rates of complications, prolonged LOS, readmissions, and in-hospital mortality. Such findings raise an important question. How can volume status be associated with improved outcomes (that are associated with a significant reduction in costs), but not be associated with a reduction in overall costs in itself?
A potential explanation for these findings is the small magnitude of the differences in the rates of adverse perioperative outcomes between high- and low-volume centers and most patients at both high- and low-volume centers do not experience an adverse event, leading to minimal differences in mean costs. We observed an absolute difference in complication and in-hospital mortality rates for high- and low-volume centers of 4.0% and 0.5% which is markedly smaller than differences noted in earlier research. For example, Birkmeyer et al. reported a reduction of in-hospital mortality of 5.3% at high-volume centers (5.0% vs. 10.3% for high- vs. low-volume centers) for pancreatic resections performed in 2000 using the Nationwide Inpatient Sample (NIS).26 However, a more recent NIS analysis of pancreatic surgeries showed a trend of improved in-hospital mortality over time, with rates as low as 2.3% in 2011.13 Additionally, Sutton et al. used the same administrative database, the University HealthSystems Consortium (aka Vizient), from 2009 to 2011 and observed a higher perioperative mortality rate of 3.5% for pancreatic surgeries performed at low-volume centers, with a mortality rate difference of 2.2% between high- and low-volume centers. With this marked difference, they were able to identify a reduction in costs of approximately $2,000 for operations performed at high-volume centers.27 As we observed a lower rate of in-hospital mortality compared to these earlier cohorts, it is likely that with improved perioperative outcomes at low-volume centers over time, the cost differences have become negligible. This is further supported by a multicenter analysis of Michigan hospitals from 2008 to 2013 by Healy et al. who found similar temporal improvements in complications and 30-day mortality rates after pancreatic resections.12 Notably, they found that as these outcomes improved, the difference in complication and mortality rates between high-and low-volume centers decreased and, in turn, became nonsignificant. Therefore, our findings of relatively small, but significant, differences in adverse perioperative outcomes is reflective of this national trend of improved perioperative outcomes, which potentially contributed to the nonsignificant relationship between surgical volume and costs.
Additionally, the absence of differences in mean costs for patients treated at high- and low-volume centers when stratified by adverse perioperative outcomes suggests that processes of care linked to the management of uncomplicated and complicated pancreatic surgery are similar at high- and low-volume centers. This is likely more pronounced in our study population, which admittedly consists of mostly academic centers and, therefore, the processes of care may not be procedure dependent, but based on institutional guidelines, which may be similar among academic centers.
These findings expand on prior research recognizing the significant financial impact of perioperative complications.11,28–30 Gani et al. also described greater hospitalization costs for pancreatic surgeries with postoperative complications. However, they emphasized the impact of failure to rescue as a major contributor to higher hospitalization costs. Others have argued that failure to rescue as a quality of care metric is limited as it is a rare event for elective operations, including pancreatic resections, and is influenced by complex factors including patient preferences.31,32 The findings from the present study suggest that secondary complications are potentially a more influential and modifiable driver of healthcare costs for pancreatic resections than failure to rescue alone. In fact, the greater healthcare costs observed among patients who experience failure to rescue are potentially secondary to the higher costs associated with multiple complications, as we found that failure to rescue rates were greater among patients who experienced multiple postoperative complications. This is consistent with prior research demonstrating increased risk of failure to rescue among patients with secondary complications.33 These findings emphasize the need of institutions and providers to focus efforts on reducing the risks of initial and secondary complications to improve patient quality of care and healthcare cost burden.
Additionally, as prolonged LOS was associated with higher healthcare costs for pancreatic surgery patients, LOS is another potential target for cost-reduction efforts. Although complications influence LOS, LOS may also be modified by the implementation standardized postsurgical management including enhanced recovery after surgery (ERAS) protocols. In fact, a recent meta-analysis of ERAS programs for pancreaticoduodenectomies demonstrated that implementation of ERAS programs was associated with decreased complications, prolonged LOS, and in-hospital costs.34
Although Vizient abstracts data from more than 200 hospitals, the majority of hospitals are academic centers, thereby limiting the generalizability of our findings. For example, in addition to temporal improvements in pancreatic surgery outcomes, the inclusion of mostly academic centers in our sample potentially further explains our relatively low mortality and complication rates. Additionally, as we used an administrative dataset, patient, surgeon, and hospital-level details were limited, which hindered our ability to identify pancreatic fistula complications, evaluate the influence of surgeon volume on costs, and to control for detailed hospital-level differences (albeit as most hospitals were academic/teaching centers, these differences were likely negligible). Lastly, although we found that hospital volume status was not associated with differences in pancreatic surgery hospitalization costs, we were not able to determine the specific cause of these findings. This is largely due to the absence of itemized charges available from Vizient. Without itemized charges, we were unable to determine the proportion of costs allocated to operative, perioperative care, ancillary staff and services, and laboratory and imaging testing costs at high- and low-volume centers. Future research should further investigate differences in cost allocation at high- and low-volume pancreatic surgery centers to identify additional targets for cost reduction. As surgeon volume and various processes of care (e.g. epidural catheters) have been implicated as potential strategies to reduce costs for pancreatic cancer-related surgery,35,36 these and other cost-reduction measures require further investigation.
Conclusion
Although high-volume centers have consistently demonstrated improved perioperative outcomes for pancreatic surgeries including lower complication and mortality rates, hospital volume was not a significant driver of pancreatic surgery costs. Our findings suggest that coordination of pancreatic surgery in high-volume centers may lead to improved clinical outcomes for a fraction of patients, but is unlikely to broadly reduce health care expenditures.
Supplementary Material
Table A1.
Multivariable generalized linear model for hospital volume.
| Coefficient | 95% CI | P-value | ||
|---|---|---|---|---|
| Volume | ||||
| Low Volume | Reference | |||
| High Volume | −1175.07 | −3254.41 | −904.27 | 0.27 |
| Age | 2.41 | −16.88 | 21.71 | 0.81 |
| Sex | ||||
| Female | Reference | |||
| Male | −1745.26 | −2109.33 | −1381.19 | <0.001 |
| Race | ||||
| Caucasian | Reference | |||
| African American | 122.97 | −643.33 | 889.27 | 0.75 |
| Asian | 2820.01 | 1099.81 | 4540.21 | 0.001 |
| Other | 2366.10 | 1017.35 | 3714.85 | 0.001 |
| Unknown | −1443.85 | −3071.53 | 183.83 | 0.08 |
| Severity of Illness | ||||
| Minor | Reference | |||
| Moderate | 2550.67 | 2089.95 | 3011.39 | <0.001 |
| Major | 7782.20 | 6988.73 | 8575.67 | <0.001 |
| Extreme | 43212.74 | 36284.23 | 50141.26 | <0.001 |
| Unknown | 3553.20 | 2521.07 | 4585.33 | <0.001 |
| Pancreaticoduodenectomy | 3114.89 | 2498.07 | 3731.71 | <0.001 |
| Minimally invasive operation | −1377.41 | −2108.42 | −646.39 | <0.001 |
| Payer | ||||
| Private | Reference | |||
| Government | 503.59 | −9.29 | 1016.48 | 0.05 |
| Other | −148.71 | −1547.74 | 1250.32 | 0.84 |
| Elixhauser comorbidity index score | 78.00 | 45.81 | 110.19 | <0.001 |
| Time-period | ||||
| 10–2013 to 9–2014 | Reference | |||
| 10–2014 to 9–2015 | 253.85 | −308.04 | 815.75 | 0.38 |
| 10–2015 to 9–2016 | 1919.82 | 1076.54 | 2763.09 | <0.001 |
| 10–2016 to 6–2017 | 1776.41 | 977.35 | 2575.46 | <0.001 |
Synopsis:
In this analysis of 27,653 pancreatectomy patients, we found that although adverse perioperative outcomes were associated with greater healthcare costs, there were no differences in costs at high- and low-volume centers, suggesting that surgical volume is not an indicator in itself of improved healthcare efficiency reflected by lower costs.
Acknowledgments
Funding:
This project was supported by the National Center for Advancing Translational Sciences, National Institutes of Health [grant number UL1TR001860] and by the Agency for Health Care Research and Quality [grant number T32HS 022236]. The content is solely the responsibility of the authors and does not necessarily represent the official views of the NIH.
References
- 1.Munoz E, Munoz W 3rd, Wise L National and surgical health care expenditures, 2005–2025. Ann Surg. February 2010;251(2):195–200. [DOI] [PubMed] [Google Scholar]
- 2.Moses DA, Mehaffey JH, Strider DV, Tracci MC, Kern JA, Upchurch GR Jr. Smoking Cessation Counseling Improves Quality of Care and Surgical Outcomes with Financial Gain for a Vascular Practice. Ann Vasc Surg. July 2017;42:214–221. [DOI] [PubMed] [Google Scholar]
- 3.Gerber MH, Delitto D, Crippen CJ, et al. Analysis of the Cost Effectiveness of Laparoscopic Pancreatoduodenectomy. J Gastrointest Surg. May 31 2017. [DOI] [PMC free article] [PubMed] [Google Scholar]
- 4.Cunningham KE, Zenati MS, Petrie JR, et al. A policy of omitting an intensive care unit stay after robotic pancreaticoduodenectomy is safe and cost-effective. J Surg Res. July 2016;204(1):8–14. [DOI] [PubMed] [Google Scholar]
- 5.Teh SH, Diggs BS, Deveney CW, Sheppard BC. Patient and hospital characteristics on the variance of perioperative outcomes for pancreatic resection in the United States: a plea for outcome-based and not volume-based referral guidelines. Arch Surg. August 2009;144(8):713–721. [DOI] [PubMed] [Google Scholar]
- 6.Hata T, Motoi F, Ishida M, et al. Effect of Hospital Volume on Surgical Outcomes After Pancreaticoduodenectomy: A Systematic Review and Meta-analysis. Ann Surg. April 2016;263(4):664–672. [DOI] [PubMed] [Google Scholar]
- 7.Birkmeyer JD, Siewers AE, Finlayson EV, et al. Hospital volume and surgical mortality in the United States. N Engl J Med. April 11 2002;346(15):1128–1137. [DOI] [PubMed] [Google Scholar]
- 8.Finks JF, Osborne NH, Birkmeyer JD. Trends in hospital volume and operative mortality for high-risk surgery. N Engl J Med. June 2 2011;364(22):2128–2137. [DOI] [PMC free article] [PubMed] [Google Scholar]
- 9.Gooiker GA, van Gijn W, Wouters MW, et al. Systematic review and meta-analysis of the volume-outcome relationship in pancreatic surgery. Br J Surg. April 2011;98(4):485–494. [DOI] [PubMed] [Google Scholar]
- 10.Brown EG, Yang A, Canter RJ, Bold RJ. Outcomes of pancreaticoduodenectomy: where should we focus our efforts on improving outcomes? JAMA Surg. July 2014;149(7):694–699. [DOI] [PubMed] [Google Scholar]
- 11.Gani F, Johnston FM, Nelson-Williams H, et al. Hospital Volume and the Costs Associated with Surgery for Pancreatic Cancer. J Gastrointest Surg. September 2017;21 (9): 1411–1419. [DOI] [PubMed] [Google Scholar]
- 12.Healy MA, Krell RW, Abdelsattar ZM, et al. Pancreatic Resection Results in a Statewide Surgical Collaborative. Ann Surg Oncol. August 2015;22(8):2468–2474. [DOI] [PMC free article] [PubMed] [Google Scholar]
- 13.Dudekula A, Munigala S, Zureikat AH, Yadav D. Operative Trends for Pancreatic Diseases in the USA: Analysis of the Nationwide Inpatient Sample from 1998–2011. J Gastrointest Surg. April 2016;20(4):803–811. [DOI] [PubMed] [Google Scholar]
- 14.Sutton JM, Hayes aJ, Wilson GC, et al. Validation of the University HealthSystem Consortium administrative dataset: concordance and discordance with patient-level institutional data. J Surg Res. August 2014;190(2):484–490. [DOI] [PubMed] [Google Scholar]
- 15.Chang AL, Kim Y, Ertel AE, et al. Case mix-adjusted cost of colectomy at low-, middle-, and high-volume academic centers. Surgery. May 2017;161(5):1405–1413. [DOI] [PubMed] [Google Scholar]
- 16.Ertel AE, Wima K, Hoehn RS, et al. Variability in postoperative resource utilization after pancreaticoduodenectomy: Who is responsible. Surgery. December 2016;160(6):1477–1484. [DOI] [PubMed] [Google Scholar]
- 17.Reddy S, Wolfgang CL, Cameron JL, et al. Total pancreatectomy for pancreatic adenocarcinoma: evaluation of morbidity and long-term survival. Ann Surg. August 2009;250(2):282–287. [DOI] [PubMed] [Google Scholar]
- 18.Bhayani NH, Miller JL, Ortenzi G, et al. Perioperative outcomes of pancreaticoduodenectomy compared to total pancreatectomy for neoplasia. J Gastrointest Surg. March 2014;18(3):549–554. [DOI] [PubMed] [Google Scholar]
- 19.van Walraven C, Austin PC, Jennings A, Quan H, Forster AJ. A modification of the Elixhauser comorbidity measures into a point system for hospital death using administrative data. Med Care. June 2009;47(6):626–633. [DOI] [PubMed] [Google Scholar]
- 20.Moore BJ, White S, Washington R, Coenen N, Elixhauser A. Identifying Increased Risk of Readmission and In-hospital Mortality Using Hospital Administrative Data: The AHRQ Elixhauser Comorbidity Index. Med Care. July 2017;55(7):698–705. [DOI] [PubMed] [Google Scholar]
- 21.Elixhauser A, Steiner C, Harris DR, Coffey RM. Comorbidity measures for use with administrative data. Med Care. January 1998;36(1):8–27. [DOI] [PubMed] [Google Scholar]
- 22.Meguid RA, Ahuja N, Chang DC. What constitutes a “high-volume” hospital for pancreatic resection? J Am Coll Surg. April 2008;206(4):622 e621–629. [DOI] [PubMed] [Google Scholar]
- 23.Weingart SN, Iezzoni LI, Davis RB, et al. Use of administrative data to find substandard care: validation of the complications screening program. Med Care. August 2000;38(8):796–806. [DOI] [PubMed] [Google Scholar]
- 24.Collins TC, Daley J, Henderson WH, Khuri SF. Risk factors for prolonged length of stay after major elective surgery. Ann Surg. August 1999;230(2):251–259. [DOI] [PMC free article] [PubMed] [Google Scholar]
- 25.Manning WG, Mullahy J. Estimating log models: to transform or not to transform? J Health Econ. July 2001;20(4):461–494. [DOI] [PubMed] [Google Scholar]
- 26.Birkmeyer JD, Dimick JB. Potential benefits of the new Leapfrog standards: effect of process and outcomes measures. Surgery. June 2004;135(6):569–575. [DOI] [PubMed] [Google Scholar]
- 27.Sutton JM, Wilson GC, Paquette IM, et al. Cost effectiveness after a pancreaticoduodenectomy: bolstering the volume argument. HPB (Oxford). December 2014;16(12):1056–1061. [DOI] [PMC free article] [PubMed] [Google Scholar]
- 28.Nathan H, Atoria CL, Bach PB, Elkin EB. Hospital volume, complications, and cost ofcancer surgery in the elderly. J Clin Oncol. January 01 2015;33(1):107–114. [DOI] [PubMed] [Google Scholar]
- 29.Nelson-Williams H, Gani F, Kilic A, et al. Factors Associated With Interhospital Variability in Inpatient Costs of Liver and Pancreatic Resections. JAMA Surg. February 2016;151(2):155–163. [DOI] [PubMed] [Google Scholar]
- 30.Short MN, Aloia TA, Ho V. The influence of complications on the costs of complex cancer surgery. Cancer. April 1 2014;120(7):1035–1041. [DOI] [PMC free article] [PubMed] [Google Scholar]
- 31.Wakeam E, Hyder JA. Raising the Bar for Failure to Rescue: Critical Appraisal of Current Measurement and Strategies to Catalyze Improvement. JAMA Surg. November 2015;150(11):1023–1024. [DOI] [PubMed] [Google Scholar]
- 32.Paul Olson TJ, Schwarze ML. Failure-to-pursue Rescue: Truly a Failure? Ann Surg. August 2015;262(2):e43–44. [DOI] [PMC free article] [PubMed] [Google Scholar]
- 33.Wakeam E, Hyder JA, Lipsitz SR, et al. Hospital-level Variation in Secondary Complications After Surgery. Ann Surg. March 2016;263(3):493–501. [DOI] [PubMed] [Google Scholar]
- 34.Xiong J, Szatmary P, Huang W, et al. Enhanced Recovery After Surgery Program in Patients Undergoing Pancreaticoduodenectomy: A PRISMA-Compliant Systematic Review and Meta-Analysis. Medicine (Baltimore). May 2016;95(18):e3497. [DOI] [PMC free article] [PubMed] [Google Scholar]
- 35.Ho V, Aloia T. Hospital volume, surgeon volume, and patient costs for cancer surgery. Med Care. July 2008;46(7):718–725. [DOI] [PubMed] [Google Scholar]
- 36.Ho V, Short MN, Aloia TA. Can postoperative process of care utilization or complication rates explain the volume-cost relationship for cancer surgery? Surgery. August 2017;162(2):418–428. [DOI] [PMC free article] [PubMed] [Google Scholar]
Associated Data
This section collects any data citations, data availability statements, or supplementary materials included in this article.