

Abstract
Purpose
In this study, the efficacy of transurethral prostate ablation in the presence of silica‐shell ultrasound‐triggered phase‐shift emulsions (sUPEs) doped with MR contrast was evaluated. The influence of sUPEs on MR imaging assessment of the ablation zone was also investigated.
Methods
sUPEs were doped with a magnetic resonance (MR) contrast agent, Gd2O3, to assess ultrasound transition. Injections of saline (sham), saline and sUPEs alone, and saline and sUPEs with Optison microbubbles were performed under guidance of a prototype interventional MRI navigation platform in a healthy canine prostate. Treatment arms were evaluated for differences in lesion size, T1 contrast, and temperature. In addition, non‐perfused areas (NPAs) on dynamic contrast‐enhanced (DCE) MRI, 55°C isotherms, and areas of 240 cumulative equivalent minutes at 43°C (CEM 43) dose or greater computed from MR thermometry were measured and correlated with ablated areas indicated by histology.
Results
For treatment arms including sUPEs, the computed correlation coefficients between the histological ablation zone and the NPA, 55°C isotherm, and 240 CEM 43 area ranged from 0.96–0.99, 0.98–0.99, and 0.91–0.99, respectively. In the absence of sUPEs, the computed correlation coefficients between the histological ablation zone and the NPA, 55°C isotherm, and 240 CEM 43 area were 0.69, 0.54, and 0.50, respectively. Across all treatment arms, the areas of thermal tissue damage and NPAs were not significantly different (P = 0.47). Areas denoted by 55°C isotherms and 240 CEM 43 dose boundaries were significantly larger than the areas of thermal damage, again for all treatment arms (P = 0.009 and 0.003, respectively). No significant differences in lesion size, T1 contrast, or temperature were observed between any of the treatment arms (P > 0.0167). Lesions exhibiting thermal fixation on histological analysis were present in six of nine insonations involving sUPE injections and one of five insonations involving saline sham injections. Significantly larger areas (P = 0.002), higher temperatures (P = 0.004), and more frequent ring patterns of restricted diffusion on ex vivo diffusion‐weighted imaging (P = 0.005) were apparent in lesions with thermal fixation.
Conclusions
T1 contrast suggesting sUPE transition was not evident in sUPE treatment arms. The use of MR imaging metrics to predict prostate ablation was not diminished by the presence of sUPEs. Lesions generated in the presence of sUPEs exhibited more frequent thermal fixation, though there were no significant changes in the ablation areas when comparing arms with and without sUPEs. Thermal fixation corresponded to some qualitative imaging features.
Keywords: contrast agent, image‐guided intervention, magnetic resonance imaging, phase‐shift emulsion, prostate thermal therapy, transurethral ultrasound ablation
1. Introduction
Prostate cancer (PCa) is the second most common cause of cancer‐related death in men, with over 180,000 cases per year in the United States.1 Prostate‐specific antigen (PSA) screening indicates a large number of these cases are low‐ or intermediate‐risk diagnoses.2 Conservative approaches including active surveillance and watchful waiting can preserve quality of life, but with an increased risk of cancer progression and mortality.3 Higher rates of cancer control can be achieved with whole gland surgical resection4 or radiotherapy,5 but these approaches are associated with a high incidence of treatment comorbidities such as incontinence, impotence, and bowel dysfunction.6, 7 The development of local treatments for PCa is therefore an attractive compromise between conservative and radical treatments.
Magnetic resonance (MR)‐guided therapeutic ultrasound is a localized, minimally or noninvasive ablative therapy.8, 9 Transurethral ultrasound ablation (TULSA) administers acoustic energy directly into the prostate without having to traverse intervening tissue. MR imaging (MRI) enables real‐time temperature monitoring to assess the treatment progress.10, 11, 12 TULSA sources utilize an unfocused transducer, which enables bulk heating of prostate tissue. Preclinical studies have shown TULSA to be an effective and safe means of prostate ablation in healthy tissue with minimal side effects.12, 13, 14 The chosen safety margin of 3 mm inside the prostate capsule minimizes side effects,10 but spares an average of 10% of the prostate volume in the periphery, where many cancerous tissues are located.10 Assessment of TULSA efficacy in a Phase I trial has noted clinically significant residual cancer in 31% of patients,15 indicating that refinement of the technique is necessary. In addition, the immediate physiological response of tissue to therapeutic insonation masks the full extent of tissue ablation,16, 17, 18, 19, 20 necessitating novel imaging techniques to assess the treatment zone.
Silica‐shell ultrasound‐triggered phase‐shift emulsions (sUPEs) can be transitioned to microbubbles to enhance the effects of therapeutic ultrasound21, 22, 23, 24 and act as multimodality contrast agents.22, 23, 25 sUPEs also exhibit increased stability and longevity in vivo compared with microbubbles or other nanoparticle formulations.21, 22, 25, 26, 27 Transition of sUPEs containing MR contrast agents may increase MR image intensity for clearer delineation of the ablation zone.28 Furthermore, bubble‐enhanced heating has been demonstrated via droplet transition.29, 30 Droplet accumulation in cancerous tissue would preferentially enhance heating of the target, allowing extension of TULSA treatment margins to peripheral zones with potentially reduced risk of damage to extracapsular structures.
To date, focused sources have been utilized to instigate droplet transition. The goal of this preclinical study was to assess sUPEs as therapeutic sensitizing agents and as ultrasound‐activated MR contrast agents for monitoring TULSA prostate ablation. A secondary goal of this study was to evaluate dynamic contrast enhanced (DCE) MRI and MR thermometry as metrics of prostate ablation in the presence of sUPEs. sUPEs were filled with perfluorocarbon and an MR contrast agent, gadolinium‐oxide (Gd2O3), to assess sUPE transition. To aid the cavitation process necessary for sUPE transition, an additional treatment arm combined sUPEs and a lipid‐shell microbubble. Differences in therapeutic effects for each treatment arm were assessed with histology and MR imaging. Ablated areas were assessed using multiple imaging‐based metrics and compared to measured lesion sizes from histological slides. In addition to 3 Tesla (3T) in vivo MR imaging before, during, and after the application of therapeutic ultrasound, ex vivo scanning of the prostate was performed at 9.4 T to further assess the ablation zone.31
2. Materials and methods
2.A. Ultrasound phase‐shift emulsion formulation
Tetramethyl orthosilicate (TMOS), trimethylphenylsilane (TMPheS), N‐[3‐(trimethoxysilyl)propyl]ethylenediamine (DETA), diethylene glycol, n‐hexane, sodium hydroxide, methanol, sodium bicarbonate, and Gadolinium (III) chloride hexahydrate were purchased from Sigma‐Aldrich (St. Louis, MO). Oleic acid was procured from Tokyo Chemical Industry (Tokyo, Japan). Spherical polystyrene templates of 2‐μm diameter were obtained from Polysciences (Warrington, PA). Perfluoropentane (PFP) was purchased from Strem Chemicals (Newburyport, MA). Milli‐Q purified water was obtained from a Millipore SuperQ Plus Water Purification System (Billerica, MA). The 2‐μm microshells used in this study were synthesized with methods previously developed by Liberman et al.27 To visualize transition of the particles, an MR contrast agent, Gd2O3, was incorporated into the PFP liquid. Gadolinium oxide nanoparticles (2‐nm diameter) were manufactured following a modified polyol method.32 Briefly, gadolinium chloride hexahydrate was dissolved in diethylene glycol at 90–100°C for 4 h. Sodium hydroxide was added to the solution to form precipitates. The solution was heated to 140°C for 1 h, subsequently heated to 180°C for 4 h, and finally cooled to 140°C. Oleic acid was added to the solution to displace the surface diethylene glycol for 24 h. Methanol was added to precipitate the oleic acid‐coated gadolinium oxide, which was washed three times in methanol. The pellets were then suspended in hexane. Sodium bicarbonate was used to remove excess oleic acid. The remaining purified oleic acid‐coated gadolinium oxide nanoparticles were stored in hexane solution.
To incorporate gadolinium oxide nanoparticles, the polystyrene templates were initially swollen in 10% hexane in ethanol for 1 h. Gadolinium oxide nanoparticles were also suspended in the hexane solution. After 1 h of incubation, the polystyrene templates were centrifuged and the solution was replaced with ethanol for polymer contraction of at least 24 h. After contraction, the templates returned to their original size and could be used for silica synthesis. To incorporate the PFP, the shells were first subjected to a vacuum‐refill cycle to clean the surface. PFP gas was then injected into a vacuumed vial containing the shells and placed on ice to condense the gas. Additional PFP gas was then introduced, followed by an injection of degassed water. The PFP remained trapped within the shells due to its hydrophobicity and Laplace pressure.
2.B. Therapeutic ultrasound therapy system
A prototype transurethral ultrasound therapy system (Philips, Vantaa, Finland)13 was used for transurethral insonation, as illustrated in Fig. 1. The therapy system includes a rigid applicator [5 mm (15 French) diameter] with an unfocused array of eight laterally aimed transducer elements (4 mm × 5 mm area/element) with a 3.75‐MHz center frequency. The acoustic field of the transurethral device was measured with a 400‐μm needle hydrophone (HNP‐0400, Onda Corporation, Sunnyvale, CA) mounted on a computer‐controlled, three‐axis positioning system (MN‐10, Velmex, Inc, Bloomfield, NY).
Figure 1.

(a) Top–down schematic of the ultrasound therapy system components inside the MRI scanner room and dimensions of TULSA applicator. Device output and rotation were controlled from the scanner control area to apply static insonations to injection sites. The coolant hoses connect to a pump in the scanner control area. The RF filter box connects to the ultrasound generator and controller PC. (b) Photograph of scanner room just prior to TULSA procedure. An anterior body surface coil was used in conjunction with the posterior coil embedded in the scanner table. [Color figure can be viewed at wileyonlinelibrary.com]
Insonations of 3.7–4.2 W acoustic power per element were initiated with the transurethral device. The free field (underated) peak negative pressure of the acoustic field was approximately 2.5–2.8 MPa (spatial peak, temporal peak). To target desired locations within the prostate, a motorized mount was used to rotate the applicator around its central axis. During insonation, degassed, room temperature water (20°C) was circulated through a closed loop over the transducer elements to prevent thermal damage to the urethra and overheating of the transducer elements.
2.C. Pretreatment
This study included a total of six male mixed breed healthy canines aged 3–4 yr. The canines were housed in accordance with all federal policies and the Guide for the Care and Use of Laboratory Animals. All work was done under an IACUC‐approved protocol and under the supervision of a veterinarian in an AAALAC‐accredited facility. A perineal urethrostomy was performed on the canine subjects at least 12 months prior to the procedure to allow insertion of the ultrasound applicator into the prostatic urethra. Following the urethrostomy, animals were monitored to prevent infection or reclosing of the stoma during the healing process. Canines maintained normal activity and were monitored several times per day by the veterinary staff. No medical issues occurred during the postsurgical period. Prior to insertion of the transurethral device, animals were sedated intramuscularly with buprenorphine (10.9–15 μg/kg), ketamine (2.4–3.6 mg/kg), and dexdomitor (13.4–18 μg/kg). The animals were intubated and placed on isoflurane gas anesthesia with a ventilator over the course of the procedure. A Foley catheter was inserted in the stoma to void bladder fluid prior to the insertion of the ultrasound applicator. A plastic tube was also inserted in the rectum to prevent flatulence during the procedure. Throughout the procedure, animals were given a physiological saline solution intravenously. Heart rate, body temperature, blood pressure, respiratory rate, SPO2, and end‐tidal CO2 were monitored by a certified veterinary technician. Perineal incision had to be performed in two of the six animals to enlarge the urethrostomy for the insertion of the ultrasound applicator. The applicator was lubricated with aqueous gel (Aquasonic 100, Parker Laboratories Inc., Fairfield, NJ) to facilitate insertion into the urethrostomy and achieve acoustic coupling with the urethra wall.
2.D. Therapy planning and monitoring
All MRI scans of the canines during the TULSA procedure were performed on a commercial 3T Achieva dStream MRI system (Philips Healthcare, Best, The Netherlands) using the body transmit coil, a 16‐channel anterior receive coil placed on the abdomen, and a 16‐channel posterior receive coil embedded in the scanner table [Fig. 1(b)]. The ultrasound applicator was positioned using real‐time feedback from a balanced turbo field echo (bTFE) sequence via a Philips interventional imaging system prototype (Interventional MRI Suite (iSuite), Philips Research Labs, Hamburg, Germany) (Fig. S1). Three orthogonal imaging planes were acquired and updated in real time to guide the applicator through the urethra and position the elements at the level of the prostate. Baseline T1‐weighted spin echo (T1W SE), T2‐weighted spin echo (T2W SE), and diffusion‐weighted images (DWI) were acquired prior to the treatment protocol. The number of image slices varied from 12 to 20 for all pre‐ and post‐insonation imaging sequences, depending on prostate size. Table 1 summarizes the scan parameters for each sequence performed for therapy planning, monitoring, and evaluation.
Table 1.
MR imaging sequence scan parameters for treatment planning, monitoring, and evaluation acquired on a Philips Achieva 3T MRI scanner
| Sequence | TR/TE (ms) | In‐plane resolution (mm2) | Array size | Slice thickness (mm) | Slice gap (mm) | NSA | TSE/TFE/EPI factor | Temporal resolution (s) | b‐values (s/mm2) |
|---|---|---|---|---|---|---|---|---|---|
| T2W TSE | 4500/115 | 0.75 × 0.75 | 528 × 528 | 3 | 0 | 2 | 16 | N/A | N/A |
| T1W TSE | 559/16 | 0.7 × 0.7 | 512 × 512 | 3 | 0 | 1 | 5 | N/A | N/A |
| 2D bTFE | 3.5/1.21 | 1.33 × 1.32 | 288 × 288 | 5 | N/A | 1 | 428 | 1.5 | N/A |
| Temperature mapping 2D FFE | 14/8.0 | 2.0 × 2.0 | 176 × 176 | 4 | N/A | 1 | 1 | 1.3 | N/A |
| DWI EPI | 3884/65 | 1.25 × 1.25 | 288 × 288 | 3 | 0 | 6 | 59 | N/A | 50, 100, 500, 1000 |
| DCE 3D FFE | 5.2/1.52 | 1.16 × 1.16 | 128 × 128 | 5 | −2.5 | 1 | N/A | 7.3 | N/A |
TSE/TFE, turbo spin echo/turbo field echo; bTFE, balanced turbo field echo; FFE, fast field (gradient) echo; DWI, diffusion‐weighted imaging; EPI, echo planar imaging; DCE, dynamic contrast enhanced; TR, repetition time; TE, echo time; NSA, number of signal averages.
For each canine, an MR‐compatible biopsy needle was used to guide the insertion of a semi‐rigid plastic sheath to a target location within the prostate under guidance with the iSuite system. Through the sheath, a 1 mL solution of either physiological saline solution alone (sham), saline and sUPEs (1.2 to 2.0 mg/mL, 0.4 to 0.5 mMol Gd), or saline, sUPEs, and Optison™ (10 μL/mL, consistent with the manufacturer's recommended dose, General Electric (GE) Healthcare, Marlborough, MA) was injected directly into the prostate (Fig. S2). Administered injections were spaced by 10.0–25.9 mm to prevent overlapping insonation zones. The concentration of sUPEs was chosen to approximate physiological concentrations of clinical MR contrast in the prostate.33 The order and location of each applied treatment arm were randomized for each subject. Following each injection, the same T1W and T2W sequences as used prior to injection were repeated to assess any change in contrast.
A test sonication (2.1 W acoustic power/element, 20 s duration) was applied to verify the correct angular position, required number of active elements for full coverage of the injection, and acoustic coupling quality. Once proper targeting was verified, thermometry images were monitored until the insonified zone returned to baseline temperature (37°C). An insonation with 3.7–4.2 W acoustic power/element was then applied. Multiple injections were performed in each animal. Thus, all insonations were applied statically (i.e., without rotating the TULSA device) in the direction of one injection. Tissue temperature was monitored using the proton resonance frequency (PRF) shift method (0.0094 ppm/°C).34 Temperature maps were acquired at 0.5–3 Hz and overlaid on the anatomical MR images using the iSuite system. The first insonation in each subject was stopped once the temperature reached 56°C13 at a control point placed 3 mm inside the edge of the prostate capsule, or once 5 min of insonation had elapsed. This cutoff temperature induces a lethal thermal dose of 240 cumulative equivalent minutes at 43°C (CEM43) within the approximate 2‐s temporal resolution of the temperature mapping sequence.35 The subsequent treatments were applied following each injection, using the same insonation time and parameters to maintain consistency in the injections’ ultrasound exposure. Figure 2 illustrates the treatment planning and monitoring process, including marker placement, temperature mapping, and thermal dose map calculation.
Figure 2.

In vivo treatment planning, monitoring, and evaluation using the Philips iSuite interface at 3T. MR scan parameters for (a, d) the 2D bTFE sequence and (b, c, e, f) the 2D FFE temperature mapping sequence are given in Table 1. (a, d) Placement of treatment marker (red sphere) at injection site using bTFE images, (b, e) real‐time thermography images acquired during therapy (scale = 37–80°C), and (c, f) posttreatment thermal dose maps (scale = 0–240 CEM 43) for a lesion in (a, b, c) axial and (d, e, f) oblique‐sagittal planes. The crosshairs in frames b and e are centered on the transducer, whose elements are aimed upward in frames b and c and to the left in frames e and f. [Color figure can be viewed at wileyonlinelibrary.com]
After each insonation, thermometry images were monitored until the insonated region returned to baseline temperature (37–39°C), and an additional 5‐min period was allotted to ensure the tissue temperature had equilibrated. The T1W and T2W SE sequences were then repeated to assess contrast change. Following completion of all insonations and post‐therapy T1W and T2W images, a final DWI sequence was acquired. An FDA‐approved chelated gadolinium MRI contrast agent (Multihance, Bracco Diagnostics, 0.1 mmol/kg) was then injected intravenously, and the uptake and washout within the prostate were monitored with DCE images acquired with a fast field echo (FFE) T1W sequence over the course of 10 min. Contrast injection proceeded after at least five baseline T1W acquisitions. Following the procedure, canines were euthanized by giving pentobarbital (100 mg/kg) intravenously. A prostatectomy was performed, and the prostate and surrounding tissues were examined for gross abnormalities. The excised prostates were placed into 10% buffered formalin (Fisher Scientific, Hampton, NH) following the removal of surrounding fatty tissues and seminal vesicles. Figure 3 displays the timeline of a typical experiment.
Figure 3.

Timeline of typical canine experiment, including setup, injections, treatments, and image acquisitions. All posttreatment images were acquired 5 min after temperatures in the treatment zone had returned to 37–39°C. 3T MR scan parameters are given in Table 1.
2.E. 3T image analysis and treatment evaluation
Pre‐ and post‐therapy T1W images were evaluated to determine the change in MR contrast after insonation of each treatment arm. Regions of interest (ROIs) encompassing the treated area (lesion ROIs) and ROIs in the prostate but completely outside the treated area (noise ROIs) were drawn in 8–10 slices for each canine prostate. Pre‐ and post‐therapy images were registered using custom‐scripted landmark‐based affine registration, and subtraction images (post‐therapy minus pretherapy) were calculated. Contrast‐to‐noise ratios (CNRs) for each lesion were then computed from the subtraction images as
| (1) |
where is the mean pixel value in the lesion ROI, is the standard deviation in the noise ROI, and the factor of accounts for Gaussian error propagation causing additive noise in the subtraction image.36 Following treatment, diffusion‐weighted images were analyzed to calculate apparent diffusion coefficient (ADC) maps by fitting signal intensities as a function of b‐value to an exponential decay on a pixelwise basis.37
Phase images acquired from the temperature mapping sequence were processed to compute temperature changes from an assumed baseline of 37°C. Phase drift was corrected to zero order by computing the shift in the largest temperature histogram peak and subtracting this value from the entire map. The boundary of pixels reaching 55°C (55°C isotherm) was determined for each insonation.11, 38 Thermal dose maps were calculated from temperature data via the Sapareto–Dewey equation.35 The areas of pixels receiving thermal doses of at least 240 CEM43 were measured to estimate the extent of delayed cell kill.12, 39, 40, 41 Before the thermometry sequence was optimized, some temperature maps generated by iSuite had erroneous discontinuities due to high phase image noise that prevented accurate phase unwrapping. Therefore, all thermometry data were subjected to a deterministic phase unwrapping algorithm42 to recompute the temperature data offline prior to analysis. Temperature drift was corrected for these cases as described above. Temperature uncertainty was taken as the temporal standard deviation in an area of prostate completely outside the heated zone, after correcting for global phase drift over the duration of the procedure. This uncertainty was propagated through the calculations of 55°C isotherms and 240 CEM43 dose boundaries to compute an estimate of the error in these metrics.
In order to analyze the time‐dependent thermometry data, temperature map pixels within the prostate that received 240 CEM43 or greater were fit (least squares) to an exponential recovery of the form:
| (2) |
where is the temperature at time , is a fitting parameter that represents the equilibrium temperature approached in the tissue, is a rate coefficient of heat increase, and is a fitting parameter that represents the onset time of tissue heating. For each lesion, the average coefficients and were obtained over the top 25% of fitted pixels in terms of R2 values (approximately R2 ≥ 0.9). Contrast‐enhanced images were analyzed to assess non‐perfused areas (NPAs) within the prostate. Regions of interest encompassing the non‐perfused tissue were manually drawn and compared with the areas of lesions measured from stained histological slides. The areas within the 55°C isotherm and the 240 CEM43 thermal dose boundary were calculated for each treatment and compared with histology.
2.F. Ex vivo 9.4 T MRI
In order to visualize the fine structure of the ultrasound lesions, ex vivo canine prostate samples were imaged with a 9.4 T Bruker BioSpec 33‐cm horizontal bore scanner with a Bruker 72‐mm birdcage volume coil (Billerica, MA). Samples were submerged in Fluorinert (3M Co., St. Paul, MN) and oriented to approximately replicate the in vivo orientation for the supine canines. Fast low‐angle shot (FLASH) tri‐pilot images were acquired in three orthogonal planes to verify correct positioning of the sample and determine angulation of axial slices for subsequent scans. T1W and T2W images were acquired, and sequences for T1, T2, and ADC mapping were performed as outlined in Table 2. ADC maps were computed from diffusion‐weighted images by fitting to an exponential decay as described above.37 T1 maps were computed from variable‐TR rapid acquisition with refocused echoes (VTR RARE) images by fitting each voxel magnitude in a least squares sense to an exponential recovery.43 Similarly, T2 maps were computed from multi‐slice mutli‐echo (MSME) images by fitting each voxel magnitude in a least squares sense to an exponential decay.44
Table 2.
MRI scan parameters for ex vivo imaging at 9.4 T
| Sequence | TR/TE (ms) | In‐plane resolution (μm2) | Array size | Slice thickness (mm) | Slice gap (mm) | NSA | RARE factor | b‐values (s/mm2) |
|---|---|---|---|---|---|---|---|---|
| FLASH tri‐pilot | 100/2.2 | 312.5 × 312.5 | 256 × 256 | 1 | N/A | 1 | N/A | N/A |
| T2W turbo‐RARE | 5000/30 | 215 × 215 | 256 × 256 | 0.5 | 0 | 2 | 4 | N/A |
| T1W FLASH | 420/3.0 | 215 × 215 | 256 × 256 | 1 | 0 | 4 | N/A | N/A |
| T2 mapping MSME | 10,000/10a (32 TEs) | 430 × 430 | 128 × 128 | 2 | 0 | 1 | N/A | N/A |
| T1 mapping VTR RARE | 280a/5.95 (10 TRs) | 430 × 430 | 128 × 128 | 2 | 0 | 1 | 2 | N/A |
| DWI | 4000/40 | 430 × 430 | 128 × 128 | 2 | 0 | 1 | N/A | 0, 150, 500, 1000, 1500 |
FLASH, fast low‐angle shot; RARE, rapid acquisition with refocused echoes; MSME, multi‐slice multi‐echo; VTR, variable TR; DWI, diffusion‐weighted imaging; TR, repetition time; TE, echo time; NSA, number of signal averages.
Smallest TR/TE.
2.G. Histopathological analysis
Prostate specimens were submitted for gross and histologic examination. All prostates were fixed in 10% buffered formalin (Fisher Scientific, Hampton, NH) and sectioned axially at 4‐mm thickness to match 9.4 T MRI slices. Processed paraffin blocks were sliced at 4‐μm thickness and stained with hematoxylin and eosin (H&E). Slides of the whole mount prostate sections were reviewed by a board‐certified pathologist, who delineated the outer boundary of the thermal coagulation zone. Slides were then imaged with a high‐resolution desktop scanner and lesion sizes were computed as the entire area within the thermal coagulation boundary. Errors in lesion size, T1 CNR, and are given in Table S1. Errors in lesion sizes determined via thermal dose, 55°C isotherms, DCE NPAs, and histology are given in Table S2.
2.H. Statistical analysis
Maximum CNRs across axial sections, lesion areas determined from histology, and equilibrium temperatures () calculated as described above were compared between lesions generated at saline, sUPE, and sUPE with Optison injection sites using Wilcoxon signed‐rank tests. Correlation between areas measured with histological visualization of the lesion, DCE NPAs, 55°C isotherms, and thermal dose maps was assessed using Pearson's correlation coefficient. Differences between areas measured using imaging metrics and the ground truth area measured via histology (i.e., bias in the imaging estimates) were assessed using Wilcoxon signed‐rank tests. Correlation between related variables (such as and ) was also assessed using Pearson's correlation coefficient, and variables found to be significantly correlated with another were excluded from Wilcoxon tests. Canine 3 was excluded from all analysis as a notably higher Gd2O3 concentration was employed than in other subjects. The overall significance level for statistical analysis was chosen as = 0.05. Bonferroni correction for multiple comparisons was applied to all pairwise tests among the three treatment arms and the repeated comparisons between histology and methods of ablation measurement (NPAs, 55°C isotherms, and thermal dose boundaries), resulting in a corrected significance level of = 0.0167 for these tests.
3. Results
3.A. Insonation
A total of 15 insonations (one per administered injection listed in Table 3) were performed in six canines. Three to five active elements were utilized with 3.7 W to 4.2 W acoustic power per element (spatial peak, temporal peak negative pressures of 2.5–2.8 MPa). The pulse duration was between 2 and 10 min depending on the prostate size and tissue heating rate. The time required to heat the control point to 56°C for the first excitation was set as the pulse duration for a given canine. Pulse durations were capped at 5 min to avoid wear on the applicator for subjects 2–6.
Table 3.
Details of experimental and injection parameters for each procedure
| Canine | sUPE % Gd by weight (%) | sUPE injection concentration (mg/mL) | sUPE‐only injection administered? | sUPE + Optison injection administered? | Sham (saline) injection administered? |
|---|---|---|---|---|---|
| 1 | 5.4 | 1.2 | Yes | No | Yes |
| 2 | 5.4 | 1.5 | Yes | Yes | Yes |
| 4 | 5.4 | 1.2 | Yes | Yes | Yes |
| 5 | 5.0 | 1.6 | Yes | Yes | Yes |
| 6 | 4.0 | 2.0 | Yes | Yes | Yes |
All injections were 1 mL in volume. sUPE with Optison and sUPE‐only injections had the same sUPE concentration when both were administered. Canine 1 was administered only saline and sUPE‐only injections. Canine 3 was excluded from all analysis, as it was only administered one injection with a notably higher Gd2O3 concentration than the other subjects.
3.B. Histopathology
Ultrasound‐induced lesions were clearly demarcated in stained histological slides of the prostates (Fig. 4). Treatments including sUPEs often exhibited a thermally coagulated rim of nearly complete epithelial sloughing and cell death surrounding a heat‐fixed central area39, 45, 46 that showed little to no epithelial sloughing, where all cells appeared nucleated. The frequency of thermal fixation among different treatment arms was compared using Fisher's exact test. Fisher's exact test was also used to assess the relationship between incidence of thermal fixation, hypointensity on in vivo T2W imaging, and ring‐shaped restricted diffusion on ex vivo diffusion‐weighted imaging. Differences in T1 contrast, the temperature parameter , and the histological lesion size between non‐heat‐fixed and heat‐fixed lesion groups were analyzed using Mann–Whitney U tests. Although thermal fixation was more common in the two experimental treatment arms, no significant difference in frequency of thermal fixation was observed between the three arms (P > 0.0167). Heat‐fixed lesions had significantly larger histologic areas (P =0.002) and greater temperature parameters (P =0.004) but did not differ significantly in T1 contrast (P > 0.05).
Figure 4.
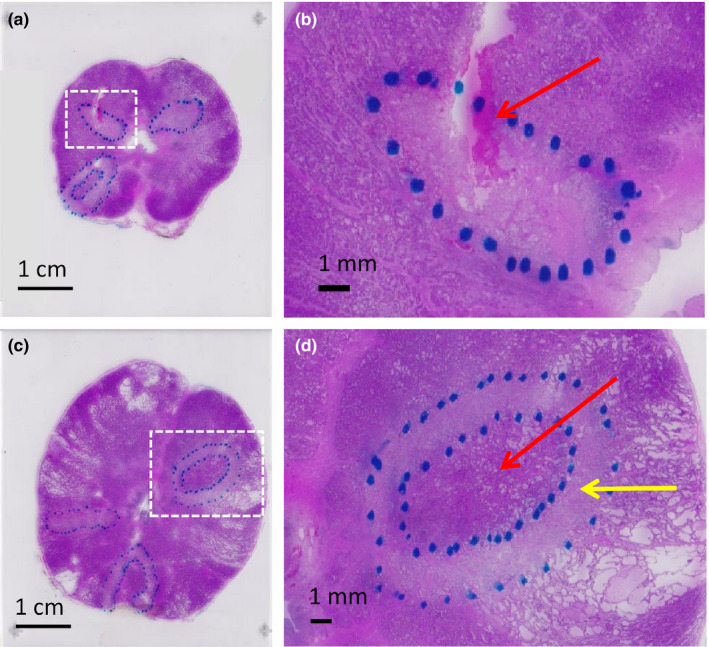
H&E stained histologic slides from central slices of (a) subject 5 and (c) subject 6. Coagulative necrosis zones (outlined with dashed blue marker) were apparent as pale regions (yellow arrow in d) that sometimes surrounded heat‐fixed areas, where little to no epithelial sloughing or cell death was apparent (red arrow in d). Near‐complete cell death and epithelial sloughing were visible in non‐heat‐fixed coagulative necrosis zones. A hemorrhagic area is visible as a magenta‐stained region (yellow arrow in b). [Color figure can be viewed at wileyonlinelibrary.com]
3.C. 3T MRI and iSuite
The alternating real‐time acquisition of orthogonal image planes via the iSuite interface enabled accurate placement of both the US applicator and the needle tip in the prostate (Figs. S1 and S2). Treatment monitoring via the iSuite interventional imaging system allowed real‐time tracking of temperature and thermal dose. Interactive adjustment of image slice positions and orientations enabled easy alignment of image planes with the applicator and ultrasound beam path. Placement of reference markers at injection sites and control points allowed tracking of exact temperatures and thermal doses in real time, ensuring timely shutoff of the applicator. MR thermography images and dose maps showed that heated areas corresponded well to the positions of therapy markers placed prior to treatment (Fig. 2). Temperature uncertainty was ±1°C.
Injection boluses were not visible on T2W‐imaging in 12 of the 15 insonations [Fig. S3(e)] or on T1W‐imaging post‐injection for any insonation. The appearance of treatment zones on post‐insonation MR images varied with treatment arm. Table 4 summarizes the qualitative observations from 3T imaging, 9.4 T imaging, and histological assessment of treated tissue. Uniform hyperintensity or no change was observed in insonation zones in posttreatment T1W images for all treatment arms [Figs. S3(a), S3(b)]. Hyperintensity or no change was observed in T2W images for saline sham treatments. T2W image hypointensity at the centers of ablation zones only occurred in the experimental arms and was more frequent among lesions with heat‐fixed tissue [Figs. S3(c), S3(d)]. In the saline sham arm, ADC was either uniformly decreased within the treatment zone or unchanged after insonation. In some experimental treatments, small areas of unchanged diffusion [red arrow in Fig. 5(b)] could be seen at the center of regions of restricted diffusion [yellow arrow in Fig. 5(b)]. This feature tended to correspond with heat‐fixed lesions. Uniform areas of restricted diffusion exhibited ADC values of 1.0 ± 0.1 mm2/ms, compared with 1.6 ± 0.2 mm2/ms in uniform areas of untreated tissue. In all treatment arms, non‐perfused regions were clearly delineated in DCE images through a distinct lack of contrast uptake [Fig. 5(a)]. Delayed enhancement was often seen in the periphery of NPAs as the DCE sequence progressed. Areas surrounding the non‐perfused tissue showed increased contrast agent uptake compared with untreated prostate tissue, suggesting a hyperemic rim surrounding the acute area of thermal necrosis.18 Good agreement was observed qualitatively between the positions of lesions in histological slides, NPAs on DCE imaging, areas of reduced diffusion on DWI, and thermal dose maps produced by iSuite (Fig. 5). There was no qualitative difference in detectability of the treated region between treatment arms for any post‐therapy 3T MR imaging modality.
Table 4.
Key qualitative observations from histology, in vivo post‐therapy 3T MR imaging, and ex vivo 9.4 T MR imaging for each treatment
| Histological observation | |||
|---|---|---|---|
| Untreated tissue | Non‐heat‐fixed lesions | Heat‐fixed lesions | |
| Appearance on H&E stain | Nucleated cells, intact epithelium | Contiguous region of near‐complete epithelial sloughing and cell death | Heat‐fixed area resembling untreated tissue, surrounded by boundary of near‐complete epithelial sloughing and cell death |
| Appearance on 3T post‐therapy imaging (compared with pre‐therapy imaging) | |||
| T1W imaging | No change | Hyperintense or no change | Hyperintense |
| T2W imaging | Slightly hyperintense or no change | Hyperintense or no change | Hypointense (or hypo‐ and hyperintense) or no change |
| ADC | No change | Decreased or no change | Decreased; central area of unchanged ADC in some cases |
| Appearance on 9.4 T imaging, (compared with untreated tissue) | |||
| T1 | N/A | Decreased; spatially varying changes in some cases | Decreased; spatially varying changes in some cases |
| T2 | N/A | Increased or no change; spatially varying changes in some cases | Increased or no change; spatially varying changes in some cases |
| ADC | N/A | Decreased or no change | Decreased or no change; ring‐shaped area of reduced ADC in most casesa |
Figure 5.

3T in vivo posttreatment imaging and histology for evaluation of therapy. MR scan parameters for (a) the DCE 3D FFE sequence, (b) the DWI EPI sequence, and (d) the 2D FFE temperature mapping sequence are given in Table 1. (a) DCE image: Non‐perfused region is noted via a red arrow. Enhancing rim surrounding the lesion is noted via a yellow arrow. (b) ADC map (scale 0–3 mm2/ms): Restricted diffusion is marked by a yellow arrow. Small region of unaffected diffusion (possibly indicating thermal fixation) is marked by a red arrow. (c) H&E stained prostate section: Area of thermal fixation at center of lesion with normal stained appearance is indicated by a red arrow. The area of apparent coagulative necrosis (non‐heat‐fixed) is characterized by a pale color and exhibits epithelial cell sloughing and death, indicated by a yellow arrow. (d) Thermal dose map (scale 0–240 CEM 43): Dark red corresponds to a dose of 240 CEM 43 or greater. Treatment arm is sUPEs only. All posttherapy imaging was acquired 5 min after MR thermometry indicated the treatment zone had returned to 37–39°C. [Color figure can be viewed at wileyonlinelibrary.com]
3.D. Ex vivo 9.4 T MRI
High‐resolution 9.4 T MR images of the ex vivo canine prostate tissue indicated increased T2, decreased T1, and reduced diffusion in the TULSA lesions compared with untreated tissue (Fig. 6). Spatially varying changes indicating a subtle ring shape were observed in T1 and T2 maps for 8 and 4 of 14 cases, respectively. Spatially varying changes were more frequent in the experimental treatment arms and in heat‐fixed lesions. For 6 of 14 cases, the ADC at the lesion center was unchanged or increased compared with untreated tissue, while the ADC at the lesion periphery was reduced [Fig. 6(c), red and yellow arrows]. This feature was only observed for lesions generated with TULSA insonation of sUPEs or sUPEs with Optison, and was significantly more frequent among heat‐fixed lesions (P = 0.005). In these cases, ADC values outside of treatment zones varied depending on tissue structure and fluid content, but ADCs in heat‐fixed areas (0.73 ± 0.13 mm2/ms) were relatively uniform and consistently larger than those in non‐heat‐fixed coagulation zones (0.40 ± 0.13 mm2/ms). In canine 4, lesions exhibited small central regions of very high diffusion, high T2 and low T1, which histology confirmed to be hemorrhagic.
Figure 6.

9.4 T ex vivo MRI images of canine prostate after in vivo treatment. MR scan parameters for (a) the T2W TURBO‐RARE sequence, (b) the T2 mapping MSME sequence, (c) the DWI sequence, (d) the T1W FLASH sequence, and (e) the T1 mapping VTR RARE sequence are given in Table 2. (a) T2W TURBO‐RARE image, (b) T2 map (scale 0–120 ms), (c) ADC‐map (scale 0–2 mm2/ms), (d) T1W FLASH image, (e) T1 map (scale 0–2500 ms), and (f) H&E stained histological slide of the same axial prostate section. The three lesions are located roughly at the 5 o’ clock (sUPE with Optison injection), 7 o’ clock (sUPE injection), and 11 o’ clock (saline sham injection) positions in the prostate, indicated by the red arrows in f. The red arrows in c indicate lesions with rims of reduced ADC surrounding central regions of unchanged ADC; the yellow arrow indicates a lesion with uniformly reduced ADC. [Color figure can be viewed at wileyonlinelibrary.com]
3.E. Comparison of sUPEs, sUPEs with Optison, and saline sham
Three metrics were compared among treatment arms: T1 CNR, area of ablation, and equilibrium temperature [T Eq in Eq. (2)]. For each individual metric, no significant differences were observed among treatment arms (Fig. 7; Fig. S4). Treatment arms containing sUPEs had a wider range of lesion sizes and temperatures than the saline sham arm.
Figure 7.

Comparison of treatments administered with saline, sUPEs only, and sUPEs with Optison (sUPEs + Opti). (a) Largest CNR in lesion ROI over all axial slices, as defined in Eq. (1). (b) Histological lesion size at most prominent axial slice. Red lines indicate medians, and blue boxes indicate interquartile ranges for each treatment group. Data points from the same canine are connected with black lines. No significant differences were observed between the three groups for CNR or lesion size. Only canines receiving all three treatments are included. [Color figure can be viewed at wileyonlinelibrary.com]
3.F. Comparison of lesion areas using histology, DCE MRI, and MR thermometry
Table 5 lists the measured areas of histological lesions, DCE NPAs, 55°C isotherms, and 240 CEM43 dose boundaries. Table 6 gives Pearson correlation coefficients (r) computed between histology and the three imaging‐based methods of ablation zone measurement. The computed correlation coefficients between the histological lesion area and MR imaging metrics (DCE NPAs, 55°C isotherms, and CEM43 dose boundaries) ranged from 0.91 to 0.99 for arms containing sUPEs (N = 4 per arm). For sham arms lacking sUPEs, these correlations ranged from 0.50 to 0.69 (N = 4). For any given treatment arm (N = 4), the lesion areas ascertained via H&E, NPAs, 55°C isotherms, and thermal dose were not significantly different.
Table 5.
Lesion areas as determined by histology, DCE NPAs, 55°C isotherms, and thermal dose
| Treatment | Canine | Histological lesion area (cm2) | Non‐perfused area (cm2) | 55°C isotherm area (cm2) | 240 CEM43 area (cm2) |
|---|---|---|---|---|---|
| Saline | 2 | 0.48 | 0.41 | 0.85 | 1.27 |
| 4 | 0.20 | 0.29 | 0.34 | 0.60 | |
| 5 | 0.35 | 0.27 | 1.03 | 1.64 | |
| 6 | 0.32 | 0.21 | 0.01 | 0.15 | |
| sUPEs only | 2 | 1.05 | 1.04 | 1.48 | 1.97 |
| 4 | 0.15 | 0.13 | 0.22 | 0.49 | |
| 5 | 0.23 | 0.36 | 0.30 | 0.37 | |
| 6 | 0.90 | 0.84 | 1.00 | 1.05 | |
| sUPEs + Optison | 2 | 0.93 | 1.06 | 1.66 | 1.89 |
| 4 | 0.03 | 0.03 | 0.00 | 0.04 | |
| 5 | 0.48 | 0.64 | 0.88 | 1.05 | |
| 6 | 0.69 | 1.11 | 1.28 | 1.48 |
Only canines receiving all three treatments are included.
Table 6.
Pearson correlation coefficients (r) from tests of correlation between lesion sizes from histology, DCE NPAs, 55°C isotherms, and thermal dose measurements
| Saline (n = 4) | sUPEs (n = 4) | sUPEs + Optison (n = 4) | All arms (n = 12) | |
|---|---|---|---|---|
| Histology/DCE NPA | ||||
| r (Pearson) | 0.69 | 0.99 | 0.96 | 0.93a |
| Histology/55°C isotherm | ||||
| r (Pearson) | 0.54 | 0.98 | 0.99 | 0.89a |
| Histology/thermal dose | ||||
| r (Pearson) | 0.50 | 0.91 | 0.99 | 0.81a |
Values are separated by treatment arm (injection). Only canines receiving all three treatments are included.
Significant correlation between the areas computed using the two listed methods.
When combining all treatment arms (N = 12), significant correlations were observed between areas measured via histology and each of the three imaging metrics examined: DCE MRI, 55°C isotherms, and thermal dose (P < 0.002). Areas measured via histology and DCE MRI were not significantly different when combining all treatment arms (P = 0.47). Areas of 55°C isotherms were 1.4 ± 0.8 times larger than histological areas (P = 0.009). Areas measured via thermal dose were 2.2 ± 1.1 times larger than those measured via histology (P = 0.003). Figure 8 plots the areas measured with histology, DCE MRI, 55°C isotherms, and thermal dose for each treatment arm and gives linear fits and correlation coefficients between each pair of methods.
Figure 8.

Correlation of measured ablative areas from histology and 3T in vivo MR imaging estimates. (a) Non‐perfused area in DCE images as a function of histological lesion area. (b) Area within 55°C isotherm as a function of histological lesion area. (c) Area of thermal dose ≥ 240 CEM 43 as a function of histological lesion area. Slopes of linear fits are given as the fitted slope and 95% confidence interval (in brackets). Error bars in histological areas and NPAs are standard deviations of triplicate measurements. Error bars in 55°C isotherms and thermal dose measurements were computed by propagating the temperature uncertainty, as described in the methods. Only canines receiving all three treatments are included. [Color figure can be viewed at wileyonlinelibrary.com]
4. Discussion
The purpose of this study was to quantify TULSA insonation of sUPEs via T1 contrast, morphology of prostate ablation, and imaging‐based treatment assessment in a canine prostate model. To assess transition of the sUPEs, the MR contrast agent Gd2O3 was incorporated into the PFP liquid. No significant differences in T1 contrast were observed in the insonation zone between treatment arms, indicating limited transition of the sUPEs, although the sample size limits interpretation of these results. Qualitatively, no clear enhancement in T1W images was observed that was specific to the experimental arms and could be attributed to MR contrast from transitioned sUPEs. The transition of phase‐shift emulsions is a threshold phenomenon.47 The spatial peak, temporal‐peak negative pressure of the ultrasound array used in this study was approximately 2–2.2 MPa. This pressure is near the threshold to transition protein‐shell UPEs,47 but the silica shell may act to increase the threshold for sUPE transition. T1 contrast is highly dependent on the concentration of Gd, and hence, a limited number of transitioned sUPEs would not be apparent on T1W images.
Physical properties of the MR contrast particles can affect the T1 contrast. Park et al.48 and Rahman et al.49 showed that Gd2O3 nanoparticles with diameters in the range of 1–2.5 nm exhibit the greatest T1‐relaxivity. Ahrén et al. explored surface functionalization and dialysis of Gd2O3 nanoparticles and found that PEGylated Gd2O3 nanoparticles, when dialyzed for 6 days, exhibit T1‐relaxivities over twice as high as uncapped nanoparticles and over four times higher than Gd‐DTPA chelates.50 Although the nanoparticles used in this study were approximately 2 nm in diameter, the lack of surface ligands may have allowed for surface charge and consequent particle aggregation, reducing the effective T1‐relaxivity. Furthermore, the nanoparticles may sinter with one another and with the inner wall of the silica shells during the calcination process. The MR contrast formulation encapsulated by the sUPEs should be refined in future work to maximize T1 contrast efficiency (and thus minimize the dose required per procedure) and establish an acceptable toxicity profile. The presence of residual microbubbles following insonation and sUPE transition may also have introduced confounding susceptibility effects,51, 52 masking signal enhancement from exposed Gd2O3. A bubble‐deleting pulse of ultrasound applied between ablation and MR imaging may help to mitigate this effect.53
Only minimal movement of sUPEs was expected in tissue, as similar sUPEs were found to persist spatially in flank tumors in vivo for four days, even after multiple Doppler imaging acquisitions with peak negative pressures of approximately 5 MPa.26 In contrast, the studies here were conducted over the course of several hours. Some degree of diffusion or washout of the particles may have still taken place during therapy and imaging, reducing the concentration present in the tissue. Radiation force from the TULSA insonation may have exacerbated this effect, pushing and dispersing the injection bolus.54 This dispersion could explain the apparent nonlocalized enhanced heating in the experimental treatment arms. Difficulties in visualizing and confirming injection sites also underscore the need for an IV injection and targeted sUPEs that accumulate preferentially at tumor locations. A study involving intravenous injection of similar 500‐nm particles has demonstrated uptake and retention in LnCAP prostate tumors implanted in the flanks of mice for an average of 3.3 days.55 When tumor‐specific folate functionalization was added, the particles’ in vivo lifetime was extended to 12 days.55
To increase the likelihood of sUPE transition with the TULSA device, a treatment arm combining sUPEs with Optison microbubbles was explored. Ultrasound exposure of microbubbles induces strong cavitation activity.56 Under the proper insonation conditions,57 inertial cavitation associated with strong acoustic emissions can be induced58 that may trigger sUPE transition. No change in T1‐signal, heating rate, or ablation zone size was observed in this study in the presence of sUPEs or Optison, although experimental arms exhibited a wider range of lesion sizes and temperatures. Observations of thermal fixation were more frequent in sUPEs and sUPEs with Optison treatment arms, possibly indicating an enhanced heating mechanism resulting from cavitation activity of microbubbles or transitioned sUPEs. Limited microbubble activity likely occurred temporally throughout the insonation, however, as the pressure amplitude was sufficient to result in rupture of the shelled microbubbles.57 The onset of shell rupture is concurrent with microbubble dissolution and loss of echogenicity,59 indicating loss of prompt cavitation nuclei to induce inertial cavitation. Further studies are required to quantify the type and dose of cavitation activity from TULSA exposure of microbubbles, and to devise insonation schemes for sustained cavitation activity.60, 61
While a limited number of sUPEs were likely transitioned, they had a marked effect on the lesion morphology. All lesions consisted of contiguous areas of nonviable tissue. Six of nine treatments including sUPEs and one of five saline sham treatments exhibited tissue that was thermally fixed.39, 45, 46 This “heat‐fixed” tissue has a paradoxically untreated appearance on H&E staining. In contrast, other biomarkers such as triphenyl tetrazolium chloride (TTC) or cytokeratin 8 (CK8) have been shown to indicate nonviability of heat‐fixed tissue.39, 62 In addition to being more frequent in the experimental treatment arms, the presence of thermal fixation correlated significantly with larger lesions and higher therapeutic temperatures, indicating that the presence of sUPEs could enhance heat deposition with TULSA. Intravenous injection of functionalized or ligand‐targeted sUPEs may improve the specificity of sUPEs for prostate cancer tissue,55, 63 enhancing TULSA ablation of target areas. Increased absorption by sUPEs would also shield distal structures, allowing extension of treatment margins around the target. However, the wide range of lesion sizes and temperatures observed for the experimental arms indicates that therapeutic enhancement imbued by sUPEs may come at a cost of reduced consistency in treatment outcome. This inconsistency may stem from the stochastic nature of droplet transition or from excess shielding of the acoustic field from transitioned droplets or microbubbles.29 Such variable therapeutic efficacy could increase the risk of untreated residual disease, although the areas of ablation zones are still reliably assessed via MR imaging metrics (see Fig. 8). Previous studies have found that bubble activity from droplets or microbubbles can provide controlled heating21, 23, 24, 29, 64 and can be monitored with passive ultrasound imaging techniques.65 In order to reduce the inconsistencies in the experimental treatment arms observed in this study, the acoustic output should be modulated based on feedback of cavitation activity via passive cavitation imaging,66, 67, 68 plane wave B‐mode imaging,69, 70, 71 or color Doppler imaging.72, 73
The observation of thermal fixation with histology was related to some qualitative features of T2W and diffusion‐weighted imaging, suggesting that such enhanced heating could be ascertained in vivo, independently from histopathological analysis. In particular, both in vivo and ex vivo ADC maps indicated that heat‐fixed tissue did not always exhibit reduced diffusion as non‐heat‐fixed ablated tissue did. ADC values for both untreated and thermally necrosed tissue in vivo agreed with those reported by Chen et al.74 and Pauly et al.41 However, the observed pattern was contrary to these studies, in which contiguous regions of reduced diffusion were observed post‐therapy, even when thermal fixation was present.41, 74 Decreases in T2W image intensity have been previously reported following thermal ablation of the prostate but with little consistency across treatments, and no clear delineation of treatment boundaries.18 The results of this work suggest that T2W image hypointensity corresponds with thermal fixation and is therefore only likely to be observed for rapid heating of tissue to high temperatures. However, T2W images were difficult to interpret in highly cystic prostates.
In this study, we observed a significant correlation between standard imaging benchmarks (DCE NPAs, 55°C isotherms, and thermal dose boundaries) and histology when considering all treatment arms together. Correlation coefficients ranged from 0.50 to 0.69 for the sham arm, and 0.91–0.99 for arms involving sUPEs. The areas of lesions generated in the saline sham arm were within 0.20–0.48 cm2, providing a smaller range over which to compute the correlation in comparison to arms including sUPEs (0.03–1.05 cm2). In a similar study, Partanen et al. found a significant correlation between the ablation zone, DCE NPA, and thermal dose induced via TULSA in the absence of any pretreatment injection.13 However, Partanen et al. stained prostate tissue samples with CK8, which would modify the observed lesion morphology compared to the H&E stain utilized in this study.75
MR thermometry measurements in this work exhibited some discrepancies with previous studies. When considering all treatment arms, non‐perfused regions were only 10% larger on average than ablated areas on histology, while estimates of lesion sizes based on 55°C isotherms and 240 CEM43 dose boundaries were approximately 1.4 and 2 times as large as histological measurements, respectively. Several studies in canines have reported good agreement between 240 CEM43 dose boundaries, 52°C isotherms, and thermal coagulation assessed histologically, but many observations are only qualitative.41, 76 Previous studies have also denoted an outer boundary of delayed cell kill in histopathological sections of prostates treated with TULSA, suggesting a time dependence for complete lesion formation.12, 38, 39 These works report agreement between histologically necrotic tissue, 240 CEM43 dose boundaries, and lower temperature isotherms (50–52°C) 24–48 h after treatment in canines. Burtnyk et al.12 list 240 CEM43 as the thermal dose corresponding to delayed cell kill, rather than acute coagulation. Therefore, some discrepancy between acute histology and 240 CEM43 of thermal dose is expected. While the 55°C isotherm has been shown to accurately predict the extent of thermal coagulation in the prostate,11, 12, 38 some degree of patient‐specific variation has been observed. Chopra et al. showed agreement between 103.9 CEM43 dose boundaries, 56.2°C isotherms, and the coagulation boundary in canines.38 Chopra et al. also reported average peak temperatures ranging from 49 to 56°C and doses of 110–17,000 CEM43 at the acute damage boundary across only eight human subjects.11 In the work presented here, non‐rotational ablations were applied, which may complicate thermometry estimation compared with ablation of large sectors or whole glands. Indeed, a similar overestimation of statically ablated volume was recorded by Partanen et al.,13 in which thermal dose estimates were 1.5–2 times greater than histological volumes, DCE NPVs, and volumes of reduced diffusion on DWI. The histological measurements in the current study did not account for shrinkage of the excised tissue, which may have resulted in smaller histological lesion areas. Additionally, during some insonations, slight prostate displacements occurred due to peristalsis, which could induce errors in temperature measurement. No apparent sudden changes in the temperature distribution of the treatment zone were observed during these movements.
The presence of an MR contrast agent can produce local susceptibility effects, confounding the estimated temperature measurement.77, 78 No discrepancies between MR thermometry and other methods of treatment assessment that were specific to the experimental arms were observed in this study. For the concentrations of Gd2O3 employed in this study, the error in the temperature measurements would be less than 1°C based on data reported by Hijnen et al.77 However, these results refer to aqueous contrast agent and do not necessarily reflect the errors associated with the use of Gd2O3 nanoparticles.
The frequency of the 3.75‐MHz prototype TULSA system employed in these studies could not be modified due to hardware limitations. Simulation and phantom studies have demonstrated that dual‐frequency transducers offer better coverage and more precise, rapid ablation than single‐frequency devices.79 Previous canine studies have primarily utilized frequencies ranging from 6 to 9 MHz to achieve successful ablations with minimal far field heating.13, 14, 38, 41 Inhomogeneous ablation can be observed for static 4‐MHz excitations (20 W/cm2 acoustic power) when treating prostate radii less than 16 mm.80, 81 This, combined with the known decrease in droplet transition threshold pressure with increasing frequency,47 indicates that the use of a low frequency device may have contributed to the variability observed in this study. The use of higher frequency or multifrequency devices would likely improve treatment consistency and more effectively transition sUPEs for therapeutic enhancement.47, 81 Future studies should explore the most clinically appropriate acoustic field based on the disease morphology.
Treatment planning and monitoring were conducted via the iSuite interventional system, which has not previously been utilized with a TULSA device. The iSuite prototype was designed for device guidance during interventions. Simultaneous temperature mapping can be achieved in up to three parallel slices. To better monitor and estimate the entire volume of ablative thermal dose, processing of flexible arrangements of multi‐slice thermography sequences should be implemented. Currently, most therapy guidance platforms cannot be immediately integrated with TULSA treatment planning software and delivery systems, requiring manual adjustment of therapeutic insonation. Such integration would allow automatic modulation and shutoff of applicator elements based on temperature feedback from the thermometry measurements, ensuring safer, more conformal delivery of thermal dose to the prostate. Nonetheless, the iSuite platform enabled easy localization of the TULSA applicator and injection needle and effective treatment planning and monitoring. In the clinic, iSuite could be utilized to guide placement of the TULSA applicator and endorectal cooling device in real time, or to guide prostate tissue biopsies.
This study contains several limitations. The small number of subjects used (six animals, 15 insonations) limits the reliability of statistical analysis. For all applications of the TULSA device (ten insonations in six subjects), appreciable change in T1 contrast was not observed and a lack of consistency in therapeutic outcome was noted. Thus, studies were suspended. This work reports the results of TULSA ablation of healthy canine prostate tissue, which may not reflect treatment response in a cancer model. The direct injection of sUPEs also does not replicate an IV infusion, in which case the sUPEs may require surface modification and additional delay time between injection and therapy in order to ensure sufficient accumulation in the target tissue.
While insonation of sUPEs in this work may indicate therapeutic enhancement, further study is required to optimize sUPEs’ therapeutic and contrast properties. Some MR imaging features in this study suggest that enhanced heating and thermal fixation could be visualized in vivo, even if sUPE transition is not directly apparent. The differences observed between histological measurements of the lesion area and MR thermometry‐based metrics in this study indicate a need for more robust tools for TULSA treatment monitoring and assessment. Future studies should investigate sUPE transition with TULSA insonation schemes to determine the optimal parameters for consistent droplet transition and therapeutic outcome. This study nonetheless shows promise for sUPE‐enhanced TULSA and demonstrates the utility of the iSuite interventional system in TULSA procedures. This work also suggests that MR imaging metrics for TULSA treatment evaluation are not compromised when performed in tandem with sUPE injection.
5. Conclusion
Silica‐shell phase‐shift emulsions were insonified in a canine prostate model to test their effect on therapy and on the ability to assess treatment outcome of TULSA prostate ablation. A novel MR interventional suite was used for image guidance and treatment evaluation. A significant correlation between histologically nonviable areas, MR thermometry‐based estimates, and DCE NPAs was observed when examining all treatment arms together. The presence of sUPEs did not diminish the accuracy of these metrics in estimating ablative areas. DCE NPAs provided the most accurate estimate of acute cell death following TULSA therapy, with 55°C isotherms and 240 CEM43 dose boundaries overestimating histological lesion sizes by a factor of 1.4 and 2.2, respectively. The lesion morphology was also modified for arms containing sUPEs compared with saline alone, indicating more frequent thermal fixation due to rapid heating that correlated with some imaging metrics. While this may indicate enhanced heat deposition by sUPEs, lesion sizes and temperatures were less consistent in these arms and did not indicate more localized heating than the saline arm. T1 contrast indicating sUPE transition was also not apparent. Further studies are thus required to ascertain the mechanism of action of these particles and optimize their therapeutic and diagnostic properties. However, these results indicate that an exogenous agent may be a key element in the improvement of TULSA therapy.
Conflicts of interest
Sarah Blair's spouse is cofounder, CEO, and has equity interest in Nanocyte Medical. Andrew Kummel and William Trogler are scientific advisors and have an equity interest in Nanocyte Medical. The terms of this arrangement have been reviewed and approved by the University of California, San Diego, in accordance with its conflict of interest policies. Sascha Krueger and Steffen Weiss are employed by Philips and receive full‐time salary.
Supporting information
Fig. S1. Orthogonal in vivo 3T MR images [(a) axial, (b) coronal, and (c) sagittal] showing placement of ultrasound applicator using iSuite interface.
Fig. S2. Orthogonal in vivo 3T MR images [(a) axial, (b) coronal, and (c) sagittal] from iSuite interface showing insertion of biopsy needle for particle injection into the prostate.
Fig. S3. 3T in vivo T1W and T2W images of the prostate before and after therapy.
Fig. S4. Comparison of T Eq as defined in Eq. (2) for treatments administered with saline, sUPEs only, and sUPEs with Optison.
Table S1. Errors in histological lesion size (standard deviation of triplicate measurements), T1 CNR (standard deviation in CNR over slices with apparent T1 enhancement), and fitted parameter T Eq (standard deviation over all fitted pixels).
Table S2. Lesion areas as determined by thermal dose, 55 °C isotherms, DCE NPAs, and histology.
Acknowledgments
We acknowledge and thank the iSAIRR Core Facility, the MRIS Research facility, the MRIRC research core, the University of Chicago Animal Resource Center, the Carlson Facility, and Bracco Diagnostics for their support on this project. This work was supported in part by the National Institutes of Health Grants R25CA132822, R25NS080949, S10OD018448, K12CA139160, U54CA132379, T32EB002103 (Greg Anthony), and T32CA153915 (James Wang), the National Institutes of Health National Cancer Institute under Grant R33CA177449, the Cancer Research Foundation, Nanocyte Medical, the University of Chicago Comprehensive Cancer Center under Grant P30CA014599, a grant of Philips Healthcare, and the Paul C. Hodges Alumni Society of the Department of Radiology at the University of Chicago.
Steffen Sammet is the senior author on this work.
References
- 1. Siegel RL, Miller KD, Jemal A. Cancer statistics, 2016. CA. 2016;66:7–30. [DOI] [PubMed] [Google Scholar]
- 2. Cooperberg MR, Lubeck DP, Meng MV, Mehta SS, Carroll PR. The changing face of low‐risk prostate cancer: trends in clinical presentation and primary management. J Clin Oncol. 2004;22:2141–2149. [DOI] [PMC free article] [PubMed] [Google Scholar]
- 3. Tosoian JJ, Carter HB, Lepor A, Loeb S. Active surveillance for prostate cancer: current evidence and contemporary state of practice. Nat Rev Urol. 2016;13:205–215. [DOI] [PMC free article] [PubMed] [Google Scholar]
- 4. Eggener SE, Scardino PT, Walsh PC, et al. Predicting 15‐year prostate cancer specific mortality after radical prostatectomy. J Urol. 2011;185:869–875. [DOI] [PMC free article] [PubMed] [Google Scholar]
- 5. Sylvester JE, Grimm PD, Blasko JC, et al. 15‐year biochemical relapse free survival in clinical stage T1–T3 prostate cancer following combined external beam radiotherapy and brachytherapy; Seattle experience. Int J Radiat Oncol Biol Phys. 2007;67:57–64. [DOI] [PubMed] [Google Scholar]
- 6. Sanda MG, Dunn RL, Michalski J, et al. Quality of life and satisfaction with outcome among prostate‐cancer survivors. N Engl J Med. 2008;358:1250–1261. [DOI] [PubMed] [Google Scholar]
- 7. Resnick MJ, Koyama T, Fan KH, et al. Long‐term functional outcomes after treatment for localized prostate cancer. N Engl J Med. 2013;368:436–445. [DOI] [PMC free article] [PubMed] [Google Scholar]
- 8. Zini C, Hipp E, Thomas S, Napoli A, Catalano C, Oto A. Ultrasound‐ and MR‐guided focused ultrasound surgery for prostate cancer. World J Radiol. 2012;4:247–252. [DOI] [PMC free article] [PubMed] [Google Scholar]
- 9. Lukka H, Waldron T, Chin J, et al. High‐intensity focused ultrasound for prostate cancer: a systematic review. Clin Oncol. 2011;23:117–127. [DOI] [PubMed] [Google Scholar]
- 10. Chin JL, Billia M, Relle J, et al. Magnetic resonance imaging‐guided transurethral ultrasound ablation of prostate tissue in patients with localized prostate cancer: a prospective phase 1 clinical trial. Eur Urol. 2016;70:447–455. [DOI] [PubMed] [Google Scholar]
- 11. Chopra R, Colquhoun A, Burtnyk M, et al. MR imaging–controlled transurethral ultrasound therapy for conformal treatment of prostate tissue: initial feasibility in humans. Radiology. 2012;265:303–313. [DOI] [PubMed] [Google Scholar]
- 12. Burtnyk M, Hill T, Cadieux‐Pitre H, Welch I. Magnetic resonance image guided transurethral ultrasound prostate ablation: a preclinical safety and feasibility study with 28‐day followup. J Urol. 2015;193:1669–1675. [DOI] [PubMed] [Google Scholar]
- 13. Partanen A, Yerram NK, Trivedi H, et al. Magnetic resonance imaging (MRI)‐guided transurethral ultrasound therapy of the prostate: a preclinical study with radiological and pathological correlation using customised MRI‐based moulds. BJU Int. 2013;112:508–516. [DOI] [PMC free article] [PubMed] [Google Scholar]
- 14. Sammet S, Partanen A, Yousuf A, et al. Cavernosal nerve functionality evaluation after magnetic resonance imaging‐guided transurethral ultrasound treatment of the prostate. World J Radiol. 2015;7:521–530. [DOI] [PMC free article] [PubMed] [Google Scholar]
- 15. Chin JL, Relle J, Dewar M, et al. MP30‐03 MRI‐guided transurethral ultrasound ablation in patients with localized prostate cancer: 3‐year outcomes of a prospective phase I study. J Urol. 2018;199:e375. [Google Scholar]
- 16. Zhou Y‐F. High intensity focused ultrasound in clinical tumor ablation. World J Clin Oncol. 2011;2:8–27. [DOI] [PMC free article] [PubMed] [Google Scholar]
- 17. Vlaisavljevich E, Greve J, Cheng X, et al. Non‐invasive ultrasound liver ablation using histotripsy: chronic study in an in vivo rodent model. Ultrasound Med Biol. 2016;42:1890–1902. [DOI] [PMC free article] [PubMed] [Google Scholar]
- 18. Hazle JD, Diederich CJ, Kangasniemi M, Price RE, Olsson LE, Stafford RJ. MRI‐guided thermal therapy of transplanted tumors in the canine prostate using a directional transurethral ultrasound applicator. J Magn Reson Imaging. 2002;15:409–417. [DOI] [PubMed] [Google Scholar]
- 19. Wijlemans JW, Deckers R, van den Bosch MA, et al. Evolution of the ablation region after magnetic resonance‐guided high‐intensity focused ultrasound ablation in a Vx2 tumor model. Invest Radiol. 2013;48:381–386. [DOI] [PubMed] [Google Scholar]
- 20. Jacobs I, Hectors SJ, Schabel MC, Grüll H, Strijkers GJ, Nicolay K. Cluster analysis of DCE‐MRI data identifies regional tracer‐kinetic changes after tumor treatment with high intensity focused ultrasound. NMR Biomed. 2015;28:1443–1454. [DOI] [PubMed] [Google Scholar]
- 21. Liberman A, Wu Z, Barback CV, et al. Hollow iron‐silica nanoshells for enhanced high intensity focused ultrasound. J Surg Res. 2014;190:391–398. [DOI] [PMC free article] [PubMed] [Google Scholar]
- 22. Liberman A, Mendez N, Trogler WC, Kummel AC. Synthesis and surface functionalization of silica nanoparticles for nanomedicine. Surf Sci Rep. 2014;69:132–158. [DOI] [PMC free article] [PubMed] [Google Scholar]
- 23. Chen Y, Chen H, Sun Y, et al. Multifunctional mesoporous composite nanocapsules for highly efficient MRI‐guided high‐intensity focused ultrasound cancer surgery. Angew Chem Int Ed Engl. 2011;50:12505–12509. [DOI] [PubMed] [Google Scholar]
- 24. Wang X, Chen H, Chen Y, et al. Perfluorohexane‐encapsulated mesoporous silica nanocapsules as enhancement agents for highly efficient high intensity focused ultrasound (HIFU). Adv Mater. 2012;24:785–791. [DOI] [PubMed] [Google Scholar]
- 25. Liberman A, Wu Z, Barback CV, et al. Color Doppler ultrasound and gamma imaging of intratumorally injected 500 nm iron‐silica nanoshells. ACS Nano. 2013;7:6367–6377. [DOI] [PMC free article] [PubMed] [Google Scholar]
- 26. Liberman A, Martinez HP, Ta CN, et al. Hollow silica and silica‐boron nano/microparticles for contrast‐enhanced ultrasound to detect small tumors. Biomaterials. 2012;33:5124–5129. [DOI] [PMC free article] [PubMed] [Google Scholar]
- 27. Liberman A, Wang J, LU N, et al. Mechanically tunable hollow silica ultrathin nanoshells for ultrasound contrast agents. Adv Funct Mater. 2015;25:4049–4057. [DOI] [PMC free article] [PubMed] [Google Scholar]
- 28. Feshitan JA, Vlachos F, Sirsi SR, Konofagou EE, Borden MA. Theranostic Gd(III)‐lipid microbubbles for MRI‐guided focused ultrasound surgery. Biomaterials. 2012;33:247–255. [DOI] [PMC free article] [PubMed] [Google Scholar]
- 29. Holt RG, Roy RA. Measurements of bubble‐enhanced heating from focused, MHz‐frequency ultrasound in a tissue‐mimicking material. Ultrasound Med Biol. 2001;27:1399–1412. [DOI] [PubMed] [Google Scholar]
- 30. Kopechek JA, Park E, Mei C‐S, McDannold NJ, Porter TM. Accumulation of phase‐shift nanoemulsions to enhance MR‐guided ultrasound‐mediated tumor ablation in vivo. J Healthc Eng. 2013;4:109–126. [DOI] [PMC free article] [PubMed] [Google Scholar]
- 31. Fan X, Haney CR, Agrawal G, et al. High‐resolution MRI of excised human prostate specimens acquired with 9.4T in detection and identification of cancers: validation of a technique. J Magn Reson Imaging. 2011;34:956–961. [DOI] [PubMed] [Google Scholar]
- 32. Bazzi R, Flores‐Gonzalez MA, Louis C, et al. Synthesis and luminescent properties of sub‐5‐nm lanthanide oxides nanoparticles. J Lumin. 2003;102:445–450. [Google Scholar]
- 33. Padhani AR, Gapinski CJ, Macvicar DA, et al. Dynamic contrast enhanced MRI of prostate cancer: correlation with morphology and tumour stage, histological grade and PSA. Clin Radiol. 2000;55:99–109. [DOI] [PubMed] [Google Scholar]
- 34. Rieke V, Pauly KB. MR thermometry. J Magn Reson Imaging JMRI. 2008;27:376–390. [DOI] [PMC free article] [PubMed] [Google Scholar]
- 35. Sapareto SA, Dewey WC. Thermal dose determination in cancer therapy. Int J Radiat Oncol Biol Phys. 1984;10:787–800. [DOI] [PubMed] [Google Scholar]
- 36. Goerner FL, Clarke GD. Measuring signal‐to‐noise ratio in partially parallel imaging MRI. Med Phys. 2011;38:5049–5057. [DOI] [PMC free article] [PubMed] [Google Scholar]
- 37. Stejskal EO, Tanner JE. Spin diffusion measurements: spin echoes in the presence of a time‐dependent field gradient. J Chem Phys. 1965;42:288–292. [Google Scholar]
- 38. Chopra R, Tang K, Burtnyk M, et al. Analysis of the spatial and temporal accuracy of heating in the prostate gland using transurethral ultrasound therapy and active MR temperature feedback. Phys Med Biol. 2009;54:2615. [DOI] [PubMed] [Google Scholar]
- 39. Boyes A, Tang K, Yaffe M, Sugar L, Chopra R, Bronskill M. Prostate tissue analysis immediately following magnetic resonance imaging guided transurethral ultrasound thermal therapy. J Urol. 2007;178:1080–1085. [DOI] [PubMed] [Google Scholar]
- 40. Dewey WC. Arrhenius relationships from the molecule and cell to the clinic. Int J Hyperthermia. 2009;25:3–20. [DOI] [PubMed] [Google Scholar]
- 41. Pauly KB, Diederich CJ, Rieke V, et al. Magnetic resonance‐guided high‐intensity ultrasound ablation of the prostate. Top Magn Reson Imaging. 2006;17:195–207. [DOI] [PubMed] [Google Scholar]
- 42. Volkov VV, Zhu Y. Deterministic phase unwrapping in the presence of noise. Opt Lett. 2003;28:2156–2158. [DOI] [PubMed] [Google Scholar]
- 43. Fennessy FM, Fedorov A, Gupta SN, Schmidt EJ, Tempany CM, Mulkern RV. QIN: practical considerations in T1 mapping of prostate for dynamic contrast enhancement pharmacokinetic analyses. Magn Reson Imaging. 2012;30:1224–1233. [DOI] [PMC free article] [PubMed] [Google Scholar]
- 44. Liney GP, Knowles AJ, Manton DJ, Turnbull LW, Blackband SJ, Horsman A. Comparison of conventional single echo and multi‐echo sequences with a fast spin‐echo sequence for quantitative T2 mapping: application to the prostate. J Magn Reson Imaging. 1996;6:603–607. [DOI] [PubMed] [Google Scholar]
- 45. Coad JE, Kosari K, Humar A, Sielaff TD. Radiofrequency ablation causes ‘thermal fixation’ of hepatocellular carcinoma: a post‐liver transplant histopathologic study. Clin Transplant. 2003;17:377–384. [DOI] [PubMed] [Google Scholar]
- 46. He X, McGee S, Coad JE, et al. Investigation of the thermal and tissue injury behaviour in microwave thermal therapy using a porcine kidney model. Int J Hyperthermia. 2004;20:567–593. [DOI] [PubMed] [Google Scholar]
- 47. Kripfgans OD, Fowlkes JB, Miller DL, Eldevik OP, Carson PL. Acoustic droplet vaporization for therapeutic and diagnostic applications. Ultrasound Med Biol. 2000;26:1177–1189. [DOI] [PubMed] [Google Scholar]
- 48. Park JY, Baek MJ, Choi ES, et al. Paramagnetic ultrasmall gadolinium oxide nanoparticles as advanced T1 MRI contrast agent: account for large longitudinal relaxivity, optimal particle diameter, and in vivo T1 MR images. ACS Nano. 2009;3:3663–3669. [DOI] [PubMed] [Google Scholar]
- 49. Anishur Rahman AT, Majewski P, Vasilev K. Gd2O3 nanoparticles: size‐dependent nuclear magnetic resonance. Contrast Media Mol Imaging. 2013;8:92–95. [DOI] [PubMed] [Google Scholar]
- 50. Ahrén M, Selegard L, Klasson A, et al. Synthesis and characterization of PEGylated Gd2O3 nanoparticles for MRI contrast enhancement. Langmuir. 2010;26:5753–5762. [DOI] [PubMed] [Google Scholar]
- 51. Weisskoff RM, Zuo CS, Boxerman JL, Rosen BR. Microscopic susceptibility variation and transverse relaxation: theory and experiment. Magn Reson Med. 1994;31:601–610. [DOI] [PubMed] [Google Scholar]
- 52. Kennan RP, Zhong J, Gore JC. Intravascular susceptibility contrast mechanisms in tissues. Magn Reson Med. 1994;31:9–21. [DOI] [PubMed] [Google Scholar]
- 53. Alavi Tamaddoni H, Roberts WW, Duryea AP, Cain CA, Hall TL. Enhanced high‐rate shockwave lithotripsy stone comminution in an in vivo porcine model using acoustic bubble coalescence. J Endourol. 2016;30:1321–1325. [DOI] [PMC free article] [PubMed] [Google Scholar]
- 54. Acconcia C, Leung BYC, Hynynen K, Goertz DE. Interactions between ultrasound stimulated microbubbles and fibrin clots. Appl Phys Lett. 2013;103:053701. [Google Scholar]
- 55. Wang J, Barback CV, Ta CN, et al. Extended lifetime in vivo pulse stimulated ultrasound imaging. IEEE Trans Med Imaging. 2018;37:222–229. [DOI] [PMC free article] [PubMed] [Google Scholar]
- 56. Dayton PA, Morgan KE, Klibanov AL, Brandenburger GH, Ferrara KW. Optical and acoustical observations of the effects of ultrasound on contrast agents. IEEE Trans Ultrason Ferroelectr Freq Control. 1999;46:220–232. [DOI] [PubMed] [Google Scholar]
- 57. Bader KB, Holland CK. Gauging the likelihood of stable cavitation from ultrasound contrast agents. Phys Med Biol. 2013;58:127. [DOI] [PMC free article] [PubMed] [Google Scholar]
- 58. Bader KB, Mobley J, Church CC, Gaitan DF. The effect of static pressure on the strength of inertial cavitation events. J Acoust Soc Am. 2012;132:2286–2291. [DOI] [PubMed] [Google Scholar]
- 59. Radhakrishnan K, Bader KB, Haworth KJ. Relationship between cavitation and loss of echogenicity from ultrasound contrast agents. Phys Med Biol. 2013;58:6541. [DOI] [PMC free article] [PubMed] [Google Scholar]
- 60. Hitchcock KE, Ivancevich NM, Haworth KJ, et al. Ultrasound‐enhanced rt‐PA thrombolysis in an ex vivo porcine carotid artery model. Ultrasound Med Biol. 2011;37:1240–1251. [DOI] [PMC free article] [PubMed] [Google Scholar]
- 61. Bader KB, Gruber MJ, Holland CK. Shaken and stirred: mechanisms of ultrasound‐enhanced thrombolysis. Ultrasound Med Biol. 2015;41:187–196. [DOI] [PMC free article] [PubMed] [Google Scholar]
- 62. Lindner U, Lawrentschuk N, Weersink RA, et al. Focal laser ablation for prostate cancer followed by radical prostatectomy: validation of focal therapy and imaging accuracy. Eur Urol. 2010;57:1111–1114. [DOI] [PubMed] [Google Scholar]
- 63. Kelly JM, Amor‐Coarasa A, Nikolopoulou A, et al. Dual‐target binding ligands with modulated pharmacokinetics for endoradiotherapy of prostate cancer. J Nucl Med. 2017;58:1442–1449. [DOI] [PubMed] [Google Scholar]
- 64. Zhang P, Porter T. An in vitro study of a phase‐shift nanoemulsion: a potential nucleation agent for bubble‐enhanced HIFU tumor ablation. Ultrasound Med Biol. 2010;36:1856–1866. [DOI] [PubMed] [Google Scholar]
- 65. Bader KB, Haworth KJ, Maxwell AD, Holland CK. Post hoc analysis of passive cavitation imaging for classification of histotripsy‐induced liquefaction in vitro. IEEE Trans Med Imaging. 2018;37:106–115. [DOI] [PMC free article] [PubMed] [Google Scholar]
- 66. Haworth KJ, Bader KB, Rich KT, Holland CK, Mast TD. Quantitative frequency‐domain passive cavitation imaging. IEEE Trans Ultrason Ferroelectr Freq Control. 2017;64:177–191. [DOI] [PMC free article] [PubMed] [Google Scholar]
- 67. GyÖngy M, Coussios CC. Passive spatial mapping of inertial cavitation during HIFU exposure. IEEE Trans Biomed Eng. 2010;57:48–56. [DOI] [PubMed] [Google Scholar]
- 68. Arvanitis C, Crake C, McDannold N, Clement G. Passive acoustic mapping with the angular spectrum method. IEEE Trans Med Imaging. 2017;36:983–993. [DOI] [PMC free article] [PubMed] [Google Scholar]
- 69. Gateau J, Aubry JF, Pernot M, Fink M, Tanter M. Combined passive detection and ultrafast active imaging of cavitation events induced by short pulses of high‐intensity ultrasound. IEEE Trans Ultrason Ferroelectr Freq Control. 2011;58:517–532. [DOI] [PMC free article] [PubMed] [Google Scholar]
- 70. Hu H, Xu S, Yuan Y, Liu R, Wang S, Wan M. Spatial‐temporal ultrasound imaging of residual cavitation bubbles around a fluid‐tissue interface in histotripsy. J Acoust Soc Am. 2015;137:2563–2572. [DOI] [PubMed] [Google Scholar]
- 71. Arnal B, Baranger J, Demene C, Tanter M, Pernot M. In vivo real‐time cavitation imaging in moving organs. Phys Med Biol. 2017;62:843. [DOI] [PubMed] [Google Scholar]
- 72. Zhang X, Miller RM, Lin KW, et al. Real‐time feedback of histotripsy thrombolysis using bubble‐induced color Doppler. Ultrasound Med Biol. 2015;41:1386–1401. [DOI] [PMC free article] [PubMed] [Google Scholar]
- 73. Miller RM, Zhang X, Maxwell A, Cain C, Xu Z. Bubble‐induced color Doppler feedback for histotripsy tissue fractionation. IEEE Trans Ultrason Ferroelectr Freq Control. 2016;63:408–419. [DOI] [PMC free article] [PubMed] [Google Scholar]
- 74. Chen J, Daniel BL, Diederich CJ, et al. Monitoring prostate thermal therapy with diffusion‐weighted MRI. Magn Reson Med. 2008;59:1365–1372. [DOI] [PubMed] [Google Scholar]
- 75. Van Leenders GJLH, Beerlage H, Ruijter E, de la Rosette JJMCH, van de Kaa CA. Histopathological changes associated with high intensity focused ultrasound (HIFU) treatment for localised adenocarcinoma of the prostate. J Clin Pathol. 2000;53:391–394. [DOI] [PMC free article] [PubMed] [Google Scholar]
- 76. Kinsey AM, Diederich CJ, Rieke V, et al. Transurethral ultrasound applicators with dynamic multi‐sector control for prostate thermal therapy: in vivo evaluation under MR guidance. Med Phys. 2008;35:2081–2093. [DOI] [PMC free article] [PubMed] [Google Scholar]
- 77. Hijnen NM, Elevelt A, Pikkemaat J, Bos C, Bartels LW, Grüll H. The magnetic susceptibility effect of gadolinium‐based contrast agents on PRFS‐based MR thermometry during thermal interventions. J Ther Ultrasound. 2013;1:8. [DOI] [PMC free article] [PubMed] [Google Scholar]
- 78. Zhu M, Sun Z, Ng CK. Image‐guided thermal ablation with MR‐based thermometry. Quant Imaging Med Surg. 2017;7:356–368. [DOI] [PMC free article] [PubMed] [Google Scholar]
- 79. N'Djin WA, Mougenot C,Kobelevskiy I, Ramsay E, Bronskill M, Chopra R. Dual‐frequency ultrasound focal therapy for MRI‐guided transurethral treatment of the prostate: study in gel phantom. AIP Conf Proc. 2012;1503:212–216. [Google Scholar]
- 80. N'djin WA, Burtnyk M, Kobelevskiy I, Hadjis S, Bronskill M, Chopra R. Coagulation of human prostate volumes with MRI‐controlled transurethral ultrasound therapy: results in gel phantoms. Med Phys. 2012;39:4524–4536. [DOI] [PMC free article] [PubMed] [Google Scholar]
- 81. Ndjin WA, Burtnyk M, Bronskill M, Chopra R. Investigation of power and frequency for 3D conformal MRI‐controlled transurethral ultrasound therapy with a dual frequency multi‐element transducer. Int J Hyperthermia. 2012;28:87–104. [DOI] [PubMed] [Google Scholar]
Associated Data
This section collects any data citations, data availability statements, or supplementary materials included in this article.
Supplementary Materials
Fig. S1. Orthogonal in vivo 3T MR images [(a) axial, (b) coronal, and (c) sagittal] showing placement of ultrasound applicator using iSuite interface.
Fig. S2. Orthogonal in vivo 3T MR images [(a) axial, (b) coronal, and (c) sagittal] from iSuite interface showing insertion of biopsy needle for particle injection into the prostate.
Fig. S3. 3T in vivo T1W and T2W images of the prostate before and after therapy.
Fig. S4. Comparison of T Eq as defined in Eq. (2) for treatments administered with saline, sUPEs only, and sUPEs with Optison.
Table S1. Errors in histological lesion size (standard deviation of triplicate measurements), T1 CNR (standard deviation in CNR over slices with apparent T1 enhancement), and fitted parameter T Eq (standard deviation over all fitted pixels).
Table S2. Lesion areas as determined by thermal dose, 55 °C isotherms, DCE NPAs, and histology.