

Introduction
With ambient temperatures projected to increase by 0.1°C per decade over the next 2 decades, heat-vulnerable populations including the poor, the elderly, military personnel, first responders, and outdoor workers will be at heightened risk for heat-related illness (HRI) (1). Farmworkers represent a category of outside workers susceptible to HRI. In fact agricultural workers experience heat-related deaths at an annual rate that is 20 times that of the U.S. civilian workforce (2). Beyond experiencing adverse environmental conditions at their workplace, agricultural workers experience a high level of vulnerability due to socioeconomic disparities including decreased access to healthcare, separation from their families, low income, crowded housing often in poor condition, and little control over their work environments (3–7). While the threats of HRI in this population are well-recognized there have been few studies that actually capture the heat conditions of the worksite, nor have researchers assessed the validity to which environmental monitoring station reflect the temperatures at the worksite.
Researchers encounter common methodological and design issues in conducting field studies to assess occupational heat hazards in agricultural work including barriers to farmworker recruitment due to the migratory nature of their work, population enumeration, and employee fear of a loss of confidentiality and an employer knowing they are participating in a research study (8–10). While some farm owners are willing to cooperate with researchers in supporting investigations, many are not. Many farmworkers are not employees of large agricultural operations, but instead work for small independent contractors. Exclusive reliance on industry-supported research studies may block the inclusion of many vulnerable workers, leading to biased findings. Despite the development of comprehensive biomonitoring protocols for HRI (11, 12), work site-based environmental monitoring presents a variety of challenges including accurate and efficient use of weather assessment equipment, access to the worksite in some agricultural communities, and variation among numerous worksites.
The Girasoles Study (R01OH10657) is a project assessing agricultural workers in multiple communities in the state of Florida to characterize HRI and to examine the factors that predispose an individual to be particularly vulnerable to HRI. The design of Girasoles was based upon the Farmworker Vulnerability to Heat Hazards Framework (13). The hazard component of the framework (environmental heat) was captured from local monitoring stations of the Florida Automated Weather Network (FAWN) that generate publicly available weather information.
The validity of data from monitoring stations in accurately capturing heat exposure is problematic. The actual microclimate in a workplace can deviate significantly from the general climate of a district because direct solar radiation and wind speed play important roles in heat stress experienced by outdoor workers (14). In an attempt to measure bias in using general climate data generated by the FAWN system, we used an iButton (Maxim Integrated Products, Inc., San Jose, CA), a small personal temperature logger attached to participants’ clothing, to measure microclimate conditions at individual worksites, recording ambient temperature and humidity. The iButton technology can be worn inside or outside clothing, does not interrupt the flow of work, and is not affected by moisture.
Beyond the need for accurate worksite environment assessment for research studies, there is a great need to provide outdoor workers with accessible and informative heat-risk measures. To our knowledge, there is no inexpensive wearable device to provide workers with real time temperature readings of their environment. While the iButton technology captures the temperature in the workplace, it does not have a mechanism to provide the information directly to the worker. Instead, the data are downloaded after a shift to capture retrospectively, the temperatures of the work environment. A readily accessible resource that stratifies levels of heat risk is the heat index (HI) which is reported by the National Weather Service (NWS) from calculations generated from regional weather data (15, 16), and broadcast on local weather station channels. Heat index is calculated from ambient air temperature, commonly referred to as temperature, and relative humidity, commonly referred to as humidity. Therefore, the aims of this study were two-fold: (1) To determine if regional weather data is associated with direct worksite monitoring of environmental conditions; and (2) To utilize regional weather data to build a useful model for predicting worksite environmental conditions for agricultural workers.
Methods
Study Design and Population
The Girasoles study of agricultural workers in Florida is aimed at assessing factors related to HRI, including work activity. As part of the larger objective of evaluating the presence of HRI, workers were monitored for up to three workdays including daily bio-specimen collection and continuous, physiologic monitoring in the field. This study is a partnership between university researchers and members of the Farmworker Association of Florida (FWAF), a grassroots, statewide, community-based membership organization with a 35-year history working with agricultural workers in Florida. The FWAF has over 10,000 members who work in various agricultural operations including ferneries, nurseries and field crops. Trained research assistants from the FWAF used community outreach strategies to recruit a convenience sample of agricultural workers from five communities in Florida, and it was a subset of this sample from two different agricultural communities in Florida during the summers of 2015–16, that was utilized for this subanalysis. Apopka, located in central Florida is the home of a large number of nursery workers who may be working outside or in greenhouse operations. Immokalee, located in the southwest coastal area of the state is home of numerous field crops.
Sample and Recruitment
Workers were recruited for the Girasoles study if they were between the ages of 18–54 years, spoke either English, Spanish, or Creole and had worked the previous month in agriculture. Workers were excluded if they had a history of Type 1 diabetes, were currently pregnant, or if they had been diagnosed with a disorder of the digestive tract due to physiological data that were being collected and contraindications for the other biomonitoring equipment utilized in the study. Workers enrolled in the study participated in a baseline assessment followed by up to three monitored workdays. The Institutional Review Board of Emory University approved this study under IRB00075192.
Data Collection
At baseline, trained interviewers administered an occupational heat-related illness survey in the participant’s primary language. Socio-demographic (age, gender, nationality, marital status, years of education), and work characteristics (years worked in agriculture, number of days worked per week) were collected on the survey. After the baseline assessment, workers reported to the study field office before and after their work shift for the next three workdays. Before work the participants were given the physiological monitoring devices being used in the study and an iButton (Maxin Integrated™), a wearable device, similar in size to a keychain fob, that captures temperature and humidity (Figure 1). iButtons were worn at two body locations: (1) the neck, suspended on a lanyard and tucked under the shirt and (2) the waist, pinned to the outside of the pants (Figure 2). The devices were set to record temperature and humidity every 30 seconds during the workday. The iButton readings from devices worn on the outside of the clothing at waist level was thought to provide more accurate temperature and humidity readings indicative of the worksite environment, as compared to readings obtained from monitors at the neck, that might be influenced by skin temperature and moisture.
Figure 1.
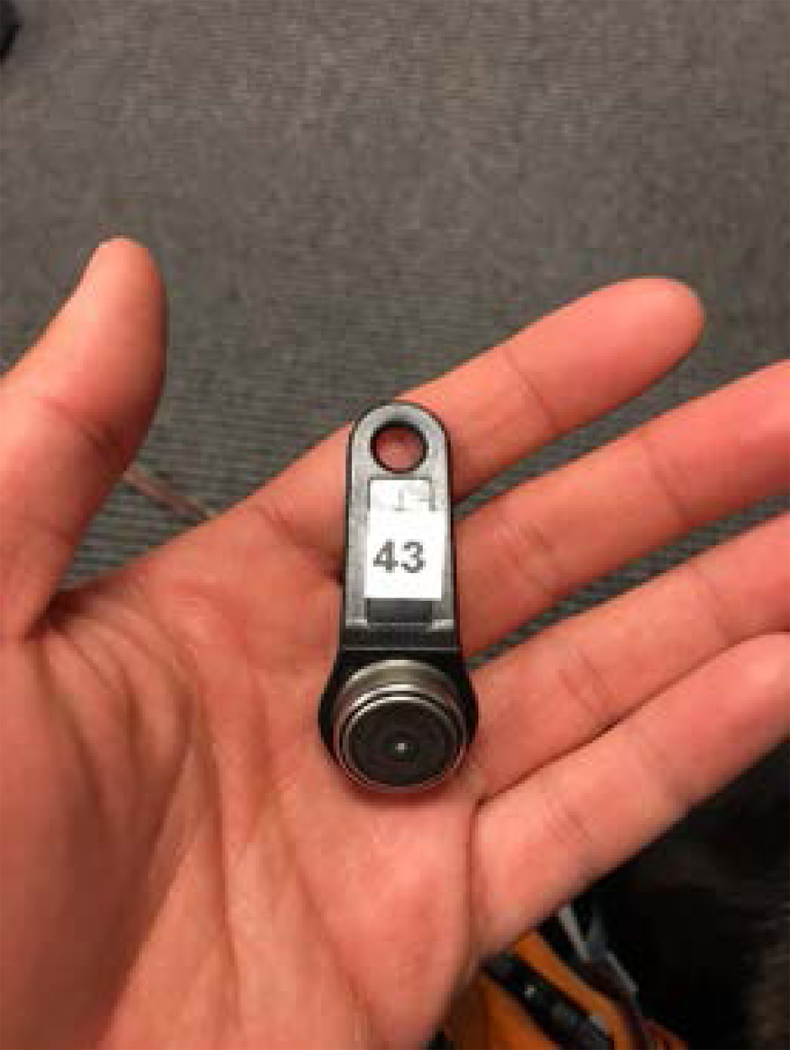
Photo of an iButton. Pictured here is a Maxim iButton in the palm of a hand for scale.
Figure 2.
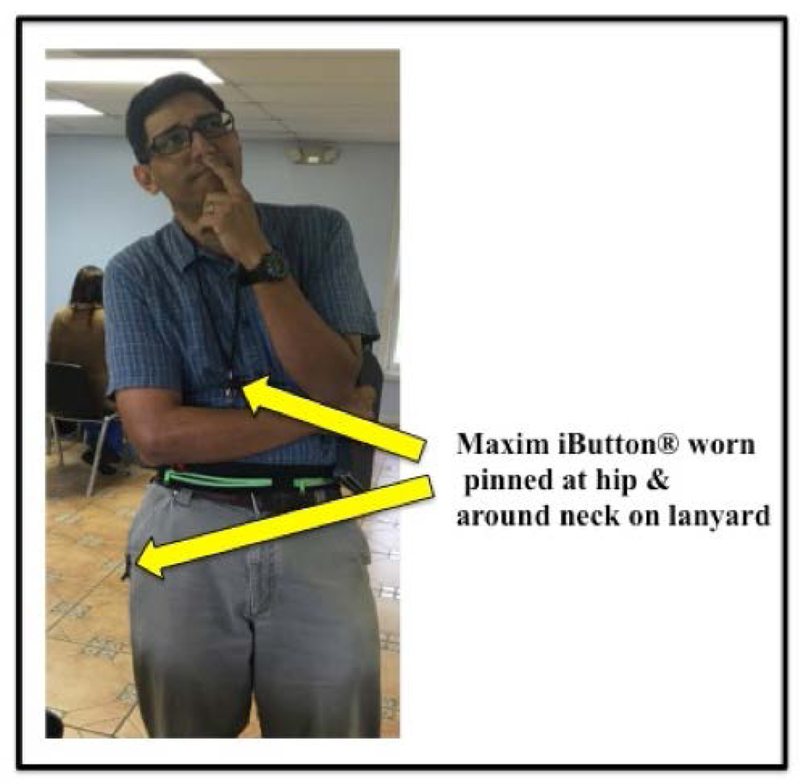
Schematic of equipment placement including the location of the neck and waist button temperature and humidity monitor. Worksite temperatures from the iButton devices pinned at the waist on the outside of the participants clothing and attached to a lanyard around the participants neck underneath their clothing. A study staff member demonstrates the location of the iButtons. Note: The neck iButton is worn underneath the clothing, but for the purpose of the visual demonstration, the lanyard was draped outside of the clothing.
Ambient temperature and relative humidity during the study period workdays (6:00am to 6:00pm) were obtained from the Florida Automated Weather Network (FAWN) (17), which collects environmental data every 15 minutes from 35 monitoring stations throughout the state of Florida. A monitoring station was present in each of the two communities described in this report. The heat index, which approximates the apparent temperature by combining air temperature and moisture into a single scale, was calculated by using the National Weather Service algorithm (17). Other weather variables from the FAWN included soil temperature, solar radiation, dew point, rainfall, wet bulb temperature, and wind speed.
After their work shift, workers returned to the study site where research staff removed the iButton and uploaded the data to secure field laptops. Workers also completed a brief post-shift survey where they reported the specific work activities and tasks performed during their workday.
Statistical Analysis
Regional weather data were downloaded from FAWN and iButton data were downloaded using the OneWireViewer software (Maxin Integrated™). Data were imported into SAS® (version 9.4) for cleaning. Significant data manipulation was performed in SAS to clean and aggregate the data before importing data into RStudio. To be representative of worksite exposure, data were trimmed using self-reported work start and stop times. Using SAS, iButton observations were rounded to the nearest 15-minute interval, and then individual iButton readings over each 15-minute interval were averaged to allow pairing with the FAWN environmental readings (ambient temperature and humidity). Data were subsequently imported into RStudio® (Version 1.0.136) for modeling. An alpha level of 0.05 was used in this analysis. GitHub was utilized for version control to track and maintain progress within the RStudio analysis process.
The original variables indicating the worksite-based temperature and humidity from the iButtons were utilized to calculate the worksite based heat index with the R package “weathermetrics” (17). Using this R package, regional heat indices were calculated from regional temperature and humidity readings provided by the FAWN. Data were organized into subsets to examine potential differences in worksite region and iButton placement.
Using SAS, iButton readings over each 15-minute interval were averaged to allow pairing with the FAWN environmental readings (ambient temperature and humidity) at each 15-minute interval. Data were examined using simple descriptive statistics. Conditional inference trees were used to examine the relationships between worksite-based temperatures and regional weather network temperatures (18). Conditional inference trees are produced by a recursive partitioning procedure that is a fundamental tool in mining large datasets. It helps explore the structure of data, while developing easy-to-visualize decision rules for predicting a categorical (classification tree) or continuous (regression tree) outcome. The procedure recursively partitions a sample using non-negative integer valued case weights. Nodes at which the data are partitioned are chosen in order to optimize homogeneity of observations with respect to the outcome of interest within the subgroups formed by the partition. The function ‘ctree’ (18) from the R package ‘party’ was utilized to build two trees: 1) a conditional inference tree for regional environmental temperatures and iButton waist temperatures, and 2) a conditional inference tree for the regional heat index and iButton waist temperatures.
Results
One hundred and five workers participated in the study from the two communities of Apopka (n=39) and Immokalee (n = 66), with enrollment rates from potential participants who were screened of 70% and 80%, respectively. The sample was comprised of 61 women and 44 men who were between the ages of 19 and 54 and had a median age of 38 years (SD=8.7). The participants were employed in nurseries, landscaping operations, ferneries and crop fields and the median number of years worked in agriculture was 10 (SD=8.5) ranging from a few months to 34 years. The 105 workers wore the iButtons for up to 3 days, providing 284 days of monitored iButton data. Seven iButton days were missing due to field equipment download errors or equipment loss at the worksite and were not included in the analysis. The final dataset contained 18,769 iButton observations.
FAWN data reported at 15 minutes intervals for the 284 observation days were downloaded from the publicly available site for the two monitoring stations in the targeted communities of Apopka and Immokalee. Summary statistics for the key variables for this analysis are shown in Table 1. The mean worksite heat index (waist iButton) was 40.6˚C (SD=9.2) and the mean regional heat index was 33.3˚C (SD= 4.6). Both of these readings from the iButton were higher than the FAWN data. The readings from the iButton placed at the neck appeared to vary more than the waist placement data and to be less aligned with the FAWN environmental monitoring data.
Table 1.
Summary Statistics for Worksite and Regional Environmental Readings
| Variable | n | |
|---|---|---|
| Worksite-Based Environmental Readings (iButton) | (N=18769) | |
| Waist | 9394 | |
| Temperature (˚C) | 9394 | 31.5±3.4 (range=29.8) |
| Humidity (%) | 9394 | 71.6 ±14.4 (range=72.3) |
| Heat Index | 9394 | 40.6 ±9.2 (range=67.0) |
| Neck | 9375 | |
| Temperature (˚C) | 9375 | 21.1±2.7 (range=19.8) |
| Humidity (%) | 9375 | 78.7±15.1 (range=90.0) |
| Heat Index | 9375 | 45.3 ±11.4 (range=61.0) |
| Regional Environmental Readings (FAWN) | 18769 | |
| Temperature (˚C) | 18769 | 29.0 ±2.6 (range=15.8) |
| Humidity (%) | 18769 | 74.5 ±14.3 (range=60.0) |
| Heat Index | 18769 | 33.3 ±4.6 (range=22.0) |
This table displays the number of readings available as well as mean, standard deviation and range for the key environmental data (temperture, humidity, and heat index) collected from the iButtons placed at the waist, the neck lanyard, and the regional data from the Florida Automated weather Network (FAWN).
Plots of iButton readings and FAWN readings were examined. Figure 3 shows that the FAWN ambient air data appeared to have a stronger correlation with the iButton data when the device was worn on the waist than when it was worn on the neck. This trend was also apparent for the FAWN heat index readings, with the iButton data from the waist being more highly correlated from (Figure 4). Given these results, iButton data from the waist location were selected for use for the remainder of the analyses.
Figure 3.
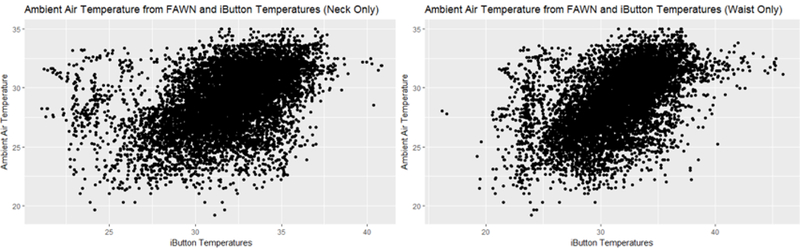
Worksite Environmental Temperature for iButton and Regional Temperature by iButton Placement. The regional temperature readings were generated from the Florida Automated Weather Network (FAWN) and worksite temperature readings were generated from the iButtons worn by workers at their waist and on a lanyard around their neck. This figure compares the correlation between worksite temperature readings from the neck iButton and the waist iButton with the regional temperature readings based upon time and date.
Figure 4.
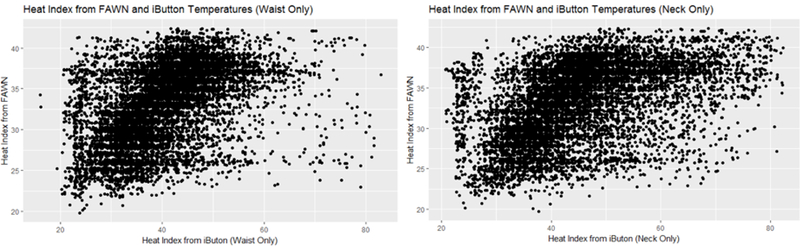
Worksite Environmental Temperature for Neck iButton and Regional Temperature. The regional readings for ambient temperture and humidity were generated from the Florida Automated Weather Network (FAWN) and worksite readings for ambient temperature and humidity were generated from thr iButtons worn by workers at their waist and on a lanyard around their neck. Heat index was calculated from ambient temperature and humidity using the R package, “weathermetrics” (17). This figure compares the correlation between worksite heat index readings from the neck iButton and the waist iButton with the regional heat index readings based upon time and date.
The conditional inference trees indicated a significant association between regional FAWN temperature and worksite ambient temperature (Figure 5) as well as between regional heat index and worksite heat index (Figure 6). Both conditional inference trees split the data at 15 nodes, but these nodes were in different locations for the two trees. The ambient temperature conditional inference tree (Figure 5) partitioned the lower worksite readings more finely, splitting twice after the primary node at 29.1˚C. In contrast, the heat index conditional inference tree (Figure 6) partitioned the higher heat index readings more finely, with the primary node splitting at 33.0˚C, with 5,063 worksite-based waist iButton observations distinguished as being >33.0˚C. Within the observations that were partitioned as >33.0˚C, there were 3 more partitions at 36.0˚C, 37.0˚C, and 40.0˚C.
Figure 5.

Conditional Inference Tree for iButton-Based Worksite Temperature Derived from Regional Temperature Readings. Regional temperature readings were generated from the Florida Automated Weather Network (FAWN). Worksite temperatures were generated from iButtons worn by workers at the waist. This plot visualizes the location of where regional temperature (ambairC) was split into nodes based upon iButton-based worksite temperatures.
Figure 6.

Conditional Inference Tree for iButton-Based Worksite Heat Index and Derived from Regional Weather Data. Regional weather data, including ambient temperature and humidity, were generated from the Florida Automated Weather Network (FAWN). Worksite ambient temperature and humidity were generated from iButtons worn by workers at the waist. Heat index was calculated from ambient temperature and humidity using the R package, “weathermetrics” (17). This plot visualizes the location of where the data for regional weather data regional heat index (HIFAWN) was split into nodes based upon iButton-based worksite temperatures.
Discussion
This study was designed to identify how to best determine if work environments temperatures are dangerous to worker health and if data generated from geographic data systems accurately align with the microenvironment temperatures in the workplace. Much of the recent research and reports on the heat conditions experienced by U.S. agricultural workers at risk for HRI has been conducted in at the worksite using weather monitoring data from regional stations (19–21). Few studies actually report workplace temperature monitoring data in the microenvironment surrounding individual workers (22). If regional weather data correlate meaningfully with micro-environmental data of individual workers, then widely-available measures, like those generated from the FAWN and other weather monitoring systems, can reliably be used by workers and employers to guide worker protection actions. Based upon stratifications of heat risk, agricultural workers can be instructed to follow certain guidelines or work-rest cycle procedures depending upon the level of heat stratification for a workday and region.
The Occupational Safety and Health Administration (OSHA) has identified levels of heat that indicate that protective measures are necessary (23). Temperatures less than 91˚F are considered low risk, where only basic heat safety and planning are needed. Between 91˚F to 103˚F precaution should be implemented and there should be heightened awareness. Above 103˚F additional and more aggressive protective measures need to be implemented (Table 2.) It is commonly assumed that there are other factors other than the heat index that would signal the need for increased precautions including the levels of clothing the workers wear, air circulation, the strenuous nature of the work and working in direct sunlight which can add up to 15 degrees to the heat index. Currently the method of ascertaining temperatures in which workers need protection are not always clear. For example in Washington State (WAC § 296–62-095) the guidance materials for implementing worker protection state include a combination of the ambient temperature and the clothing of the worker. Specifically the guidance (24) applies to anyone working outdoors more than 15 minutes in any 60-minute period in temperatures:
Table 2.
Recommended Protective Measures by Heat Index
| Heat Index | Risk Level | Protective Measures |
|---|---|---|
| Less than 33.3°C (91°F) | Lower (Caution) | Basic heat safety and planning |
| 32.8°C to 39.4°C (91°F to 103°F) |
Moderate | Implement precautions and heighten awareness |
| 39.4°C to 46.1°C (103°F to 115°F) |
High | Additional precautions to protect workers |
| Greater than 46.1°C (115°F) | Very High to Extreme | Triggers even more aggressive protective measures |
This table from the Occupational Safety and Health Administration displays the reccomended protective measures at increasing heat illness risk levels (24).
As low as 52°F when wearing clothing that is non-breathable or provides a vapor barrier like rain gear, chemical resistant suits, or Level A suits.
Starting at 77°F when wearing double layer woven clothing like sweatshirts, coveralls, and jackets on top of other clothes.
At 89°F when wearing any other type of clothing like typical shirts and pants.
The results of this study provide evidence that the weather monitoring stations in Florida can provide data that closely reflect the temperature conditions that workers are experiencing, particularly as the temperature rises.
Many occupational protection guidelines were developed by studies using the Wet Bulb Globe Temperature (WBGT), which is the most accurate tool to measure heat hazards for outdoor workers. This measurement takes temperature, humidity, wind speed, and radiant heat into account whereas the heat index which considers temperature, humidity and is calculated for shady areas. However most workplaces do not have WBGT monitors and in widely dispersed agricultural areas, stationary thermometers are not available. Military agencies, OSHA and many nations use the WBGT as a guide to managing workload in direct sunlight, however it is not used in agricultural settings. For outdoor work settings, it is recommended that HI be utilized in in lieu of WBGT when WBGT is not available for determining the level of heat hazard on a particular workday (21).
This study also demonstrated the utility of regional weather system data in validating workplace temperatures that could signal increasing need for interventions to protect workers. Partitioning at 33.0˚C (91.4 ˚F) indicates that two categories of worksite microenvironment calculations can be distinguished based upon the regional heat index calculations from the FAWN, with over half of the observations being >33.0˚C. Besides two other nodes, partitioning at 36.0˚C (96.8 ˚F) and 37.0˚C (98.6 ˚F), the final partitioning occurred at 40.0˚C (100.4˚F). Of great interest are the nodes at 33.0˚C and 40.0˚C that appear to closely mirror the demarcation levels between “Caution” and “Extreme Caution” (Figure 7 and Table 2) (25). The presence of these nodes indicates that regional weather data can have high utility in identifying climatic conditions that mandate increased precautions to prevent health related illness. This finding supports the standard developed by (T8 CCR§ 866.04) that mandates precautionary measures with the heat index reaches 95˚F. In California, when temperatures reach 95 degrees Fahrenheit or above, employers ensure that employees takes a minimum ten minute net preventative cool-down rest period every two hours (26). With these temperature delineations, categories can be tied to appropriate heat-adaptive actions for that day for worksites in a corresponding region. For example, according to the conditional inference tree from this study, regional weather data that shows a temperature of over 33°C (91°F), which is the warning level of “Extreme Caution”, should trigger heat adaptive actions to protect workers because worksite temperatures are likely over 33°C (91°F) as well.
Figure 7.

National Weather Service Heat Index. (25) This figure displays the National Weather Service’s Heat Index diagram, created by the National Oceanic and Atmospheric Administration (NOAA). This diagram visualizes the likelihood of heat disorders with prolonged exposure or strenuous activity by color category for different heat index values. Circled values indicate the nodes, generated by the conditional inference tree for regional heat index and worksite heat index (Figure 5), of 33.0˚C (91˚F) and 40.0˚C (104˚F). These two nodes are located at the border between categories of “Caution” (in light yellow) and “Extreme Caution” (in dark yellow) and then “Extreme Caution” (in dark yellow) and “Danger” (in orange), respectively.
These findings provide evidence that meteorological weather data and micro-environmental data have sufficiently strong correlations to identify levels that present a need to implement special precautions to protect worker health. However it is quite possible that factors other than the ambient temperature could affect the risk for HRI. Of particular importance are the clothing the worker is wearing and the strenuous nature of their work. Only two states have passed occupational heat standards (California and Washington). Though our data clearly demonstrate multiple instances where the heat index exceeded levels that would have been actionable in either of these two states, Florida has no recommendations or standards to recognize that extra precautions are necessary. Many of the workers who participated in this study wore layers of clothing including long pants and sweatshirts. Fernery workers are paid by the amount of crop they harvest, and studies have found a relationship between this type of pay schema and increased risk taking as well as increased stress (27). In outdoor workers exposed to heat this increased risk taking under stress could manifest as skipping needed rest and water breaks. We have reported the physiological effects of working in this hot environment, including the frequency that the participants exceed recommended core body temperature recommendations (28). Until we have established occupational standards for heat exposure in agricultural worker, the publicly available data from monitoring stations can be a warning signal for workers to protect themselves. When the heat index reaches moderate to extreme levels, immediate interventions are needed including scheduling more physically demanding work during cooler times of the day, rotating workers in and out of the more strenuous tasks, adding more workers, or using payment models other than payment by volume harvested. Work and rest cycles should be implemented using established industry guidelines and work should be stopped when the hazard cannot be controlled.
While this study demonstrates the utility of using heat index data captured by geographic weather monitoring systems, it may not be easily accessible to workers. To address this needed, OSHA and the National Institute for Occupational Health and Safety (NIOSH) have developed a smart phone app (https://itunes.apple.com/us/app/osha-niosh-heat-safety-tool/id1239425102?mt=8 ) that provides weather data and prevention recommendations based on local weather conditions used to calculate the heat index. If a worker and/or supervisor is in a geographic area with local services enabled, temperature and humidity data will download automatically and the current heat index will be displayed. Beneath the calculated heat index is the associated “Precautions” button for the risk level. By clicking on “Precautions”, the user will arrive on a screen with risk level-specific recommendations. The app also allows users to see the predicted heat index throughout the day in order to plan precautionary actions. Heat-related illness symptoms and first aid information is also provided.
Limitations
The findings of this study are limited to the two agricultural communities targeted in Florida. Variation in workday length and number of workdays collected due to varying work schedules may be source of unrecognized bias. The results are based on data generated by a convenience sample of a limited size in a targeted areas and may have limited generalizability to other regions employing agricultural workers.
Conclusion
The heat index calculated from regional weather data has strong potential for guiding the need for interventions to decrease the risk of HRI in agricultural workers, particularly in areas where direct worksite temperatures are not available. Because of the wide availability of regional weather monitoring systems, communities should develop policies that use these data systems to further the protection of vulnerable workers. Employers should also assure that teams of workers can access these data systems to monitor environmental temperatures and to predict work periods in which interventions are needed to assure that the health of workers is protected.
Acknowledgement:
We would like to thank the Florida Department of Health and the Florida Occupational Injury and Illness Coalition for their support by providing the Maxim iButton monitoring equipment for use in this study. A special thank you to the Farmworker Association of Florida for making this study possible.
Funding: Centers for Disease Control and Prevention - National Institute for Occupational Safety and Health under grant R01OH010657 (PI: L. McCauley) and the National Institute for Nursing Research under grant T32NR012715 (PI: S. Dunbar) for trainee V. Mac.
Footnotes
Conflict of interest: None declared.
Contributor Information
Valerie Vi Thien Mac, Nell Hodgson Woodruff School of Nursing, Emory University.
Vicki Hertzberg, Nell Hodgson Woodruff School of Nursing, Emory University.
Linda A. McCauley, Nell Hodgson Woodruff School of Nursing, Emory University.
References
- 1.Intergovernmental Panel on Climate Change (IPCC) Climate Change 2014–Impacts, Adaptation and Vulnerability: Regional Aspects. Cambridge University Press; 2014. [Google Scholar]
- 2.Jackson LL, Rosenberg HR. Preventing heat-related illness among agricultural workers. Journal of Agromedicine. 2010;15:200–215. [DOI] [PubMed] [Google Scholar]
- 3.Arcury TA, Trejo G, Suerken CK, Grzywacz JG, Ip EH, Quandt SA. Work and health among Latina mothers in farmworker families. J Occup Environ Med. 2015;57:292–299. [DOI] [PMC free article] [PubMed] [Google Scholar]
- 4.Flocks J, Kelley M, Economos J, McCauley L. Female farmworkers’ perceptions of pesticide exposure and pregnancy health. Journal of immigrant and minority health / Center for Minority Public Health. 2012;14:626–632. [DOI] [PubMed] [Google Scholar]
- 5.Kiehne E, Mendoza NS. Migrant and Seasonal Farmworker Food Insecurity: Prevalence, Impact, Risk Factors, and Coping Strategies. Social work in public health. 2015;30:397–409. [DOI] [PubMed] [Google Scholar]
- 6.Farquhar S, Shadbeh N, Samples J, Ventura S, Goff N. Occupational conditions and well-being of indigenous farmworkers. American journal of public health. 2008;98:1956–1959. [DOI] [PMC free article] [PubMed] [Google Scholar]
- 7.Hansen E, Donohoe M. Health issues of migrant and seasonal farmworkers. J Health Care Poor Underserved. 2003;14:153–164. [DOI] [PubMed] [Google Scholar]
- 8.Arcury TA, Estrada JM, Quandt SA. Overcoming language and literacy barriers in safety and health training of agricultural workers. J Agromedicine. 2010;15:236–248. [DOI] [PMC free article] [PubMed] [Google Scholar]
- 9.Flocks J, Clarke L, Albrecht S, Bryant C, Monaghan P, Baker H. Implementing a community-based social marketing project to improve agricultural worker health. Environ Health Perspect. 2001;109 Suppl 3:461–468. [DOI] [PMC free article] [PubMed] [Google Scholar]
- 10.McCauley LA, Anger WK, Keifer M, Langley R, Robson MG, Rohlman D. Studying health outcomes in farmworker populations exposed to pesticides. Environmental Health Perspectives. 2006;114:953–960. [DOI] [PMC free article] [PubMed] [Google Scholar]
- 11.Hertzberg V, Mac V, Elon L, et al. Novel Analytic Methods Needed for Real-Time Continuous Core Body Temperature Data. West J Nurs Res. 2016. [DOI] [PMC free article] [PubMed] [Google Scholar]
- 12.Mac VV, Tovar-Aguilar JA, Flocks J, Economos E, Hertzberg VS, McCauley LA. Heat Exposure in Central Florida Fernery Workers: Results of a Feasibility Study. J Agromedicine. 2017;22:89–99. [DOI] [PMC free article] [PubMed] [Google Scholar]
- 13.Mac VVT, McCauley LA. Farmworker Vulnerability to Heat Hazards: A Conceptual Framework. Journal of nursing scholarship : an official publication of Sigma Theta Tau International Honor Society of Nursing. 2017;49:617–624. [DOI] [PMC free article] [PubMed] [Google Scholar]
- 14.Cecchini M, Colantoni A, Massantini R, Monarca D. Estimation of the risks of thermal stress due to the microclimate for manual fruit and vegetable harvesters in central Italy. Journal of agricultural safety and health. 2010;16:141–159. [DOI] [PubMed] [Google Scholar]
- 15.Steadman RG. The Assessment of Sultriness. Part II: Effects of Wind, Extra Radiation and Barometric Pressure on Apparent Temperature. Journal of Applied Meteorology. 1979;18:874–885. [Google Scholar]
- 16.Steadman RG. The Assessment of Sultriness. Part I: A Temperature-Humidity Index Based on Human Physiology and Clothing Science. Journal of Applied Meteorology. 1979;18:861–873. [Google Scholar]
- 17.Anderson GB, Bell ML, Peng RD. Methods to calculate the heat index as an exposure metric in environmental health research. Environ Health Perspect. 2013;121:1111–1119. [DOI] [PMC free article] [PubMed] [Google Scholar]
- 18.Hothorn T, Hornik K, Zeileis A. Unbiased Recursive Partitioning: A Conditional Inference Framework. Journal of Computational and Graphical Statistics. 2006;15:651–674. [Google Scholar]
- 19.Fleischer NL, Tiesman HM, Sumitani J, et al. Public health impact of heat-related illness among migrant farmworkers. American Journal of Preventive Medicine. 2013;44:199–206. [DOI] [PubMed] [Google Scholar]
- 20.Spector JT, Krenz J, Rauser E, Bonauto DK. Heat-related illness in Washington State agriculture and forestry sectors. Am J Ind Med. 2014;57:881–895. [DOI] [PMC free article] [PubMed] [Google Scholar]
- 21.Tustin AW, Lamson GE, Jacklitsch BL, et al. Evaluation of Occupational Exposure Limits for Heat Stress in Outdoor Workers - United States, 2011–2016. MMWR Morb Mortal Wkly Rep. 2018;67:733–737. [DOI] [PMC free article] [PubMed] [Google Scholar]
- 22.Mitchell DC, Castro J, Armitage TL, et al. Recruitment, Methods, and Descriptive Results of a Physiologic Assessment of Latino Farmworkers: The California Heat Illness Prevention Study. Journal of Occupational and Environmental Medicine. 2017. [DOI] [PMC free article] [PubMed] [Google Scholar]
- 23.U.S. Department of Labor, Occupatonal Safety and Health Administration (OSHA). Using the Heat Index to Protect Workers. https://www.osha.gov/SLTC/heatillness/heat_index/using_heat_protect_workers.html
- 24.Heat Illness Prevention Standard. Washington Adminitrative Code. WAC § 296–62 (095–09560). http://apps.leg.wa.gov/WAC/default.aspx?cite=296-62-09510
- 25.National Weather Service (NWS). NWS Heat Index. https://www.weather.gov/safety/heat-index
- 26.Heat Illness Prevention. Califronia Code of Regulations. T8 CCR§ 866.04. https://www.dir.ca.gov/Title8/3395.html
- 27.Johansson B, Rask K, Stenberg M. Piece rates and their effects on health and safety – a literature review. Appl Ergon. 2010;607–514. [DOI] [PubMed] [Google Scholar]
- 28.Mac VV, Tovar-Aguilar JA, Flocks J, Economos E, Hertzberg VS, McCauley LA. Heat exposure in central Florida fernery workers: results of a feasibility study. Journal of Agromedicine. 2017;22:89–99. [DOI] [PMC free article] [PubMed] [Google Scholar]