Introduction
Vascular contributions to cognitive impairment are increasingly recognized1–5 as shown by neuropathological6,7, neuroimaging4,8–11, and cerebrospinal fluid (CSF) biomarker4,12 studies. Moreover, small vessel disease of the brain has been estimated to contribute to approximately 50% of all dementias worldwide, including those caused by Alzheimer’s disease (AD)3,4,13. Vascular changes in AD have been typically attributed to vasoactive and/or vasculotoxic effects of amyloid-β (Aβ)3,11,14, and more recently tau15. Animal studies suggest that Aβ and tau lead to blood vessel abnormalities and blood-brain barrier (BBB) breakdown14–16. Although neurovascular dysfunction3,11 and BBB breakdown develop early in AD1,4,5,8–10,12,13, how they relate to changes in AD classical biomarkers Aβ and tau, which also develop prior to dementia17, remains unknown. To address this question, here we studied brain capillary damage using a novel CSF biomarker of BBB-associated capillary mural cell pericyte, a soluble platelet-derived growth factor receptor-β (sPDGFRβ)8,18, and regional BBB permeability using dynamic contrast-enhanced (DCE)-magnetic resonance imaging (MRI)8–10. Our data show that individuals with early cognitive dysfunction develop brain capillary damage and BBB breakdown in the hippocampus irrespective of Alzheimer’s Aβ and/or tau biomarker changes, suggesting that BBB breakdown is an early biomarker of human cognitive dysfunction independent of Aβ and tau.
We studied individuals who were cognitively normal as well as those with early cognitive dysfunction who were stratified upon CSF analysis as either Aβ-positive (Aβ1–42+, <190 pg/mL) or Aβ-negative (Aβ1–42-, >190 pg/mL), or pTau-positive (pTau+, >78 pg/mL) or pTau-negative (pTau-, <78 pg/mL), using accepted cutoff values19–21. Supplementary Tables 1 and 2 show demographics, clinical data and prevalence of vascular risk factors (VRFs) by level of Clinical Dementia Rating (CDR) score and number of cognitive domains impaired, respectively. Individuals diagnosed with vascular dementia and vascular cognitive impairment, and other disorders that might account for cognitive impairment were excluded (see Methods).
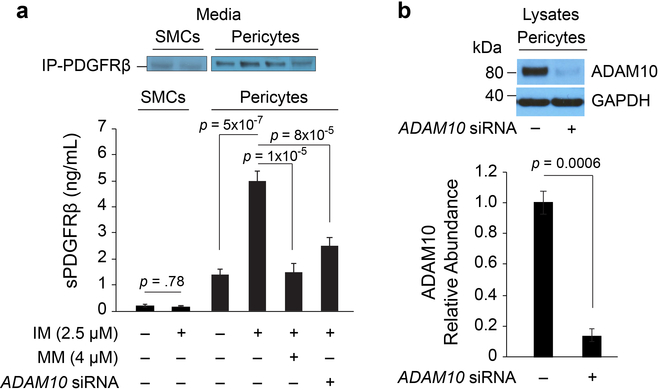
PDGFRβ is primarily expressed in brain by vascular mural cells – capillary pericytes and vascular smooth muscle cells (SMCs), but not by neurons, astrocytes, endothelial cells, oligodendrocytes and/or microglia22–25. PDGFRβ expression in pericytes is noticeably higher than in SMCs18,25,26. Human brain pericytes, but not SMCs, shed sPDGFRβ in the culture media, which is increased by hypoxia or injurious stimuli8,18. Additionally, loss of pericytes in mice elevates CSF sPDGFRβ8. In individuals with mild cognitive impairment, increased CSF sPDGFRβ correlates with increased DCE-MRI measures of BBB dysfunction8. Consistent with findings that ADAM10 (disintegrin and metalloproteinase domain-containing protein 10) sheds sPDGFRβ in fibroblasts27, we found that ADAM10 mediates sPDGFRβ shedding in human pericytes but not SMCs (Extended Data Fig. 1), supporting that sPDGFRβ is primarily a biomarker of brain capillary pericytes8,18.
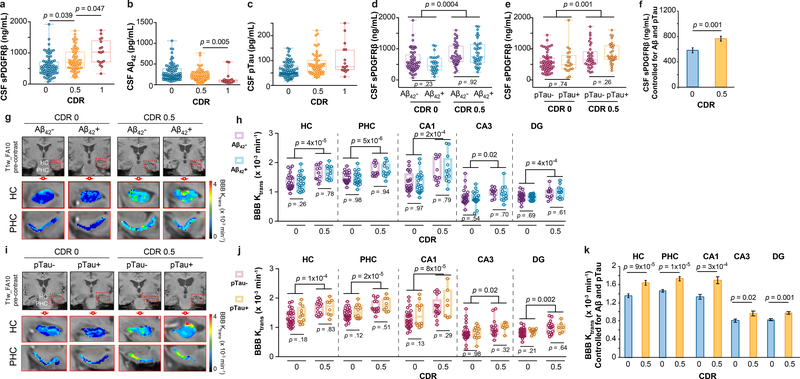
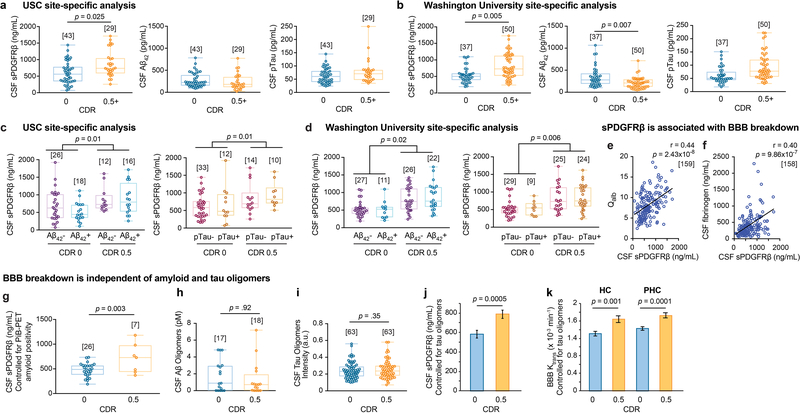
We found increased CSF sPDGFRβ with more advanced CDR impairment (CDR 1 > 0.5 > 0) (Figure 1a), suggesting progressive damage of pericytes8,18 with cognitive dysfunction. There were no significant differences in CSF Aβ1–42 or pTau levels between CDR 0.5 and CDR 0 individuals, although we saw reduced CSF Aβ1–42 in CDR 1 relative to CDR 0.5 participants (Figure 1b-c; for site-specific analysis see Extended Data Figure 2a-b). sPDGFRβ was increased in participants with CDR 0.5 relative to CDR 0 regardless of CSF Aβ1–42 (Figure 1d) or pTau (Figure 1e) status, i.e., irrespective of Aβ+ or Aβ-, or pTau+ or pTau-, as confirmed by site-specific analyses (Extended Data Figure 2c-d). Higher CSF sPDGFRβ remained a significant predictor of cognitive impairment after statistically controlling for CSF Aβ1–42 and pTau, as shown by estimated marginal means from ANCOVA models (Figure 1f) indicating medium-to-large incremental effect sizes with η2partial range = .10–.12, which has been confirmed by logistic regression models (Supplementary Table 3a-c). There was a significant positive correlation between CSF sPDGFRβ with classical biomarkers of BBB breakdown including CSF/plasma albumin ratio and CSF fibrinogen (Extended Data Fig. 2e-f). Among the subset of 35 participants who underwent Pittsburgh compound B (PiB)-positron emission tomography (PET), those with CDR 0.5 exhibited increased CSF sPDGFRβ relative to those with CDR 0, after statistically controlling for amyloid levels (Extended Data Figure 2g), consistent with CSF Aβ findings (Figure 1d). Additionally, we found no differences in CSF Aβ and tau oligomers levels between CDR 0 and CDR 0.5 groups (Extended Data Figure 2h-i). CSF sPDGFRβ remained significantly elevated in CDR analysis after statistically controlling for CSF tau oligomers in ANCOVA models (Extended Data Figure 2j), suggesting that sPDGFRβ increase is not dependent on oligomer levels.
Figure 1. Early brain capillary damage and blood-brain barrier breakdown in human hippocampus and parahippocampal gyrus in individuals with increased clinical dementia rating score is independent of amyloid-β and tau status.
(a-c) CSF soluble platelet-derived growth factor receptor-β (sPDGFRβ) (a), Aβ1–42 (b) and pTau (c) levels in individuals with clinical dementia rating (CDR) score 0 (n=82), 0.5 (n=65) and 1 (n=17). (d) CSF sPDGFRβ in individuals with no cognitive impairment (CDR 0) that are CSF Aβ1–42 negative (Aβ-; n=53) or positive (Aβ+; n=29), and with cognitive dysfunction (CDR 0.5) that are Aβ- (n=38) or Aβ+ (n=38). (e) CSF sPDGFRβ in CDR 0 participants that are CSF pTau negative (pTau-; n=60) or positive (pTau+; n=21) and CDR 0.5 participants that are pTau- (n=33) or pTau+ (n=29). (f) CSF sPDGFRβ controlled for CSF Aβ42 and pTau levels in CDR 0 (n=80) and CDR 0.5 (n=61) participants. Estimated marginal means ± SEM from ANCOVA models. (g-h) Representative blood-brain barrier (BBB) Ktrans maps in the hippocampus (HC) and parahippocampal gyrus (PHC) (g), and quantification of Ktrans values in HC, PHC, and CA1, CA3 and dentate gyrus (DG) hippocampus subfields in CDR 0 individuals that are Aβ- (n=24) or Aβ+ (n=20) and CDR 0.5 participants that are Aβ- (n=11) or Aβ+ (n=12) (h). (i-j) Representative BBB Ktrans maps in HC and PHC (i), and quantification of Ktrans values in HC, PHC, and CA1, CA3 and DG hippocampus subfields in individuals with CDR 0 that are pTau- (n=32) or pTau+ (n=12), and with CDR 0.5 that are pTau- (n=14) or pTau+ (n=8) (j). (k) Regional Ktrans values controlled for CSF Aβ and pTau levels in CDR 0 (n=44) and CDR 0.5 (n=23) individuals. Estimated marginal means ± SEM from ANCOVA models. Box-and-whisker plot lines indicate median values, boxes indicate interquartile range and whiskers indicate minimum and maximum values. Significance tests after FDR correction from ANCOVAs with post-hoc Bonferroni comparisons.
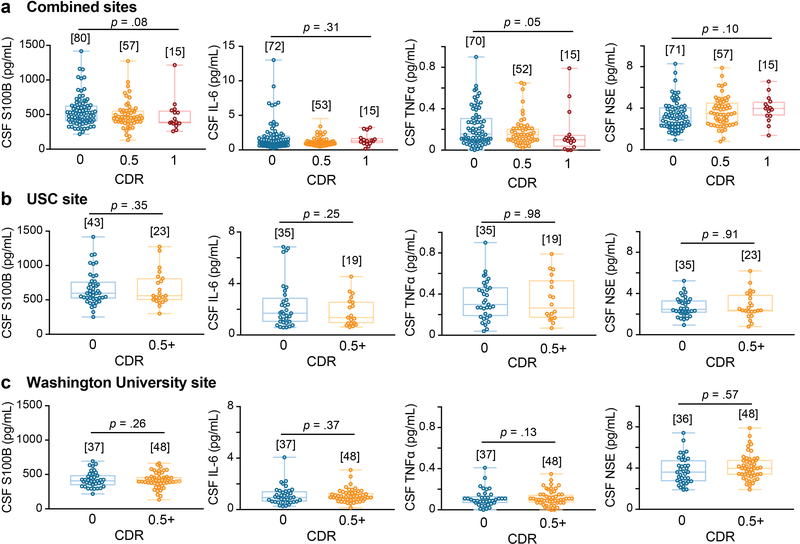
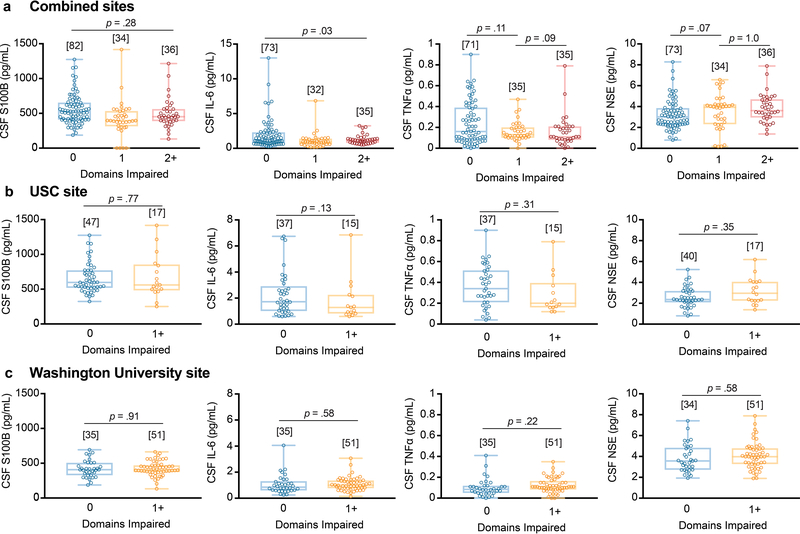
Increased CSF sPDGFRβ in impaired individuals was independent of vascular factors, as indicated by VRF burden analysis for the entire sample and confirmed by site-specific analysis (Extended Data Figure 3a-c). Of note, there were no differences in CSF biomarkers of glial and inflammatory response, or neuronal degeneration28,29 between impaired and unimpaired individuals on CDR exams, as illustrated with a few representative biomarkers out of 20 studied (see online Methods) (Extended Data Figure 4a); also confirmed by site-specific analysis (Extended Data Figure 4b-c). Collectively, our findings indicate that damage to brain capillary pericytes, which critically maintain the BBB integrity22,30,31, develops early in older adults with cognitive dysfunction, which is independent of Aβ and tau biomarker changes, is not influenced by VRFs, and is not associated with glial and/or inflammatory response, or detectable neuronal degeneration.
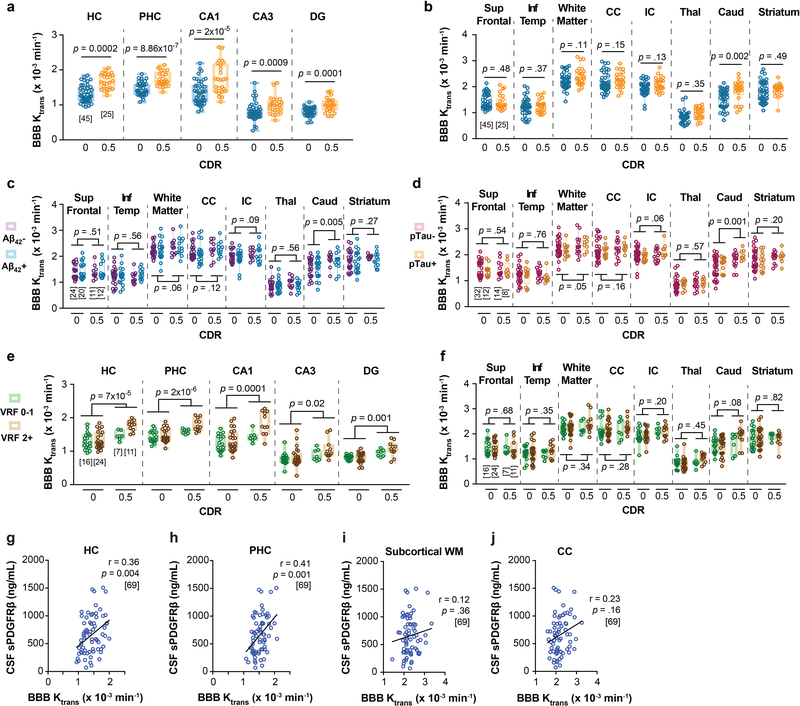
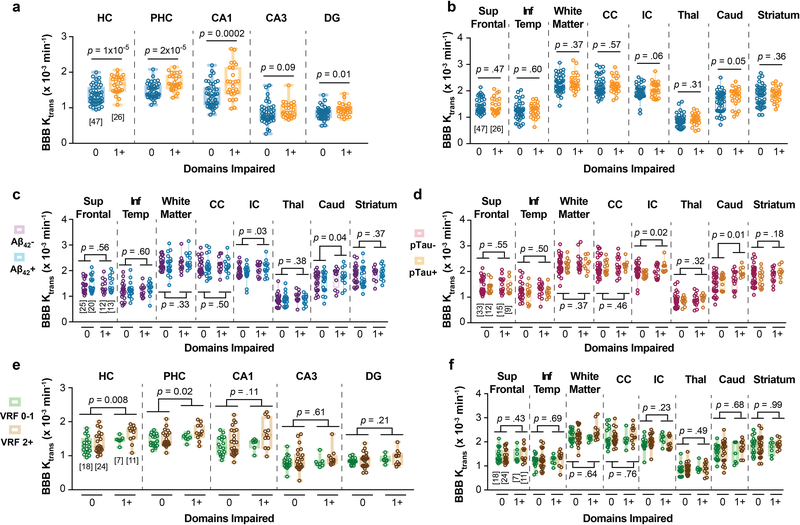
The DCE-MRI analysis of regional BBB permeability in a subset of 73 participants with CDR 0.5 compared to those with CDR 0, indicated increased BBB permeability to gadolinium-based contrast agent in the hippocampus (HC) and its CA1, CA3 and dentate gyrus subfields, and parahippocampal gyrus (PHC), but not in other studied brain regions including frontal and temporal cortex, subcortical white matter, corpus callosum, and internal capsule, and deep gray matter regions including thalamus, and striatum (Extended Data Figure 5a-b). These findings are consistent with a recent report demonstrating that BBB breakdown during normal aging and MCI starts in the HC8. Surprisingly, we also found that individuals with CDR 0.5 compared to those who were cognitively normal (CDR 0) exhibited BBB breakdown in the HC, PHC and HC subfields regardless of CSF Aβ1–42 (Figure 1g-h), and pTau (Figure 1i-j) status. Increased regional BBB permeability in HC, PHC and HC subfields remained a significant predictor of cognitive impairment after statistically controlling for CSF Aβ1–42 and pTau, as shown by estimated marginal means from ANCOVA models (Figure 1k) indicating medium-to-large incremental effect sizes (η2partial range = .09–.28), also confirmed by logistic regression models (Supplementary Table 3d-h).
The regional BBB analysis indicated that Aβ and tau status does not affect BBB integrity in other studied brain regions (Extended Data Figure 5c-d). Similar to sPDGFRβ findings, the VRF burden did not influence BBB permeability changes in the HC and PHC in individuals with CDR 0.5 compared to CDR 0, and also had no effect on BBB integrity in other studied brain regions (Extended Data Figure 5e-f). Consistent with previous findings8, in the present cohort we also observed a significant positive correlation between increases in CSF sPDGFRβ and DCE-MRI measures of BBB permeability in the HC and PHC in all studied participants (Extended Data Figure 5g-h), which was not the case for other studied brain regions, as illustrated here for the white matter regions (Extended Data Figure 5i-j).
As the present study sample excluded participants with vascular dementia and vascular cognitive impairment and substantial cerebrovascular pathology, it is probably not surprising that BBB dysfunction in the present analysis was independent of traditional systemic VRFs. The possibility of interactive or synergistic effects of traditional VRFs and BBB dysfunction in populations with more severe vascular lesions, vascular dementia and vascular cognitive impairment is not ruled out, however, by the present findings. Nevertheless, the fact that brain capillary mural cell damage and BBB breakdown is independent of traditional VRFs, as we show, is critical information that underscores the heterogeneity of vascular pathologies in the aging brain.
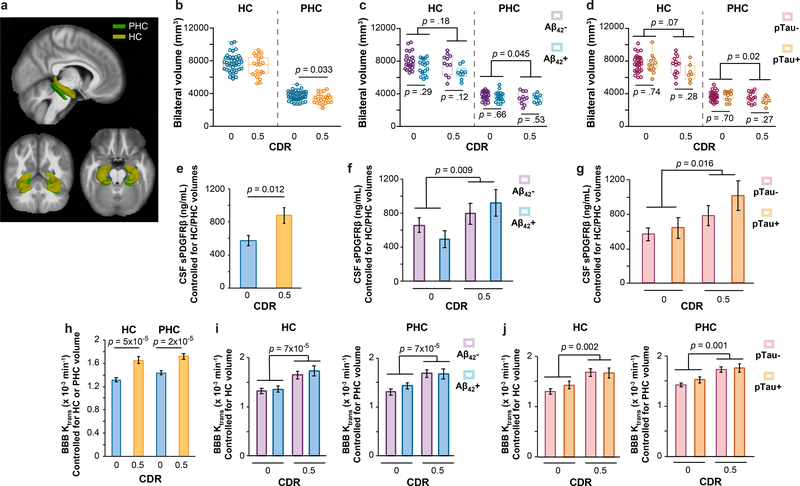
In order to address whether changes in CSF sPDGFRβ and DCE-MRI BBB permeability measures depend on HC volume, we conducted ANCOVA analyses and hierarchical logistic regression correcting for FreeSurfer-derived HC and/or PHC volumes (Figure 2a). In participants with CDR 0.5 vs. CDR 0, we found no significant changes in HC volume, but a significant decrease in PHC volume (Figure 2b). HC or PHC volumes did not statistically differ between participants that were CSF Aβ+ vs. Aβ- (Figure 2c) or pTau+ vs. pTau- (Figure 2d) in either CDR 0 or CDR 0.5 groups. Importantly, CSF sPDGFRβ increases remained significant after controlling for HC and PHC volumes (estimated as marginal means from ANCOVA models) (Figure 2e), and remained increased when stratifying by CSF Aβ1–42 and pTau status (Figure 2f-g). Similarly, HC and PHC BBB permeability increases remained significant after controlling for HC and PHC volumes, respectively (Figure 2h), and when stratifying by Aβ1–42 and pTau status (Figure 2i-j). All findings exhibited medium-to-large incremental effect sizes after controlling for HC and PHC volume (η2partial range = .09–.31) and were corroborated by logistic regression models (Supplementary Table 4a-c). Collectively, these data suggest that BBB-impairment that is represented by CSF sPDGFRβ and DCE-MRI measures is not only independent of CSF AD biomarkers, but is also not correlated to HC volume.
Figure 2. Early brain capillary damage and blood-brain barrier breakdown in human hippocampus and parahippocamapal gyrus in individuals with increased clinical dementia rating score is independent of hippocampus and parahippocampal gyrus volume.
(a) 3D-segmented brain rendering of the anatomical ROIs, hippocampus (HC) and parahippocampal gyrus (PHC), overlaid on an MRI template in 3 orientations: sagittal, axial and transverse. (b-d) Bilateral HC and PHC volumes in individuals with CDR 0 (n=43) and 0.5 (n=22) (b), Aβ- (n=23) or Aβ+ (n=19) CDR 0, and Aβ- (n=11) or Aβ+ (n=9) CDR 0.5 (c), and pTau- (n=30) or pTau+ (n=12) CDR 0, and pTau- (n=13) or pTau+ (n=7) CDR 0.5 (d). (e-g) CSF sPDGFRβ values controlled for HC and PHC volume in individuals with CDR 0 (n=39) and CDR 0.5 (n=18) (e), Aβ- (n=23) or Aβ+ (n=16) CDR 0 and Aβ- (n=10) or Aβ+ (n=8) CDR 0.5 (f), and pTau- (n=30) or pTau+ (n=12) CDR 0 and pTau- (n=13) or pTau+ (n=7) CDR 0.5 (g). Estimated marginal means ± SEM from ANCOVA models. (h-j) BBB Ktrans values in the HC and PHC controlled for respective HC or PHC volume in individuals with CDR 0 (n=42) and CDR 0.5 (n=20) (h), and in the HC and PHC controlled for respective HC or PHC volume in individuals that are Aβ- (n=23) or Aβ+ (n=19) CDR 0 and Aβ- (n=11) or Aβ+ (n=9) CDR 0.5 (i), and pTau- (n=30) or pTau+ (n=12) CDR 0 and pTau- (n=13) or pTau+ (n=7) CDR 0.5 (j). Estimated marginal means ± SEM from ANCOVA models. Box-and-whisker plot lines indicate median values, boxes indicate interquartile range and whiskers indicate minimum and maximum values. Significance tests after FDR correction from ANCOVAs with post-hoc Bonferroni comparisons.
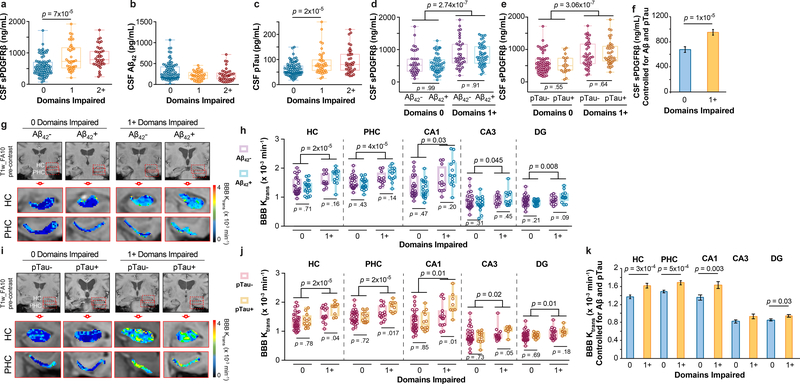
To determine whether our findings hold when cognitive dysfunction was evaluated by neuropsychological performance, we analyzed CSF biomarkers and BBB integrity using normalized scores from 10 neuropsychological tests used to evaluate impairment in memory, attention/executive function and language, and global cognition, as described in online Methods. This analysis indicated elevated CSF sPDGFRβ in participants with one cognitive domain impaired relative to those with no domains impaired (Figure 3a; see Extended Data Figure 6a-b for site-specific analyses). There was no difference, however, in CSF Aβ1–42 between participants with one domain impaired and those with no domains impaired (Figure 3b). Participants with one domain impaired showed, however, increased CSF pTau relative to those with no domains impaired (Figure 3c).
Figure 3. Early brain capillary damage and blood-brain barrier breakdown in human hippocampus and parahippocampal gyrus in individuals with increased cognitive domain impairment is independent of amyloid-β and tau status.
(a-c) CSF sPDGFRβ (a), Aβ1–42 (b) and pTau (c) levels in individuals with no cognitive domains impaired 0 (n=83), and with 1 (n=39) or 2+ (n=39) cognitive domains impaired. (d) CSF sPDGFRβ in individuals with no cognitive domains impaired that are CSF Aβ1–42 negative (Aβ-; n=35) or positive (Aβ+; n=49) and with one or more cognitive domains impaired that are Aβ- (n=37) or Aβ+ (n=47). (e) CSF sPDGFRβ in individuals with no cognitive domains impaired that are CSF pTau negative (pTau-; n=63) or positive (pTau+; n=19) and with one or more cognitive domains impaired that are pTau- (n=39) or pTau+ (n=38). (f) CSF sPDGFRβ controlled for CSF Aβ42 and pTau levels in individuals with 0 domains (n=80) and 1+ domains (n=74) impaired. Estimated marginal means ± SEM from ANCOVA models. (g-h) Representative blood-brain barrier (BBB) Ktrans maps in the hippocampus (HC) and parahippocampal gyrus (PHC) (g); quantification of Ktrans values in HC, PHC, and CA1, CA3 and dentate gyrus (DG) hippocampus subfields in individuals with no cognitive domains impaired that are Aβ- (n=25) or Aβ+ (n=20) and with one or more cognitive domains impaired that are Aβ- (n=12) or Aβ+ (n=13) (h). (i-j) Representative BBB Ktrans maps in HC and PHC (j); quantification of Ktrans values in HC, PHC, and CA1, CA3 and DG hippocampus subfields in individuals with no cognitive domains impaired that are pTau- (n=33) or pTau+ (n=12) and with one or more cognitive domains impaired that are pTau- (n=15) or pTau+ (n=9) (j). (k) Regional Ktrans values controlled for CSF Aβ and pTau levels in individuals with 0 domains (n=45) and 1+ domains (n=22) impaired. Estimated marginal means ± SEM from ANCOVA. Box-and-whisker plot lines indicate median values, boxes indicate interquartile range and whiskers indicate minimum and maximum values. Significance tests after FDR correction from ANCOVAs with post-hoc Bonferroni comparisons.
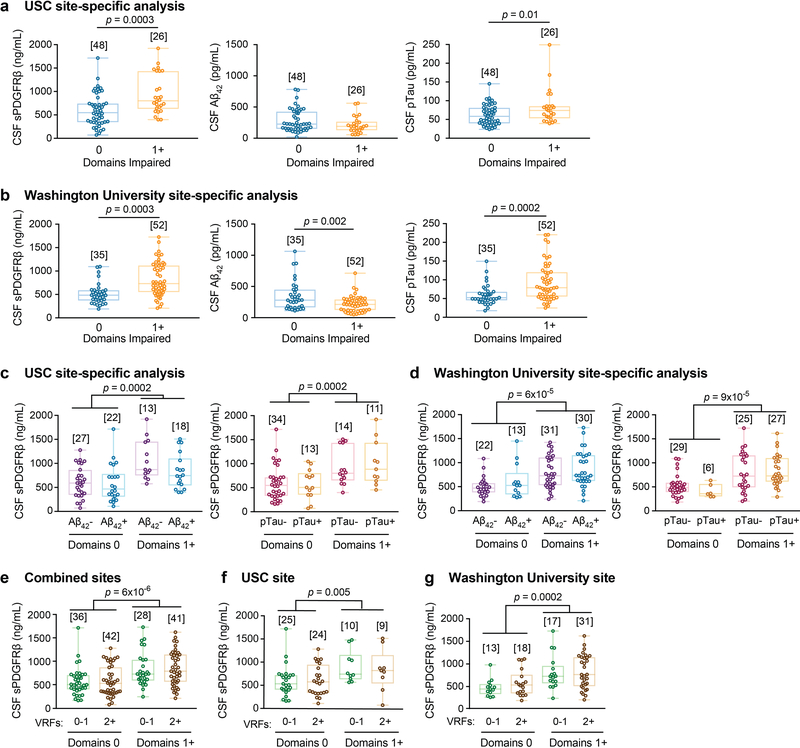
Stratification of participants into those with and without classic AD biomarker abnormalities revealed increased CSF sPDGFRβ in participants with one or more domain impaired regardless of CSF Aβ1–42 (Figure 3d) or pTau (Figure 3e) status (see Extended Data Figure 6c-d for site-specific analyses), or VRFs burden, as shown in the entire sample and confirmed by site-specific analysis (Extended Data Figure 6e-g). Higher CSF sPDGFRβ levels remained a significant predictor of cognitive impairment after statistically controlling for CSF Aβ1–42 and pTau, as shown by estimated marginal means from ANCOVA models (Figure 3f) indicating medium-to-large incremental effect sizes (η2partial range = .07–.14), which has been confirmed by logistic regression models at both sites (Supplementary Table 5a-c).
Similar as for CDR analysis, in the subset of participants who underwent PiB-PET scans, participants with domain impairment exhibited increased CSF sPDGFRβ relative to those without impairment, after statistically controlling for amyloid levels (Extended Data Figure 7a) corroborating CSF Aβ data (Figure 3d). There was no difference in CSF Aβ and tau oligomers between participants with impairment in 1 or more cognitive domains and those without cognitive impairment (Extended Data Figure 7b-c). CSF sPDGFRβ remained significantly increased in domain analysis after statistically controlling for CSF tau oligomers in ANCOVA models (Extended Data Figure 7d).
There were no differences in CSF markers of glial and/or inflammatory response, or neuronal degeneration28,29 between impaired and unimpaired participants on neuropsychological exams, as illustrated with a few examples (Extended Data Figure 8a; also confirmed by site-specific analysis in Extended Data Figure 8b-c).
Among participants undergoing DCE-MRI scans, those with domain impairment relative to those without impairment exhibited BBB breakdown in the HC, PHC and HC subfields, but not in other studied brain regions (Extended Data Figure 9a-b) regardless of CSF Aβ1–42 (Figure 3g-h; Extended Data Figure 9c) or pTau (Figure 3i-j; Extended Data Figure 9d) status, or VRF status (Extended Data Figure 9e-f). Increased regional BBB permeability in HC, PHC and HC subfields remained a significant predictor of cognitive impairment after statistically controlling for CSF Aβ1–42 and pTau, as shown by estimated marginal means from ANCOVA models (Figure 1k) indicating medium-to-large incremental effect sizes (η2partial range = .07–.18), also confirmed by logistic regression analysis (Supplementary Table 5d-h).
An increase in DCE-MRI BBB permeability in several medial temporal lobe structures that sub serve episodic memory (e.g., HC, PHC, and CA1, CA3 and dentate gyrus HC subfields) was associated with worse CDR scores (CDR 0 vs. 0.5) and with impairment in multiple cognitive domains (impairment in 0 vs. one or more domains) (Figure 1g-k; Figure 3g-k). Although this provides a perfect anatomical substrate for episodic memory impairment, it is less clear whether BBB pathology in HC and medial temporal lobe can contribute to changes seen in other domains in participants with CDR 0.5 or with impairment in multiple domains, which involves areas of the brain outside the medial temporal lobe that we found were not affected by BBB breakdown in the present cohort (Extended Data Figure 5a-b and 9a-b). Numerous studies, however, have linked HC structure and function to each of the cognitive domains and subdomains investigated in the present study. For example, experimental studies in animals and observational human studies have found that attention, working memory and executive function can become dysfunctional as a result of HC-prefrontal pathway disruption32–35. HC functional activation has been found to underpin normal performance on semantic fluency tasks36, and neuroimaging-based markers of HC structure and function correlate with performance on semantic fluency and confrontation naming tasks in both normal and pathological human aging37. Thus, BBB breakdown within the HC and medial temporal regions may disrupt the ability of these structures and their connecting pathways to support an array of cognitive functions. Additionally, we noted increased BBB permeability in the caudate nucleus (Extended Data Figure 5a-b and 9a-b), a structure known to support frontal-subcortical processes involved in attention/executive functions and verbal fluency38,39. Although less salient than the HC and PHC findings, it is possible that BBB breakdown within the caudate may contribute to the observed deficits in domains beyond memory.
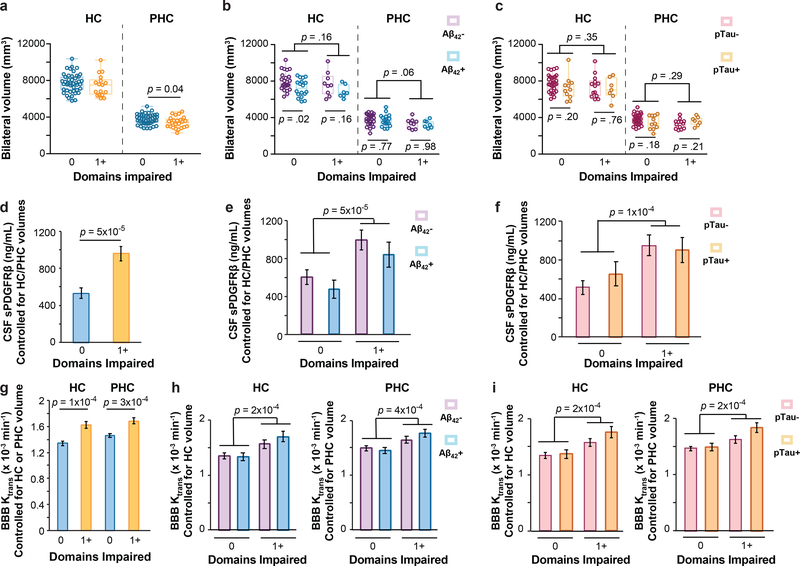
As with CDR analysis, there were no significant changes in HC volume, but a significant decrease in PHC volume, in participants with 1+ cognitive domains impaired compared to 0 domains impaired, which did not statistically differ between participants that were CSF Aβ+ vs. Aβ- or pTau+ vs. pTau- (Figure 4a-c). CSF sPDGFRβ increases remained significant after controlling for HC and PHC volumes (Figure 4d), and also remained increased when stratifying by CSF Aβ1–42 and pTau status (Figure 4e-f). HC and PHC BBB permeability increases remained significant after controlling for HC and PHC volumes (Figure 4g), respectively, and when stratifying by Aβ1–42 and pTau status (Figure 4h-i). These findings exhibited medium-to-large incremental effect sizes after controlling for HC and PHC volume (η2partial range = .19–.25) and were corroborated by logistic regression models (Supplementary Table 6a-c).
Figure 4. Early brain capillary damage and blood-brain barrier breakdown in human hippocampus and parahippocamapal gyrus in individuals with increased cognitive domain impairment is independent of hippocampus and parahippocampal gyrus volume.
(a-c) Bilateral HC and PHC volumes in individuals with 0 (n=44) and 1+ (n=24) cognitive domains impaired (a), Aβ- (n=25) or Aβ+ (n=18) with 0 domains impaired and Aβ- (n=9) or Aβ+ (n=7) with 1+ domains impaired (b), and pTau- (n=32) or pTau+ (n=11) with 0 domains impaired and pTau- (n=13) or pTau + (n=7) with 1+ domains impaired (c). (d-f) CSF sPDGFRβ controlled for HC and PHC volume in individuals with 0 domains (n=38) and 1+ domains (n=21) impaired (d), and Aβ- (n=30) or Aβ+ (n=12) 0 domains impaired and Aβ- (n=15) or Aβ+ (n=7) 1+ domains impaired (e), and pTau- (n=30) or pTau+ (n=12) 0 domains impaired and pTau- (n=13) or pTau+ (n=7) 1+ domains impaired (f). Estimated marginal means ± SEM from ANCOVA models. (g-i) BBB Ktrans values in the HC and PHC controlled for respective HC or PHC volume in individuals with 0 domains impaired (n=44) and 1+ domains impaired (n=21) (g), and in the HC and PHC controlled for respective HC or PHC volume in participants that are Aβ- (n=24) or Aβ+ (n=18) 0 domains impaired and Aβ- (n=12) or Aβ+ (n=10) 1+ domains impaired (h), and pTau- (n=30) or pTau+ (n=12) 0 domains impaired and pTau- (n=13) or pTau+ (n=7) 1+ domains impaired (i). Estimated marginal means ± SEM from ANCOVA models. Box-and-whisker plot lines indicate median values, boxes indicate interquartile range and whiskers indicate minimum and maximum values. Significance tests after FDR correction from ANCOVAs with post-hoc Bonferroni comparisons.
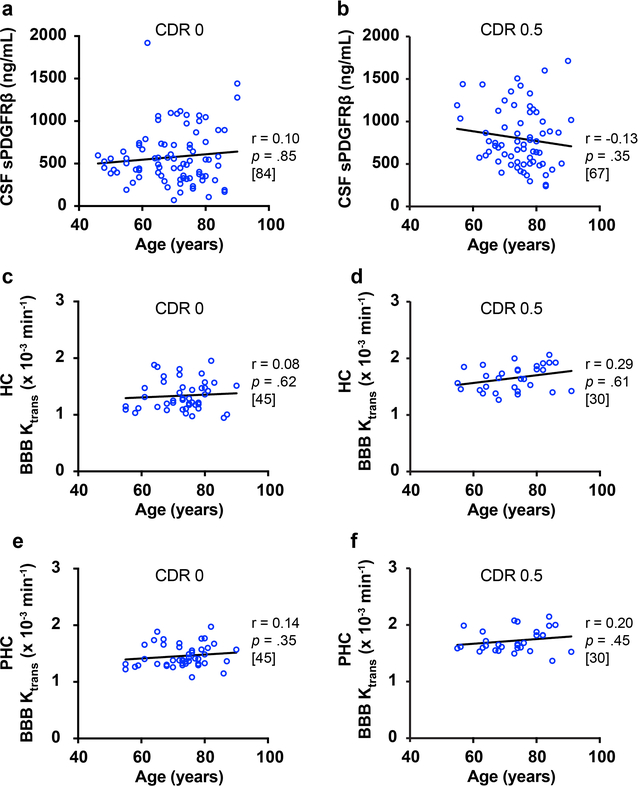
Finally, we asked did CSF sPDGFRβ and DCE-MRI BBB increases correlate with age? Neither CSF sPDGFRβ (Extended Data Figure 10a-b) nor regional BBB permeability HC and PHC values (Extended Data Figure 10c-f) were correlated with age in either the CDR 0 or CDR 0.5 groups. Since all CDR and domain impairment group differences in CSF sPDGFRβ and in HC and PHC BBB permeability values were significant after age-corrections (Figure 1; Figure 3), these data indicate that CSF sPDGFRβ and HC and PHC BBB measures reflect cognitive impairment independent of normal aging, and therefore may be good biomarkers of early cognitive dysfunction.
In summary, we show that older adults with early cognitive dysfunction develop brain capillary damage associated with mural cell pericyte injury and BBB breakdown in the HC irrespective of Aβ and/or tau changes, suggesting that BBB breakdown is an independent, early biomarker of cognitive impairment unrelated to Aβ and tau. The independence of the BBB breakdown pathway from Aβ/tau pathway in predicting cognitive impairment is further supported by logistic regression models indicating that BBB breakdown is not mediating the relationship between AD biomarkers and cognitive impairment (Supplementary Tables 7–10). Biomarker-based diagnostic approaches, including the recent research recommendations for AD17, mention vascular biomarkers, but suggest that CSF Aβ1–42 and pTau and amyloid PET and tau PET are the key biomarkers defining AD pathology, although they may not be causal to the disease process5,17,40. Our present findings support that neurovascular dysfunction may represent a previously underappreciated factor contributing to cognitive and functional decline, independent of the classic pathophysiological hallmarks of AD. Moreover, our findings point to the brain vasculature as an important new biomarker of cognitive dysfunction in both individuals without and with Aβ or pTau positivity, the latter indicating individuals in the Alzheimer’s continuum17.
Online Methods
Study Participants
Participants were recruited from two sites, including the University of Southern California (USC), Los Angeles, CA, and Washington University, St. Louis, MO. At the USC site, participants were recruited through the USC Alzheimer’s Disease Research Center (ADRC): combined USC and the Huntington Medical Research Institutes (HMRI), Pasadena, CA. At the Washington University site, participants were recruited through the Washington University Knight ADRC. The study and procedures were approved by the Institutional Review Board of USC ADRC and Washington University Knight ADRC indicating compliance with all ethical regulations, and informed consent was obtained from all participants prior to study enrollment. Participants from both sites were included in cerebrospinal fluid (CSF) biomarker studies. All participants underwent neurological and neuropsychological evaluations performed using the Uniform Data Set (UDS), and additional neuropsychological tests, as described below. Participants from the USC ADRC were included in dynamic contrast-enhanced (DCE)-MRI studies for assessment of blood-brain barrier (BBB) permeability if they had no contraindications for contrast injection or MRI.
We included 161 participants for CSF biomarker studies (74 from USC/HMRI and 87 from Washington University). A group of 35 participants from the Washington University Knight ADRC underwent Pittsburgh compound B (PiB)-positron emission tomography (PET) imaging for amyloid. A group of 73 participants recruited from the USC ADRC underwent DCE-MRI. All biomarker assays and quantitative MRI scans were conducted by investigators blinded to the clinical status of the participant.
Inclusion/Exclusion Criteria
Included participants (≥45 years of age) with neuropsychologically-confirmed no cognitive dysfunction and/or early cognitive dysfunction had no current or prior history of any neurological or psychiatric conditions that might better account for any observed cognitive impairment, including organ failure, brain tumors, epilepsy, hydrocephalus, schizophrenia, major depression. Participants were stratified based on CSF analysis as either Aβ1–42-positive (Aβ1–42+, <190 pg/mL) or Aβ1–42-negative (Aβ-, >190 pg/mL), or pTau181-positive (pTau+, >78 pg/mL) or pTau181-negative (pTau-, <78 pg/mL), using the accepted cutoff values19–21. Participants were excluded if they were diagnosed with vascular cognitive impairment or vascular dementia. These clinical diagnoses were conducted by neurologists and the criteria whether the patient 1) had a known vascular brain injury and 2) the clinician judged that the vascular brain injury played a role in their cognitive impairment, and/or pattern and course of symptoms. In addition to clinical diagnosis, presence of vascular lesions was confirmed by moderate-to-severe white matter changes and lacunar infarcts by fluid-attenuated inversion recovery (FLAIR) MRI and/or subcortical microbleeds by T2*-weighted MRI13. Participants were also excluded if they were diagnosed with Parkinson’s disease, Lewy body dementia or frontotemporal dementia. History of a single stroke or transient ischemic attack was not an exclusion unless it was related to symptomatic onset of cognitive impairment. Participants also did not have current contraindications to MRI and were not currently using medications that might better account for any observed cognitive impairment.
Clinical Dementia Rating (CDR)
Clinical Dementia Rating (CDR) assessments followed the standardized UDS procedures. Participants underwent clinical interview, including health history, and a physical exam. Knowledgeable informants were also interviewed. Given the lack of scientific consensus regarding the categorization of older adults along the aging-to-MCI-to-AD dementia spectrum and the time course and sequence of biomarker abnormalities, we did not use clinical diagnosis in our biomarker comparisons but rather stratified participants along objective neuropsychological metrics of cognitive impairment and biological metrics of AD biomarker status using established cutoffs19,20. Participant CDR score was obtained through standardized interview and assessment with the participant and a knowledgeable informant.
Neuropsychological Evaluation and Domains of Impairment
Neuropsychological performance was used to identify domain impairment. All participants underwent neuropsychological testing using the UDS battery (v2.0 or 3.0) plus supplemental neuropsychological tests at each site. Test impairment for UDS tests was determined using age-, sex- and education-corrected scores from the National Alzheimer’s Coordinating Center (NACC) (www.alz.washington.edu). Normalized scores from a total of 10 neuropsychological tests were used in determining domain impairment, including three tests per cognitive domain (memory, attention/executive function and language) and one test of global cognition. Domain impairment was determined using previously described neuropsychological criteria21, and was defined as a score >1 standard deviation (SD) below norm-referenced values on two or more tests within a domain41. Multiple domain impairment (2+) was assigned when more than one domain fit the impairment criteria, or three or more tests were impaired across domains21,41. Prior studies have established improved sensitivity and specificity of these criteria relative to those employing a single test score, as well as adaptability of this diagnostic approach to various neuropsychological batteries21,41,42. Cognition was presumed normal unless multiple impaired tests were identified as specified by the criteria. Individuals with low Mini Mental State Exam (MMSE) or Montreal Cognitive Assessment (MOCA) scores (<25) who had multiple missing neuropsychological test scores due to difficulty completing testing were considered to have domain impairment. Test battery specifics for each UDS version and recruitment site are listed below.
Global cognition
Mini Mental State Exam (MMSE) for UDS v2 and Montreal Cognitive Assessment (MOCA) for UDS v3.
Memory
The Logical Memory Story A Immediate and Delayed free recall tests [modified from the original Wechsler Memory Scales – Third Edition (WMS-III)] for UDS v2 and the Craft Stories Immediate and Delayed free recall for UDS v3. For supplemental tests the USC participants underwent the California Verbal Learning Test – Second Edition (CVLT-II) and the Selective Reminding Test (SRT) sum of free recall trials. Norm-referenced scores for these supplemental test scores were derived from a nationally representative sample published with the test manual (CVLT-II)43 and in studies of normally aging adults (SRT).
Attention / Executive Function
The Trails A, Trails B and Wechsler Adult Intelligence Scale - Revised (WAIS-R) Digit Span Backwards tests for UDS v2 and the Trails A, Trails B and Number Span Backwards for UDS v3.
Language
The Animal Fluency, Vegetable Fluency and Boston Naming Tests for UDS v2 and the Animal Fluency, Vegetable Fluency and Multilingual Naming Test (MINT) for UDS v3.
Vascular Risk Factors
Participant vascular risk factor (VRF) burden was evaluated through physical exam, clinical blood tests and interviews with the participant and informant, and included history of cardiovascular disease (heart failure, angina, stent placement, coronary artery bypass graft, intermittent claudication), hypertension, hyperlipidemia, type 2 diabetes, atrial fibrillation, and transient ischemic attack (TIA) or minor stroke, and total VRF burden was defined by the sum of these risk factors. We have previously shown that older adults with AD exhibiting two or more VRFs are more likely to exhibit occult cerebrovascular disease at autopsy, whereas a single VRF is common and not necessarily associated with increased cerebrovascular disease in this population44,45. Thus, elevated VRFs burden was defined as having two or more VRFs.
Lumbar Puncture and Venipuncture
Participants underwent lumbar puncture in the morning after an overnight fast. The CSF was collected in polypropylene tubes, processed (centrifuged at 2000 rcf, 10 minutes, 4°C), aliquoted into polypropylene tubes and stored at −80°C until assay. Participants underwent venipuncture in the morning after an overnight fast. Blood was collected into EDTA tubes and processed (centrifuged at 2000 rcf, 10 minutes, 4°C). Plasma and buffy coat were aliquoted in polypropylene tubes and stored at −80°C; buffy coat was used for DNA extraction and APOE genotyping.
APOE Genotyping
DNA was extracted from buffy coat using the Quick-gDNA Blood MiniPrep (Cat. No. D3024, Zymo Research, Irvine, CA). APOE genotyping was performed using polymerase chain reaction restriction fragment length polymorphism approach (PCR-RFLP). The PCR was amplified in a 50 μL reaction with Qiagen reagents (Qiagen Cat. #201203 and 201900). Two primers were used to amplify a 318 base pair fragment: upstream sequence (5’ ACTGACCCCGGTGGCGGAGGAGACGCGTGC) and downstream sequence (5’ TGTTCCACC AGGGGCCCCAGGCGCTCGCGG). The upstream primer introduces an AflIII site in the amplified product, yielding a unique RFLP pattern for each APOE allele following enzymatic digestion. The PCR reaction mixture was incubated at 94°C for 3 min, then 40 cycles of amplification (94°C, 10 sec; 65°C, 30 sec; 72°C, 30 sec), and finally elongation at 72°C for 7 min. Restriction digests containing 10 μl amplicons and either 2.5 U AflIII or 1.5 U HaeII were incubated at 37°C overnight. The digested products were analyzed on a 4% agarose gel. APOE genotype was determined from the unique digestion pattern: APOE2/2 [A: 231; H: 267], APOE2/3 [A: 231; H: 231 and 267], APOE2/4 [A: 231 and 295; H: 231 and 267], APOE3/3 [A: 231; H: 231], APOE3/4 [A: 231 and 295; H: 231], and APOE4/4 [A: 295; H: 231]; the brackets denote base pairs of amplicons following the AflIII (A) and HaeII (H) digestions.
Molecular Biomarkers in the Cerebrospinal Fluid (CSF) Assays
Quantitative Western Blotting of sPDGFRβ
The quantitative Western blot analysis was used to detect sPDGFRβ in human CSF (ng/mL), as we previously reported8. Standard curves were generated using recombinant human PDGFRβ (Cat. No. 385-PR-100/CF, R&D Systems, Minneapolis, MN).
Astrocyte marker
CSF levels of the astrocytic cytokine, S100B, were determined using ELISA (Cat. No. EZHS100B-33K, EMD Millipore, Billerica, MA).
Inflammatory markers
Meso Scale Discovery (MSD) multiplex assay was used to determine CSF levels of interleukin-2 (IL-2), IL-4, IL-6, IL-8, IL-10, IL-12p70, IL-13, IL-1β, tumor necrosis factor α (TNF-α), and interferon γ (IFN-γ) (Cat. No. K15049G, MSD, Rockville, MD).
Amyloid-β peptide
MSD multiplex assay (Cat. No. K15200E, MSD, Rockville, MD) was used to determine CSF levels of Aβ38, Aβ40 and Aβ42. The CSF Aβ42 cutoff level of 190 pg/mL was applied as previously reported for the MSD Aβ peptide assay19.
Amyloid-β oligomers
CSF Aβ oligomers were measured by ELISA (protocol modified from IBL Cat. No. 27725 and Holtta et al46). Aβ1–16 peptide dimer was used as the standard protein prepared at 0, 1, 2.5, 5, 7.5, 10, 15, 20 pM, and 100 μL of prepared standards and neat CSF were added to each well on an uncoated 96-well plate along with 20 μL/well of HRP-conjugated anti-human Aβ (N) (82E1) mouse IgG monoclonal antibody; the plates were incubated overnight at 4°C on an orbital plate shaker at 600 rpm. 100 μL/well was transferred to a 96-well plate precoated with anti-human Aβ (N) (82E1) mouse IgG monoclonal antibody and incubated for 1 hour at 4°C with shaking. Plates were washed (Tris buffered saline with 0.1% Tween-20, TBST) and ELAST ELISA amplification was performed (Perkin Elmer). Briefly, 100 μL/well of biotinyl-tyramide (1:100 dilution) was incubated for 15 minutes at room temperature with shaking. Plates were washed and 100 μL/well of streptavidin-HRP (1:500 dilution) was incubated for 30 minutes at room temperature with shaking. Plates were washed and 100 μL/well of tetramethylbenzidine (TMB) substrate (Kirkegaard & Perry Laboratories Cat. No. 53–00-01) was incubated in the dark for 60 minutes, then 100 μL/well of 2N HCl was added, and the plates were read at 450 nm.
Tau
MSD assay was used to determine CSF levels of total tau (Cat. No. K15121G, MSD, Rockville, MD). Phosphorylated tau (pT181) was determined by ELISA (Cat. No. 81581, Innotest, Belgium). The CSF pTau181 cutoff level of 78 pg/mL was applied as previously reported20.
Tau oligomers
CSF tau oligomers were measured by direct ELISA using tau oligomer-specific antibody (T22)47. Briefly, 12 μL CSF was diluted in a total volume of 50 μL 0.05 M carbonate-bicarbonate buffer, added to a 96-well MaxiSorp plate (Nunc) and incubated overnight at 4°C on an orbital plate shaker at 600 rpm. Plates were washed (TBST) and blocked with 300 μL of 10% nonfat dry milk (BioRad) for 2 hours room temperature with shaking. Plates were washed and incubated with 100 μL/well of T22 antibody (1:250 diluted in 5% nonfat milk) and incubated for 1 hour at room temperature with shaking. Plates were washed and incubated with HRP-conjugated anti-rabbit IgG antibody (1:3000 diluted in 5% nonfat dry milk) and incubated for 1 hour at room temperature with shaking. Plates were washed and incubated in the dark with 100 μL/well TMB substrate for 14 minutes, then 100 μL/well 2N HCl was added, and the plates were read at 450 nm.
Neuronal marker
CSF levels of neuron specific enolase (NSE) were determined using ELISA (Cat. No. E-80NEN, Immunology Consultant Laboratories, Portland, OR).
In vitro analysis of sPDGFRβ shedding
Primary human brain mural cell isolation and culture
Primary human brain vascular smooth muscle cells (SMCs) were isolated from leptomeningeal arteries (>100 μm diameter) as described and characterized as reported18. SMCs were >98% positive for α-smooth muscle actin (SMA), myosin heavy chain, calponin and SM22 and negative for von Willebrand factor (endothelial cells), GFAP (astrocytes) and CD11b (microglia). Cells were cultured in smooth muscle cell medium (Cat. No. 1101, ScienCell) in 5% CO2 at 37°C. Early passage (P5-P6) cultures were used in the present study.
Primary human brain microvascular pericytes were isolated from cortical brain tissue after removal of leptomeninges as previously described18,48. Pericytes were derived from intraparenchymal microvessels that were completely free from leptomeningeal vessel contamination. Purified microvessels were largely brain capillaries (>97%) with diameter <6 μm. Cells were cultured in human pericyte medium (Cat. No. 1201, ScienCell) in 5% CO2 at 37°C and were then characterized. Pericytes were positive for the pericyte markers PDGFRβ, NG2 and CD13 and negative for von Willebrand factor (endothelial cells), GFAP (astrocytes) and CD11b (microglia). Early passage (P5-P6) cultures were used in the present study.
Treatment conditions
Primary human brain SMCs and pericytes were plated in equal cell number for all conditions. For ADAM10 knockdown, accell ADAM10 siRNA (Cat. No. E-004503–00-0010, Dharmacon) at a final concentration of 1 μM in Acell Delivery Media (Cat. No. B-005000–500, Dharmacon) was added into 90% confluent cultured pericytes in twelve-well tissue culture plates and after 96 hours as recommended by the manufacturer, cells underwent treatment conditions. Specifically, cells were subjected to treatment with ionomycin (2.5 μM) and/or marimastat (4 μM) prepared in reduced serum OptiMEM (Gibco) or media only (control condition) for 40 minutes at 37°C, as previously described27. After the 40-minute treatment, the media and cell lysates were collected for additional analysis described below.
Immunoprecipitation of sPDGFRβ
Immunoprecipitation was performed on the pericyte and SMCs media as described by the manufacturer with optimizations (all wash steps performed as described). For antibody-bead coupling, 50 μL protein G Dynabeads (Cat. No. 10004D, Invitrogen) and 2 μg of PDGFRβ antibody (goat anti-human, Cat. No. AF385, R&D Systems) were incubated with rotating for 10 minutes at room temperature. Conditioned media and equal volume lysis buffer were added to the Dynabeads-coupled PDGFRβ antibody and incubated with rotating for 30 minutes at room temperature. Target antigen was eluted in denaturing conditions and quantitative Western immunoblot was performed as described below.
Western immunoblot analysis
Quantitative Western immunoblot on immunoprecipitated media was performed using carrier-free human recombinant PDGFRβ as a protein standard (Cat. No. 385-PR/CF, R&D Systems). Gel transfer was performed using iBlot2 (R&D Systems) at 20 V for 9 minutes. The nitrocellulose membrane was incubated with SuperBlock-TBST (Thermo Fisher Scientific) for 1 hour at room temperature and primary antibody (Cat. No. AF385, R&D Systems, 1 μg/mL) prepared in SuperBlock was incubated overnight at room temperature with shaking. Secondary anti-goat antibody (1:5000) prepared in 5% nonfat dry milk was incubated for 1 hour at room temperature with shaking. SuperSignal West Pico PLUS (Thermo Fisher Scientific) and film was used to develop the membrane, and sample protein concentration (ng/ml) was calculated.
Western immunoblot analysis of primary human brain pericyte cell lysates was performed with primary antibodies ADAM10 (Cat. No. ab124695, Abcam) and GAPDH (Cat. No. 2118L, Cell Signaling).
Magnetic Resonance Imaging
The MR data set was obtained at Keck Medical Center of USC. The study was approved by the USC Institutional Review Board. All participants underwent a blood draw to ensure appropriate kidney function for contrast agent (CA) administration prior to imaging. The imaging protocol performed was developed to detect subtle BBB changes in patients with cognitive impairment and is detailed in Montagne et al. 20158. Briefly, all images were obtained on a GE 3 T HDXT MR scanner with a standard eight-channel array head coil. Anatomical coronal spin echo T2-weighted scans were first obtained through the hippocampi (TR/TE 1550/97.15 ms, NEX = 1, slice thickness 5 mm with no gap, FOV = 188 × 180 mm, matrix size = 384 × 384). Baseline coronal T1-weighted maps were then acquired using a T1-weighted 3D spoiled gradient echo (SPGR) pulse sequence and variable flip angle method using flip angles of 2°, 5° and 10°. Coronal dynamic contrast-enhanced (DCE)-MRI covering the hippocampi and temporal lobes were acquired using a T1-weighted 3D SPGR pulse sequence (FA = 15°, TR/TE = 8.29/3.09 ms, NEX = 1, slice thickness 5 mm with no gap, FOV 188 × 180 mm, matrix size 160 × 160, voxel size was 0.625 × 0.625 × 5 mm3). This sequence was repeated for a total of 16 min with an approximate time resolution of 15.4 s. Gadolinium-based CA, Gadobenate dimeglumine (MultiHance®, Bracco, Princeton, New Jersey) or Gadoterate meglumine (Dotarem®, Guerbet, France) (0.05 mmol/kg) was administered intravenously into the antecubital vein using a power injector, at a rate of 3 mL/s followed by a 25 mL saline flush, 30 s into the DCE scan.
Quantification of the Subtle Blood-Brain Barrier Permeability
Post-processing analysis was performed using Rocketship49 running with Matlab. The arterial input function (AIF), which was extracted from a region-of-interest (ROI) positioned at the internal carotid artery, was fitted with a bi-exponential function prior to fitting with Patlak model50. The Patlak linearized regression mathematical analysis was used to generate the BBB permeability Ktrans maps8,49,50 with high spatial and temporal resolutions allowing not only simultaneous measurements of the regional BBB permeability in different white (WM) and gray matter (GM) regions, but also accurate calculations of the Ktrans values in anatomical regions as small as the subdivisions of the hippocampus. We determined in each individual AIF from the internal carotid artery. In a few cases when the common carotid artery was not clearly visible a nearby large vessel was used. Individual AIF measurements are important particularly if the studied population diverges by age as changes in blood volume and flow may affect AIF and the Ktrans measurements.
The present analysis requires that the tracer’s diffusion across the BBB remains unidirectional during the acquisition time. The total tracer concentration in the tissue, Ctissue (t), can be described as a function of the blood concentration, CAIF (t), the intravascular blood volume, vp, and a blood-to-brain transfer constant, Ktrans, that represents the flow from the intravascular to the extravascular extracellular space using equation below:
A statistically significant intersubject variability in the measurement of vp was not observed.
ROI-averaged analysis of DCE-MRI output maps was performed by an experienced neuroradiologist who manually drew ROIs for each participant based on their own anatomy since a substantial variability between individuals is seen at a macroscopic level (e.g., enlarged ventricles, cortical atrophy, hippocampal shrinkage, etc.). Thus, the regional BBB Ktrans permeability were measured in 13 different GM ROIs including the hippocampi [HC] and their subfields (i.e., CA1, CA3, and dentate gyrus [DG]), parahippocampus [PHC], caudate nucleus [Caud], superior frontal cortical gyri [SFG Cx], inferior temporal cortical gyri [ITG Cx], thalamus [Thal], and striatum [Str] and WM ROIs including subcortical white matter fibers [SubP WM fibers], corpus callosum (CC), and internal capsule (IC).
Quantification of Regional Brain Volumes
HC and PHC morphometry were performed using the FreeSurfer (v5.3.0) software package51, which is documented and freely available online (http://surfer.nmr.mgh.harvard.edu/). In brief, HC and PHC gyri were segmented using the included FreeSurfer Desikan-Killiany and subcortical atlases52,53. Then, regional volumes (mm3) were derived accordingly. The technical details of this procedure are described in previous publications54,55. Data processing was performed using the Laboratory of Neuro Imaging (LONI) pipeline system (http://pipeline.loni.usc.edu)56,57.
Positron Emission Tomography
Pittsburgh compound B (PiB)-positron emission tomography (PET) imaging was conducted at Washington University Knight ADRC using procedures and analysis as previously described58,59.
Statistical Analyses
All continuous variables were screened for outliers (+/− 3 SDs from mean) and evaluated for departures from normality through quantitative examination of skewness and kurtosis, as well as visual inspection of frequency distributions. Where departures of normality were identified, log10-transformations were applied, and distribution normalization was confirmed prior to parametric analyses. Participant demographics and clinical characteristics were initially compared across both CDR and domain impairment stratifications using chi-square tests and one-way ANOVAs, with post-hoc Tukey tests.
All CSF biomarkers were compared in parallel analyses applied across the entire sample stratified by the global CDR score and the number of impaired cognitive domains using ANCOVA, with post-hoc Bonferroni corrected comparisons. For CDR analyses, model covariates included age, sex, education and APOE-ε4 carrier status. For domain impairment analyses, age, sex and education-corrected values were used to identify impairment groups and APOE-ε4 carrier status was used as a covariate. Site-specific analyses and interaction effect analyses did not include APOE-ε4 carrier status as a covariate to conserve statistical power. For analysis of interactions by Aβ1–42, pTau and VRF burden, statistical interactions and main effects were examined in similar ANCOVA models.
The same approach described above was used in all analyses of other CSF glial, inflammatory and neuronal markers, and for DCE-MRI data. With regard to missing data, all participants had complete data for primary outcomes (CSF sPDGFRβ and DCE-MRI), and the extent of missing data was capped at < 10% for all other CSF biomarkers and clinical measures (i.e., >90% of participants had complete data).
Given the large number of analyses, false discovery rate (FDR)-correction was applied to all ANCOVA omnibus p-values using the Benjamini-Hochberg method60.
Where significant CSF sPDGFRβ and BBB Ktrans findings were identified (CDR 0.5 vs. 0 and domain impairment 1+ vs. 0), separate post-hoc analyses of CSF sPDGFRβ and BBB Ktrans differences controlling for CSF Aβ1–42 and pTau, PiB-PET amyloid deposition, pTau oligomers, and HC and PHC volumes also utilized ANCOVA models. In addition, separate hierarchical logistic regression analyses evaluated whether CSF sPDGFRβ and BBB Ktrans predicted cognitive impairment (CDR 0.5 vs. 0 and domain impairment 1+ vs. 0) after controlling for CSF Aβ1–42 and pTau, PiB-PET amyloid deposition, pTau oligomers, and HC and PHC volumes. For both ANCOVA and logistic regression analyses, covariates were entered into the model in the first block and in the second block either CSF sPDGFRβ or specific regional BBB Ktrans values were entered. Additional demographics and APOE4 carrier status were included in overall models correcting for CSF Aβ1–42 and pTau, and models correcting for HC and PHC volumes.
Extended Data
Extended Data Figure 1. ADAM10 mediates soluble PDGFRβ (sPDGFRβ) shedding in human brain pericytes in vitro.
(a) Primary human brain vascular smooth muscle cells (SMCs) and pericytes were subjected to treatment with ionomycin (IM) (2.5 μM), a calcium ionophore that activates ADAM10, or control treatment (media only), and media was immunoprecipitated (IP) to measure sPDGFRβ by quantitative Western immunoblot. Compared to pericytes, SMCs shed extremely low levels of sPDGFRβ, which was not significantly increased by IM. Pericytes shed high basal levels of sPDGFRβ that was significantly increased by > 5-fold by treatment with IM, which activated ADAM10. To further determine ADAM10’s involvement, IM treatment was conducted in the presence of ADAM10 pharmacological inhibition with marimastat (MM, 4 μM) that inhibits ADAM10 by binding to active site zinc, and genetic siRNA knockdown of ADAM10. Both pharmacologic (MM) and genetic (siRNA) inhibition of ADAM10 significantly reduced sPDGFRβ shedding activated by IM by > 90% and 75%, respectively. (b) The siRNA ADAM10 knockdown efficiency in this study was 85% as shown by Western analysis. Data generated from n=3–6 independent culture experiments and plotted as means ± SEM. Statistical analyses: Panel a: SMC data by two-tailed Student’s t-test; pericyte data by ANOVA with Tukey post-hoc test. Panel b: Two-tailed Student’s t-test. Significance at α=0.05 for all analyses.
Extended Data Figure 2. CSF sPDGFRβ increases with CDR impairment, independent of Aβ and tau, and reflects blood-brain barrier (BBB) breakdown.
(a-b) Site-specific analysis of CSF sPDGFRβ and standard AD biomarkers, Aβ42 and pTau, indicates an early increase in sPDGFRβ with increasing CDR in both independent clinical sites, USC (a) and Washington University (b). There were no changes in Aβ42 and pTau at USC site (a), whereas Aβ42, but not pTau, was altered at Washington University site; supports Figure 1 a-c. (c-d) Site-specific analysis of CSF sPDGFRβ increases with CDR, independent of CSF Aβ42 and pTau status in two independent sites, USC (c) and Washington University (d); supports Figure 1 d-f. (e-f) CSF sPDGFRβ is associated with blood-brain barrier (BBB) breakdown. CSF sPDGFRβ positively correlates with conventional biochemical biomarkers of BBB breakdown including CSF:plasma albumin ratio (Qalb) (e) and CSF fibrinogen (f); supports Figures 1 and 3. (g) CSF sPDGFRβ is increased with CDR, independent of amyloid positivity by (11)C-Pittsburgh compound B positron emission tomography (PiB-PET); supports Figure 1 d and f. (h-i) No differences were observed in CSF Aβ oligomer levels (h) and tau oligomer levels (i) in individuals with CDR 0 vs. CDR 0.5; supports Figure 1 d-f. (j-k) Increases in CSF sPDGFRβ (j) and regional BBB Ktrans in the hippocampus (HC) and parahippocampal gyrus (PHC) (k) of individuals with CDR 0.5 vs. CDR 0 remain significant after statistically controlling for the impact of CSF tau oligomers; supports Figure 1 d-f. Panels a-d, g-i: Box-and-whisker plot lines indicate median values, boxes indicate interquartile range and whiskers indicate minimum and maximum values. Panels a-d, g: significance tests from ANCOVAs. Panels e-f: Statistical significance determined by Pearson correlation; r = Pearson correlation coefficient. Panels h-i: Significance by two-tailed Student’s t-test at α=0.05. Panels j-k: ANCOVA models representing estimated marginal means ± SEM. Brackets denote sample size (n) in each analysis.
Extended Data Figure 3. sPDGFRβ increases with CDR independent of vascular risk factors (VRFs), and no change in other neurovascular unit biomarkers.
(a-c) CSF sPDGFRβ is increased with CDR, independent of VRFs burden in the combined site analysis (a) and in two independent clinical sites from USC (b) and Washington University (c). VRFs 0–1: no or 1 vascular risk factor. VRFs 2+: 2 or more vascular risk factors. See Supplementary Table 1 for the list of VRFs; supports Figure 1 a-f. Box-and-whisker plot lines indicate median values, boxes indicate interquartile range and whiskers indicate minimum and maximum values. Significance tests from ANCOVAs. Brackets denote sample size (n) in each analysis.
Extended Data Figure 4. Other CSF biomarkers of the neurovascular unit are not altered with CDR cognitive impairment.
(a-c) CSF markers of glial, inflammatory, or neuronal injury exhibited no significant differences between unimpaired and impaired individuals on CDR, including S100 calcium-binding protein B (S100B), interleukin-6 (IL-6), tumor necrosis factor-α (TNFα), or neuron-specific enolase (NSE) in the combined site analysis (a) and similarly in site-specific analysis of individuals from USC (b) and from Washington University (c); supports Figure 1 a-c. Box-and-whisker plot lines indicate median values, boxes indicate interquartile range and whiskers indicate minimum and maximum values. Significance tests from ANCOVAs. Brackets denote sample size (n) in each analysis.
Extended Data Figure 5. Regional blood-brain barrier (BBB) breakdown Ktrans increases with CDR independent of CSF Aβ and tau and vascular risk factors (VRFs), and relates to sPDGFRβ only in hippocampal gray matter regions.
(a-b) An increase in Ktrans values in the hippocampus (HC), parahippocampal gyrus (PHC) and CA1, CA3 and dentate gyrus (DG) hippocampus subfields, with increasing CDR (a), but not in other brain regions including superior frontal cortical gyrus (Sup Front) and inferior temporal cortical gyrus (Inf Temp), white matter regions including subcortical white matter fibers (white matter, WM), corpus callosum (CC), and internal capsule (IC), and deep gray matter regions including thalamus (Thal), caudate nucleus (Caud) and striatum (b). (c-d) Additional brain regions showed no significant differences in Ktrans BBB permeability values in individuals with CDR 0 and CDR 0.5, regardless of CSF Aβ42 (c) or pTau (d) status. (e-f) VRFs burden does not influence an increase in the Ktrans BBB permeability values with increasing CDR in the HC, PHC, and hippocampus subfields (i.e., CA1, CA3, DG) (e), and no change in the Ktrans BBB permeability values in other brain regions (f). See Supplementary Table 1 for the list of VRFs. Panels a-f support Figure 1 g-k. (g-j) CSF sPDGFRβ is associated with BBB breakdown measured by neuroimaging in hippocampal gray matter regions (g-h), but not in WM regions (i-j); supports Figures 1 and 3. Panels a-f: Box-and-whisker plot lines indicate median values, boxes indicate interquartile range and whiskers indicate minimum and maximum values. Significance tests after FDR correction from ANCOVAs. Panels g-j: Statistical significance determined by Pearson correlation; r = Pearson correlation coefficient. Brackets denote sample size (n) in each analysis; applies to all regions within each panel.
Extended Data Figure 6. CSF sPDGFRβ increases with CDR impairment, independent of Aβ, tau, and vascular risk factors (VRFs).
(a-b) Site-specific analysis of CSF sPDGFRβ and standard AD biomarkers, Aβ42 and pTau, indicates an early increase in sPDGFRβ with increasing domains impaired in both independent clinical sites, USC (a) and Washington University (b); supports Figure 3 a-c. (c-d) Site-specific analysis of CSF sPDGFRβ indicates increases with the number of cognitive domains impaired, independent of CSF Aβ42 and pTau status in two independent sites, USC (c) and Washington University (d); supports Figure 3 d-f. (e-g) CSF sPDGFRβ is increased with increasing number of cognitive domains impaired, independent of VRFs burden in the combined site analysis (e) and in two independent clinical sites, USC (f) and Washington University (g). VRFs 0–1: no or 1 vascular risk factor. VRFs 2+: 2 or more vascular risk factors. See Supplementary Table 2 for the list of VRFs. Supports Figure 3 a-f. Panels a-g: Box-and-whisker plot lines indicate median values, boxes indicate interquartile range and whiskers indicate minimum and maximum values. Significance tests from ANCOVAs. Brackets denote sample size (n) in each analysis.
Extended Data Figure 7. BBB breakdown is independent of amyloid and tau oligomers.
(a) CSF sPDGFRβ is increased with cognitive domains impaired, independent of amyloid positivity by (11)C-Pittsburgh compound B positron emission tomography (PiB-PET); supports Figure 3 d and f. (b-c) No differences were observed in CSF Aβ oligomer levels (b) and tau oligomer levels (c) in individuals with 0 or 1+ cognitive domains impaired. (d-e) Increases in CSF sPDGFRβ (d) and regional blood-brain barrier (BBB) Ktrans in the hippocampus (HC) and parahippocampal gyrus (PHC) (e) of individuals with 1+ versus 0 cognitive domain impairment remain significant after statistically controlling for the impact of CSF tau oligomers; supports Figure 3 d-f. Panels a-c: Box-and-whisker plot lines indicate median values, boxes indicate interquartile range and whiskers indicate minimum and maximum values. Panel a: significance tests from ANCOVAs. Panels b-c: Significance by two-tailed Student’s t-test at α=0.05. Panels d-e: ANCOVA models representing estimated marginal means ± SEM. Brackets denote sample size (n) in each analysis.
Extended Data Figure 8. Other CSF biomarkers of the neurovascular unit are not altered with cognitive domain impairment.
(a-c) CSF markers of glial, inflammatory, or neuronal injury exhibited no significant differences between unimpaired and impaired individuals on neuropsychological exams, including S100 calcium-binding protein B (S100B), interleukin-6* (IL-6), tumor necrosis factor-α† (TNFα), or neuron-specific enolase† (NSE) in the combined site analysis (a) or in the site-specific analysis of individuals from USC (b) or from Washington University (c). Panels a-c: Box-and-whisker plot lines indicate median values, boxes indicate interquartile range and whiskers indicate minimum and maximum values. Significance tests after FDR correction from ANCOVAs with post-hoc Bonferroni comparisons. Brackets denote sample size (n) in each analysis. *Analysis did not survive significance after FDR correction. †Individual group comparison p values reported because omnibus test was p < 0.05 but post-hoc group comparisons were null. Supports Figure 3 a-c.
Extended Data Figure 9. Regional blood-brain barrier (BBB) breakdown Ktrans increases with cognitive domain impairment, independent of CSF Aβ and tau and vascular risk factors (VRFs).
(a-b) An increase in Ktrans values in the hippocampus (HC), parahippocampal gyrus (PHC), and CA1, CA3 and dentate gyrus (DG) hippocampal subfields with increasing cognitive impairment measured by the number of cognitive domains impaired (a), but not in other brain regions including superior frontal cortical gyrus (Sup Front) and inferior temporal cortical gyrus (Inf Temp), white matter regions including subcortical white matter fibers (white matter), corpus callosum (CC), and internal capsule (IC), and deep gray matter regions including thalamus (Thal), caudate nucleus (Caud) and striatum (b). (c-d) Additional brain regions showed no significance difference in Ktrans BBB permeability in individuals with 0 and 1+ cognitive domains impaired, regardless of CSF Aβ42 (c) and pTau (d) status. (e-f) Ktrans BBB permeability is increased with increasing cognitive domain impairment in the HC, PHC, and hippocampal subfields (i.e., CA1, CA3, DG), independent of VRFs burden (e), but not in other brain regions (f). VRFs 0–1: no or 1 vascular risk factor; VRFs 2+: 2 or more vascular risk factors. See Supplementary Table 2 for the list of VRFs. Panels a-f: Box-and-whisker plot lines indicate median values, boxes indicate interquartile range and whiskers indicate minimum and maximum values. Significance tests after FDR correction from ANCOVAs. Brackets denote sample size (n) in each analysis; applies to all regions within each panel. Supports Figure 3 g-k.
Extended Data Figure 10. CSF sPDGFRβ and medial temporal BBB permeability Ktrans values are not correlated with age, indicating that changes in CSF sPDGFRβ and Ktrans capture processes relating to cognitive impairment independent of normal aging. In CDR 0 individuals, age does not correlate with CSF sPDGFRβ.
(a) or regional Ktrans in the hippocampus (HC) (c) and parahippocampal gyrus (PHC) (e). Similarly, in CDR 0.5 individuals, age does not correlate with CSF sPDGFRβ (a) or regional Ktrans in the hippocampus (HC) (c) and parahippocampal gyrus (PHC) (e). Statistical significance determined by Pearson correlation; r = Pearson correlation coefficient. Brackets denote sample size (n) in each analysis. Supports Figures 1 and 3.
Supplementary Material
Acknowledgement
The work of B.V.Z. is supported by the National Institutes of Health (NIH) grants R01AG023084, R01NS090904, R01NS034467, R01AG039452, 1R01NS100459, 5P01AG052350, and 5P50AG005142 in addition to the Alzheimer’s Association, Cure Alzheimer’s Fund, and the Foundation Leducq Transatlantic Network of Excellence for the Study of Perivascular Spaces in Small Vessel Disease reference no. 16 CVD 05. D.B and M.G.H are supported by the L.K. Whittier Foundation, P01AG052350, RO1AG054434, and R01AG055770. D.N is supported by the NIH grant R21AG055034 and Alzheimer’s Association grant AARG-17–532905. Enrollment of participants into the Washington University Knight ADRC is supported by NIH grants P50AG05681 (J.C.M.), P01AG03991 (J.C.M,), and P01AG026276 (J.C.M.). Enrollment of participants into the USC ADRC is supported by NIH grant 5P50AG005142 (H.C.C.).
Footnotes
COMPETING INTERESTS STATEMENT:
The authors declare no competing financial interests.
DATA AVAILABILITY STATEMENT:
All data included in this study are available in Supplementary Tables containing detailed statistical analyses and in the accompanying Source Data. The data that support the findings of this study are available from the corresponding author upon reasonable request.
References
- 1.Snyder HM et al. Vascular contributions to cognitive impairment and dementia including Alzheimer’s disease. Alzheimers Dement. J. Alzheimers Assoc 11, 710–717 (2015). [DOI] [PMC free article] [PubMed] [Google Scholar]
- 2.Gottesman RF et al. Association Between Midlife Vascular Risk Factors and Estimated Brain Amyloid Deposition. JAMA 317, 1443–1450 (2017). [DOI] [PMC free article] [PubMed] [Google Scholar]
- 3.Iadecola C The Neurovascular Unit Coming of Age: A Journey through Neurovascular Coupling in Health and Disease. Neuron 96, 17–42 (2017). [DOI] [PMC free article] [PubMed] [Google Scholar]
- 4.Sweeney MD, Sagare AP & Zlokovic BV Blood-brain barrier breakdown in Alzheimer disease and other neurodegenerative disorders. Nat. Rev. Neurol 14, 133–150 (2018). [DOI] [PMC free article] [PubMed] [Google Scholar]
- 5.Zlokovic BV Neurovascular pathways to neurodegeneration in Alzheimer’s disease and other disorders. Nat. Rev. Neurosci 12, 723–738 (2011). [DOI] [PMC free article] [PubMed] [Google Scholar]
- 6.Arvanitakis Z, Capuano AW, Leurgans SE, Bennett DA & Schneider JA Relation of cerebral vessel disease to Alzheimer’s disease dementia and cognitive function in elderly people: a cross-sectional study. Lancet Neurol. 15, 934–943 (2016). [DOI] [PMC free article] [PubMed] [Google Scholar]
- 7.Toledo JB et al. Contribution of cerebrovascular disease in autopsy confirmed neurodegenerative disease cases in the National Alzheimer’s Coordinating Centre. Brain J. Neurol 136, 2697–2706 (2013). [DOI] [PMC free article] [PubMed] [Google Scholar]
- 8.Montagne A et al. Blood-brain barrier breakdown in the aging human hippocampus. Neuron 85, 296–302 (2015). [DOI] [PMC free article] [PubMed] [Google Scholar]
- 9.van de Haar HJ et al. Neurovascular unit impairment in early Alzheimer’s disease measured with magnetic resonance imaging. Neurobiol. Aging 45, 190–196 (2016). [DOI] [PubMed] [Google Scholar]
- 10.van de Haar HJ et al. Blood-Brain Barrier Leakage in Patients with Early Alzheimer Disease. Radiology 281, 527–535 (2016). [DOI] [PubMed] [Google Scholar]
- 11.Kisler K, Nelson AR, Montagne A & Zlokovic BV Cerebral blood flow regulation and neurovascular dysfunction in Alzheimer disease. Nat. Rev. Neurosci 18, 419–434 (2017). [DOI] [PMC free article] [PubMed] [Google Scholar]
- 12.Iturria-Medina Y et al. Early role of vascular dysregulation on late-onset Alzheimer’s disease based on multifactorial data-driven analysis. Nat. Commun 7, 11934 (2016). [DOI] [PMC free article] [PubMed] [Google Scholar]
- 13.Wardlaw JM et al. Neuroimaging standards for research into small vessel disease and its contribution to ageing and neurodegeneration. Lancet Neurol. 12, 822–838 (2013). [DOI] [PMC free article] [PubMed] [Google Scholar]
- 14.Montagne A, Zhao Z & Zlokovic BV Alzheimer’s disease: A matter of blood-brain barrier dysfunction? J. Exp. Med 214, 3151–3169 (2017). [DOI] [PMC free article] [PubMed] [Google Scholar]
- 15.Bennett RE et al. Tau induces blood vessel abnormalities and angiogenesis-related gene expression in P301L transgenic mice and human Alzheimer’s disease. Proc. Natl. Acad. Sci. U. S. A 115, E1289–E1298 (2018). [DOI] [PMC free article] [PubMed] [Google Scholar]
- 16.Blair LJ et al. Tau depletion prevents progressive blood-brain barrier damage in a mouse model of tauopathy. Acta Neuropathol. Commun 3, 8 (2015). [DOI] [PMC free article] [PubMed] [Google Scholar]
- 17.Jack CR et al. NIA-AA Research Framework: Toward a biological definition of Alzheimer’s disease. Alzheimers Dement. J. Alzheimers Assoc 14, 535–562 (2018). [DOI] [PMC free article] [PubMed] [Google Scholar]
- 18.Sagare AP, Sweeney MD, Makshanoff J & Zlokovic BV Shedding of soluble platelet-derived growth factor receptor-β from human brain pericytes. Neurosci. Lett 607, 97–101 (2015). [DOI] [PMC free article] [PubMed] [Google Scholar]
- 19.Pan C et al. Diagnostic Values of Cerebrospinal Fluid T-Tau and Aβ₄₂ using Meso Scale Discovery Assays for Alzheimer’s Disease. J. Alzheimers Dis. JAD 45, 709–719 (2015). [DOI] [PMC free article] [PubMed] [Google Scholar]
- 20.Roe CM et al. Amyloid imaging and CSF biomarkers in predicting cognitive impairment up to 7.5 years later. Neurology 80, 1784–1791 (2013). [DOI] [PMC free article] [PubMed] [Google Scholar]
- 21.Bondi MW et al. Neuropsychological criteria for mild cognitive impairment improves diagnostic precision, biomarker associations, and progression rates. J. Alzheimers Dis. JAD 42, 275–289 (2014). [DOI] [PMC free article] [PubMed] [Google Scholar]
- 22.Bell RD et al. Pericytes control key neurovascular functions and neuronal phenotype in the adult brain and during brain aging. Neuron 68, 409–427 (2010). [DOI] [PMC free article] [PubMed] [Google Scholar]
- 23.Lindahl P, Johansson BR, Levéen P & Betsholtz C Pericyte loss and microaneurysm formation in PDGF-B-deficient mice. Science 277, 242–245 (1997). [DOI] [PubMed] [Google Scholar]
- 24.Winkler EA, Bell RD & Zlokovic BV Pericyte-specific expression of PDGF beta receptor in mouse models with normal and deficient PDGF beta receptor signaling. Mol. Neurodegener 5, 32 (2010). [DOI] [PMC free article] [PubMed] [Google Scholar]
- 25.Vanlandewijck M et al. A molecular atlas of cell types and zonation in the brain vasculature. Nature 554, 475–480 (2018). [DOI] [PubMed] [Google Scholar]
- 26.Trost A et al. Brain and Retinal Pericytes: Origin, Function and Role. Front. Cell. Neurosci 10, 20 (2016). [DOI] [PMC free article] [PubMed] [Google Scholar]
- 27.Mendelson K, Swendeman S, Saftig P & Blobel CP Stimulation of platelet-derived growth factor receptor beta (PDGFRbeta) activates ADAM17 and promotes metalloproteinase-dependent cross-talk between the PDGFRbeta and epidermal growth factor receptor (EGFR) signaling pathways. J. Biol. Chem 285, 25024–25032 (2010). [DOI] [PMC free article] [PubMed] [Google Scholar]
- 28.Sweeney MD, Sagare AP & Zlokovic BV Cerebrospinal fluid biomarkers of neurovascular dysfunction in mild dementia and Alzheimer’s disease. J Cereb Blood Flow Metab 35, 1055–1068 (2015). [DOI] [PMC free article] [PubMed] [Google Scholar]
- 29.Wallin A, Blennow K & Rosengren L Cerebrospinal fluid markers of pathogenetic processes in vascular dementia, with special reference to the subcortical subtype. Alzheimer Dis. Assoc. Disord 13 Suppl 3, S102–105 (1999). [PubMed] [Google Scholar]
- 30.Daneman R, Zhou L, Kebede AA & Barres BA Pericytes are required for blood-brain barrier integrity during embryogenesis. Nature 468, 562–566 (2010). [DOI] [PMC free article] [PubMed] [Google Scholar]
- 31.Armulik A et al. Pericytes regulate the blood-brain barrier. Nature 468, 557–561 (2010). [DOI] [PubMed] [Google Scholar]
- 32.Spellman T et al. Hippocampal-prefrontal input supports spatial encoding in working memory. Nature 522, 309–314 (2015). [DOI] [PMC free article] [PubMed] [Google Scholar]
- 33.Tan Z et al. Dynamic ErbB4 Activity in Hippocampal-Prefrontal Synchrony and Top-Down Attention in Rodents. Neuron 98, 380–393.e4 (2018). [DOI] [PMC free article] [PubMed] [Google Scholar]
- 34.Croxson PL et al. Quantitative investigation of connections of the prefrontal cortex in the human and macaque using probabilistic diffusion tractography. J. Neurosci. Off. J. Soc. Neurosci 25, 8854–8866 (2005). [DOI] [PMC free article] [PubMed] [Google Scholar]
- 35.O’Shea A, Cohen RA, Porges EC, Nissim NR & Woods AJ Cognitive Aging and the Hippocampus in Older Adults. Front. Aging Neurosci 8, 298 (2016). [DOI] [PMC free article] [PubMed] [Google Scholar]
- 36.Glikmann-Johnston Y, Oren N, Hendler T & Shapira-Lichter I Distinct functional connectivity of the hippocampus during semantic and phonemic fluency. Neuropsychologia 69, 39–49 (2015). [DOI] [PubMed] [Google Scholar]
- 37.Rodríguez-Aranda C et al. Neuroanatomical correlates of verbal fluency in early Alzheimer’s disease and normal aging. Brain Lang. 155–156, 24–35 (2016). [DOI] [PubMed] [Google Scholar]
- 38.Grahn JA, Parkinson JA & Owen AM The cognitive functions of the caudate nucleus. Prog. Neurobiol 86, 141–155 (2008). [DOI] [PubMed] [Google Scholar]
- 39.Provost J-S, Hanganu A & Monchi O Neuroimaging studies of the striatum in cognition Part I: healthy individuals. Front. Syst. Neurosci 9, 140 (2015). [DOI] [PMC free article] [PubMed] [Google Scholar]
- 40.Drachman DA The amyloid hypothesis, time to move on: Amyloid is the downstream result, not cause, of Alzheimer’s disease. Alzheimers Dement. J. Alzheimers Assoc 10, 372–380 (2014). [DOI] [PubMed] [Google Scholar]
- 41.Jak AJ et al. Quantification of five neuropsychological approaches to defining mild cognitive impairment. Am. J. Geriatr. Psychiatry Off. J. Am. Assoc. Geriatr. Psychiatry 17, 368–375 (2009). [DOI] [PMC free article] [PubMed] [Google Scholar]
- 42.Jak AJ et al. Neuropsychological Criteria for Mild Cognitive Impairment and Dementia Risk in the Framingham Heart Study. J. Int. Neuropsychol. Soc. JINS 22, 937–943 (2016). [DOI] [PMC free article] [PubMed] [Google Scholar]
- 43.Delis D, Kramer J, Kaplan E & Ober B California Verbal Learning Test. (PsychCorp, 2000). [Google Scholar]
- 44.Nation DA et al. Antemortem pulse pressure elevation predicts cerebrovascular disease in autopsy-confirmed Alzheimer’s disease. J. Alzheimers Dis. JAD 30, 595–603 (2012). [DOI] [PMC free article] [PubMed] [Google Scholar]
- 45.Bangen KJ et al. Aggregate effects of vascular risk factors on cerebrovascular changes in autopsy-confirmed Alzheimer’s disease. Alzheimers Dement. J. Alzheimers Assoc 11, 394–403.e1 (2015). [DOI] [PMC free article] [PubMed] [Google Scholar]
- 46.Hölttä M et al. Evaluating amyloid-β oligomers in cerebrospinal fluid as a biomarker for Alzheimer’s disease. PloS One 8, e66381 (2013). [DOI] [PMC free article] [PubMed] [Google Scholar]
- 47.Sengupta U et al. Tau oligomers in cerebrospinal fluid in Alzheimer’s disease. Ann. Clin. Transl. Neurol 4, 226–235 (2017). [DOI] [PMC free article] [PubMed] [Google Scholar]
- 48.Verbeek MM, Otte-Höller I, Wesseling P, Ruiter DJ & de Waal RM Induction of alpha-smooth muscle actin expression in cultured human brain pericytes by transforming growth factor-beta 1. Am. J. Pathol 144, 372–382 (1994). [PMC free article] [PubMed] [Google Scholar]
- 49.Barnes SR et al. ROCKETSHIP: a flexible and modular software tool for the planning, processing and analysis of dynamic MRI studies. BMC Med. Imaging 15, 19 (2015). [DOI] [PMC free article] [PubMed] [Google Scholar]
- 50.Patlak CS & Blasberg RG Graphical evaluation of blood-to-brain transfer constants from multiple-time uptake data. Generalizations. J. Cereb. Blood Flow Metab. Off. J. Int. Soc. Cereb. Blood Flow Metab 5, 584–590 (1985). [DOI] [PubMed] [Google Scholar]
- 51.Fischl B FreeSurfer. NeuroImage 62, 774–781 (2012). [DOI] [PMC free article] [PubMed] [Google Scholar]
- 52.Fischl B et al. Whole brain segmentation: automated labeling of neuroanatomical structures in the human brain. Neuron 33, 341–355 (2002). [DOI] [PubMed] [Google Scholar]
- 53.Desikan RS et al. An automated labeling system for subdividing the human cerebral cortex on MRI scans into gyral based regions of interest. NeuroImage 31, 968–980 (2006). [DOI] [PubMed] [Google Scholar]
- 54.Fischl B & Dale AM Measuring the thickness of the human cerebral cortex from magnetic resonance images. Proc. Natl. Acad. Sci. U. S. A 97, 11050–11055 (2000). [DOI] [PMC free article] [PubMed] [Google Scholar]
- 55.Fischl B, Sereno MI, Tootell RB & Dale AM High-resolution intersubject averaging and a coordinate system for the cortical surface. Hum. Brain Mapp 8, 272–284 (1999). [DOI] [PMC free article] [PubMed] [Google Scholar]
- 56.Dinov I et al. Neuroimaging study designs, computational analyses and data provenance using the LONI pipeline. PloS One 5, (2010). [DOI] [PMC free article] [PubMed] [Google Scholar]
- 57.Sepehrband F et al. Neuroanatomical morphometric characterization of sex differences in youth using statistical learning. NeuroImage 172, 217–227 (2018). [DOI] [PMC free article] [PubMed] [Google Scholar]
- 58.Su Y et al. Quantitative analysis of PiB-PET with FreeSurfer ROIs. PloS One 8, e73377 (2013). [DOI] [PMC free article] [PubMed] [Google Scholar]
- 59.Gordon BA et al. Longitudinal β-Amyloid Deposition and Hippocampal Volume in Preclinical Alzheimer Disease and Suspected Non-Alzheimer Disease Pathophysiology. JAMA Neurol. 73, 1192–1200 (2016). [DOI] [PMC free article] [PubMed] [Google Scholar]
- 60.Glickman ME, Rao SR & Schultz MR False discovery rate control is a recommended alternative to Bonferroni-type adjustments in health studies. J. Clin. Epidemiol 67, 850–857 (2014). [DOI] [PubMed] [Google Scholar]
Associated Data
This section collects any data citations, data availability statements, or supplementary materials included in this article.


