

Abstract
Background:
Intraductal papillary mucinous neoplasms (IPMNs) are radiographically identifiable potential precursor lesions of pancreatic adenocarcinoma. While resection is recommended when main duct dilation is present, management of branch duct IPMN (BD-IPMN) remains controversial. This study sought to evaluate whether preoperative quantitative imaging features of BD-IPMNs could distinguish low-risk disease (low-and intermediate-grade dysplasia) from high-risk disease (high-grade dysplasia and invasive carcinoma).
Methods:
Patients who underwent resection between 2005 and 2015 with pathologically proven BD-IPMN and a preoperative CT scan were included in the study. Quantitative image features were extracted using texture analysis and a novel quantitative mural nodularity feature developed for the study. Significant features on univariate analysis were combined with clinical variables to build a multivariate prediction model.
Results:
Within the study group of 103 patients, 76 (74%) had low-risk disease and 27 (26%) had high-risk disease. Quantitative imaging features were prognostic of low-vs. high-risk disease. The model based only on clinical variables achieved an AUC of 0.67 and 0.79 with the addition of quantitative imaging features.
Discussion:
Quantitative image analysis of BD-IPMNs is a novel method that may enable risk stratification. External validation may provide a reliable non-invasive prognostic tool for clinicians.
INTRODUCTION
Intraductal papillary mucinous neoplasms (IPMNs) of the pancreas are cysts that have the potential to transform into invasive carcinoma. Along with mucinous cystic neoplasms, they are one of the few radiographically identifiable precursors to pancreatic cancer. With the increasing use of crosssectional imaging, the incidence of IPMNs is rising with cysts identified on 2.6% of all CT scans.1–3 These cystic neoplasms are known to progress from low- to high-grade dysplasia followed by invasive carcinoma. At diagnosis, the decision to resect relies upon the ability to distinguish IPMNs that are at low-risk (low- to intermediate-grade dysplasia) from those that are at high-risk (high-grade dysplasia) of developing invasive cancer. The management of IPMNs is challenging because existing laboratory, cytologic, and imaging tools have proven unreliable at consistently identifying high-risk patients, and their rate of malignant progression remains poorly understood.4,5
Today, the most accurate factor in identifying high-risk disease in IPMN is main pancreatic duct dilation, otherwise known as a main duct type IPMN (MD-IPMN). The 2017 International Consensus Guidelines (ICG2017) recommends resection for all MD-IPMN patients fit for surgery.4 The management of branch duct type IPMN (BD-IPMN) is more controversial, and the application of current guidelines results in a frequency of high-risk disease in 10%−15% of patients who undergo resection.5 More accurate markers of high-risk disease are needed to assist treatment decision-making. Improved preoperative assessment of dysplasia would allow low-risk patients to be spared a potentially morbid operation and allow high-risk patients to undergo resection prior to transformation into an invasive phenotype.6,7 Hence, the current study focused on BD-IPMN due to the limitations of current guidelines to detect high risk BD-IPMN.
Studies investigating the use of cytological, genomic, and transcriptional factors have yielded promising results, but are of limited utility.8–10 The current study sought to build upon what has already been established as an important marker by the ICG2017, namely, the appearance of the cyst on imaging. From the size of the cyst or duct to the presence of a mural nodule, surgeons rely heavily on radiographic evaluation to guide management. However, while there can be excellent agreement among observers concerning cyst/duct size, greater variability occurs during the assessment for the presence or absence of solid components and/or mural nodules.11 This latter finding is troubling as these are key criteria that the ICG2017 use to recommend resection.
The ability to computationally predict the underlying biology of a tumor seen on imaging has been previously described in other cancer types.12–15 Image analysis algorithms have the advantage of operating at a resolution of a single pixel and can therefore detect key potential differences in phenotype. The resultant image data, or “texture features,” represent the spatial variations in pixel intensities in a tumor. In pancreatic adenocarcinoma (PDAC), for example, they have been associated with overall survival in resected patients.16–18 Given that texture analysis is prognostic in PDAC, perhaps it can also prove useful in answering critical clinical questions in IPMN, a type of PDAC precursor lesion.
Based on the observation that larger cyst size, larger duct or abrupt changes in pancreatic duct caliber, and solid enhancing components are considered features predictive of underlying malignancy, we endeavored to develop objective quantitative imaging methods for the management of BD-IPMN. Our hypothesis is that quantitative imaging markers derived from CT images capture the dynamic range of complex cystic lesions, enabling distinction between BD-IPMN with and without cancer.
METHODS
Patient selection
Following approval by the Institutional Review Board at Memorial Sloan Kettering Cancer Center, a prospectively maintained database was queried for patients who underwent resection for IPMN between 2005 and 2015. All patients included in the study had a pre-operative CT scan. We included initial resections only and excluded cases where a concurrent neoplasm other than pancreatic adenocarcinoma was identified (e.g., distal common bile duct tumor, neuroendocrine tumor) to minimize any confounding effects. Furthermore, only IPMNs reported to be branch duct type on pathological assessment were included; if this information was not available on the pathology report, the pre-operative CT report was used to select only branch duct type IPMN. However, some of the cases did not include a radiology report due to the scan being done at an outside facility. In these cases, we relied on the initial assessment note by the attending radiologist to determine key features of the lesion (e.g., size, presence of mural nodule, location, etc…). If the IPMN was initially deemed to be main duct type on CT but found to be branch duct type on pathological review, then a radiologist specializing in hepatopancreatobiliary disease reevaluated the CT for final diagnosis. The radiologist was not involved in subsequent quantitative image analysis to reduce the possibility of potential bias. Finally, patients were excluded if the cyst was not well visualized or if the CT lacked a portal venous phase.
Image acquisition
Standard contrast enhanced pre-treatment CT images were utilized in the study. Following the administration of 150 mL iodinated contrast (Omnipaque 300, GE Healthcare, New Jersey), post-contrast CT images were acquired at 4.0 mL/sec using a multidetector CT (Lightspeed 16 and VCT, GE Healthcare, Wisconsin). Pitch and table speed were 0.984–1.375 and 39.37–27.50 mm, respectively, with the remaining variables set to: autoMA 220–380; noise index 12.5–14.0; rotation time 0.7–0.8 ms; scan delay 80–85 s. Axial slices from the portal venous phase reconstructed at 2.5 mm intervals were used for analysis.
Image analysis
The cyst was manually segmented on every axial slice in which it appeared using Scout Liver (Pathfinder Technologies Inc., Analogic Corporation, Peabody, MA) (Figure 1). If multiple cysts were present, the largest cyst was selected for segmentation. Previously described custom in-house software was then used to extract a standard set of 255 image features from the cyst region that represents the overall “texture” of the cyst.18 This features set included second order statistical texture features, extracted using gray-level co-occurrence matrices, run length matrices, local binary patterns, fractal dimension, and two angle co-occurrence matrices (ACMs). Five first order intensity histogram-based statistical features - mean, standard deviation, skewness, kurtosis, and entropy were also incorporated to quantify the intensity distribution within tumor region. All features except ACMs characterize the spatial relationship among neighboring pixels intensity values, whereas ACMs describe the directional edge patterns of the tumor via quantifying angular distribution of oriented patterns in a neighborhood. In addition, a single quantitative imaging feature was developed, inspired by the appearance of the mural nodule. This feature measures the ratio of the area of the largest connected enhanced region and the area of the cyst region (expressed as a continuous value). The feature was included in the prediction model as a continuous variable with no cut-off applied. Figure 2 demonstrates that for a high-risk patient, enhanced pixels (brightly attenuating) are located closely together (i.e. compact), due to the presence of mural nodule. Whereas for low-risk patient, the enhanced pixels are scattered over the entire cyst region since no mural nodule is present. The imaging feature set included the 255 texture features and the mural nodularity feature for a total of 256 features.
Figure 1-.
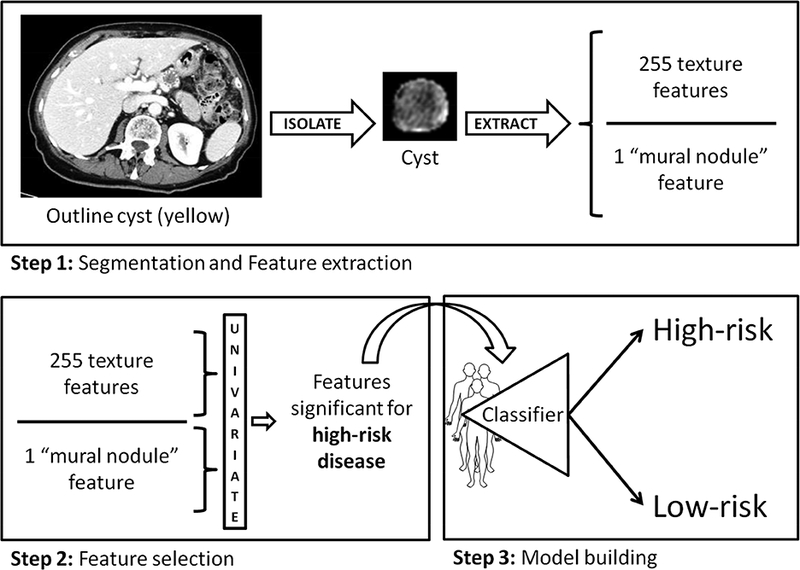
Overview of methods. (Step 1) The cyst and pancreas are manually outlined on every axial slice. Texture features are extracted along with the quantitative mural nodularity feature. (Step 2) Significant clinical and quantitative imaging features on univariate analysis were included in (Step 3) a multivariate model constructed to distinguish low- from high-risk disease.
Figure 2-.
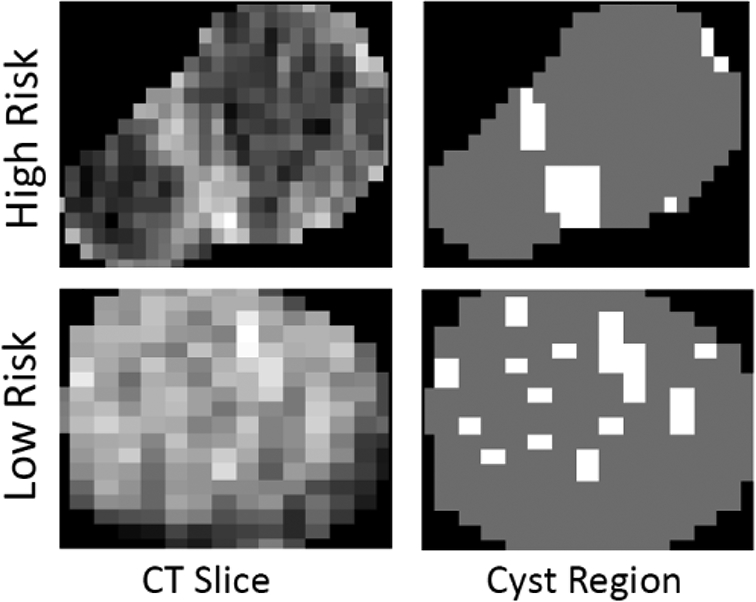
Left Representative CT images of low- and high-risk IPMNs. Right The quantitative mural nodularity feature highlighting peripheral areas of focal intensity.
Prediction model building
The outcome of interest was low- (low- and intermediate-grade dysplasia) and high-risk disease (high-grade dysplasia or invasive carcinoma) as determined by a pathologist following resection. Three prediction models for determining risk were designed: (1) clinical variables only, (2) quantitative imaging features only, and (3) a combination of clinical variables and quantitative imaging features. In model 1, clinical variables (age, cyst size, presence of solid component/mural nodule reported in the radiology report, symptoms, gender) known to correlate with the presence of high-risk disease were included.19 In model 2, only the quantitative imaging features were used. Model 3 combined all clinical variables and quantitative imaging features. For models 2 and 3, RELIEF-based univariate analysis was performed to select significant quantitative imaging features for inclusion in the multivariate model.20 The multivariate model was generated using a random forest classifier to mitigate the potential effects of overfitting.21 Tenfold cross-validation was employed due to the relatively low number of high-risk patients. Briefly, the entire cohort was split into ten groups, and during the first of ten passes, nine groups were assigned for training (quantitative imaging feature selection and classification) with the remaining group used for testing.
Overall model performance was described using the area under the receiver operating characteristic curve (AUC). Model performance for low- and high-risk was measured using sensitivity, specificity, positive predictive value (PPV), and negative predictive value (NPV). Various criteria were used to determine optimal thresholds for sensitivity, specificity, NPV, and PPV.
RESULTS
There were 347 resections performed for IPMN between 2005 and 2015. Following exclusion of recurrences (n=15) and cysts with concurrent non-adenocarcinoma histology (n=10), the study cohort decreased to 322. Of these, 140 had a pathological diagnosis of either main duct or mixed type and were excluded. In the remaining patients, 116 had a preoperative CT scan. There were 17 instances where the pre-op CT scan was read as main duct/mixed type (i.e., dilated main duct) but the final pathological diagnosis was BD-IPMN. Following radiological review, the preoperative diagnosis in ten of these 17 cases was changed to BD-IPMN given the lack of a dilated main duct; the remaining seven were confirmed to be MD-IPMN and were therefore excluded. Finally, six cases were excluded due to the lack of a portal venous phase or if the cyst was not well visualized resulting in a final cohort of 103 patients. Within this study cohort, there were 76 (74%) low-risk and 27 (26%) high-risk patients. The median age was 68 years [interquartile range (IQR) 60–74 yrs]. Gender was split evenly [male: 47 (46%); female: 56 (54%)]. The median number of weeks between the preoperative CT and operation was 4.1 weeks (IQR 2.6–10.3). A mural nodule was reported preoperatively in 14 patients (14%) and a solid component was reported in six patients (6%). In all, 11 (14%) low-risk patients had reports of a mural nodule, solid component, or both, while eight (30%) high-risk patients had such findings (p=0.09). Detailed patient characteristics are available in Table 1.
Table 1-.
Patient cohort characteristics (n=103).
| Low risk (n=76) | High risk (n=27) | P-value | |
|---|---|---|---|
| Age | 69 (60–74) | 65 (60–73) | 0.504 |
| Gender | |||
| Male | 30 (39%) | 17 (63%) | 0.044 |
| Female | 46 (61%) | 10 (37%) | |
| Time from scan to operation (weeks) | 4.8 (2.6–10.3) | 3.7 (2.4–8.7) | 0.600 |
| Imaging modality | |||
| CT abdomen with IV contrast | 30 (39%) | 9 (33%) | 0.648 |
| CT angiography of the pancreas | 46 (61%) | 18 (67%) | |
| Largest cyst size (cm) | 2.8 (2.2–3.6) | 3.2 (2.4–3.8) | 0.272 |
| Radiographic features | |||
| None | 65 (86%) | 19 (70%) | 0.091 |
| Either mural nodule, solid component, or both | 11 (14%) | 8 (30%) | |
| Grade of dysplasia | |||
| Low grade | 27 (36%) | - | |
| Intermediate grade | 49 (64%) | - | - |
| High grade | - | 27 (100%) | |
Median (Interquartile range) or n (%)
The model constructed only from clinical variables resulted in an AUC of 0.67. The model constructed using only quantitative image features resulted in an AUC of 0.76. When clinical and quantitative imaging features were combined into a single model, the AUC increased to 0.79 (Table 2a). The quantitative mural nodularity feature consistently displayed significance in all quantitative imaging models.
Table 2a-.
Prediction model performance.
| AUC | |
|---|---|
| Clinical | 0.67 |
| Imaging | 0.76 |
| Clinical + Imaging | 0.79 |
AUC = Area under the ROC curve
The receiver operating characteristic (ROC) curves for all three models are shown in Figure 3. Two representative CT images for patients with high- and low-risk IPMN, misclassified with the clinical model, but accurately categorized using the combined clinical and imaging model, are shown in Figure 3. Using the combined model, maximizing sensitivity and specificity to determine the optimal threshold for resection resulted in values of 71% and 82%, respectively, while maximizing PPV and NPV resulted in values of 95% and 79%, respectively. Other optimization strategies are listed in Table 2b.
Figure 3-.
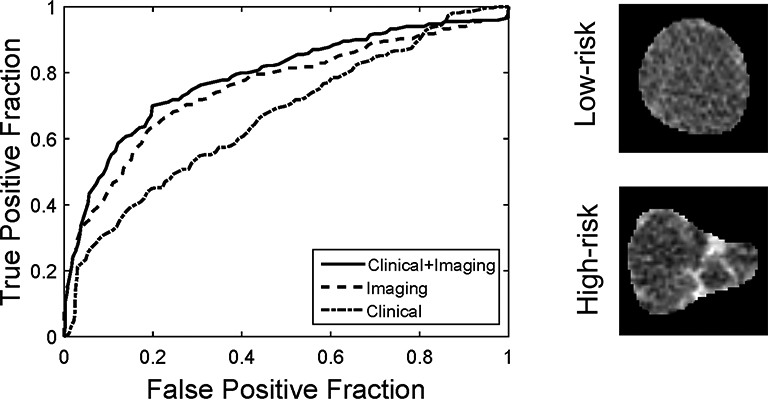
Left Receiver operating characteristic (ROC) curves for the three models predicting low- vs. high-risk disease. Areas under the curve (AUC) were 0.67 for clinical variables, 0.76 for imaging features, and 0.79 for the combination of clinical variables and imaging features. Right Low and high-risk cysts wrongly classified with clinical model, however, correctly classified with the combined model.
Table 2b-.
Prediction model performance evaluated using different optimization strategies.
| Optimization | Accuracy | Sensitivity | Specificity | PPV | NPV |
|---|---|---|---|---|---|
| Max(sen + spec)a | 79% | 71% | 82% | 60% | 89% |
| Max(PPV + NPV)b | 79% | 24% | 99% | 95% | 79% |
| Equal probabilityc | 80% | 48% | 92% | 68% | 83% |
| Max(PPV)d | 78% | 19% | 100% | 97% | 78% |
| Max(NPV)e | 50% | 93% | 35% | 36% | 95% |
Maximizing sensitivity and specificity (equally weighted), Youden’s J statistic
Maximizing PPV and NPV (equally weighted)
Equal probability of low/high risk (50% threshold)
Maximizing PPV
Maximizing NPV
Sen = Sensitivity; Spec = Specificity; PPV = Positive predictive value; NPV = Negative predictive value
DISCUSSION
The management of pancreatic cysts has significantly evolved within the last two decades as our understanding of their natural history has improved. Fewer incidentally discovered cysts are being initially directed towards resection, and a more selective approach to resection has been accepted. However, even with current consensus guidelines, the majority of resected BD-IPMNs are found to have low-risk disease. An improvement in our ability to preoperatively determine the grade of the lesion is needed. In the current study, two models were created, one based on clinical features alone and the other on quantitative imaging features alone. The AUCs for these clinical and quantitative imaging models were 0.67 and 0.76, respectively. These results suggest that quantitative image analysis of the cyst predicts disease risk better than commonly accepted clinical and qualitative radiographic assessments. Combining clinical and quantitative imaging variables further improved the model AUC to 0.79 highlighting the need to consider well-known clinical factors in addition to advanced imaging techniques. Among the quantitative imaging features investigated in this study, we proposed a novel quantitative mural nodule feature, which demonstrated significance in predicting disease risk. Radiographic findings approached significance in this cohort (p=0.091), suggesting that the computer-based features may perform better than prospective visual assessment by radiologists. While we did not perform a head-to-head comparison between qualitative and quantitative features, our models’ AUC shows the potential value in comparing quantitative imaging features against standard diagnostic radiologist assessment in a prospective cohort.
Some limited data has been previously published on the quantitative assessment of IPMN. In a recent study, Hoffman et al. demonstrated that measuring entropy of the image histogram in the cyst region on diffusion weighted MRI could be prognostic of malignancy.22 Similarly, Permuth et al. combined quantitative imaging features with miRNA data as a proof-of-concept to accurately predict IPMN pathology.23 Finally, Hanania et al. described similar methods to our proposed methods to evaluate malignant potential in IPMNs.24 However, by including both main and branch duct in their cohort, the significant differences detected by their model may be explained by the previously established high-risk profile of main duct disease.4 The authors also discussed the risk of over-fitting in their cohort, emphasizing the need for external validation. While these were relatively small studies, when combined with our data, these data demonstrate the potential of quantitative image analysis as a non-invasive tool for predicting disease risk. The extraction of additional information from medical images using advanced computer-based feature analysis is one approach to reduce the variability in the visual evaluation of cystic lesions. Quantitative image analysis offers noninvasive measurement of disease at multiple time points and at multiple tumor sites on routinely acquired diagnostic images, an attractive approach for clinicians looking for low cost methods to better inform patient management.
The proposed models provide the predicted probability of an event (low or high risk). Table 2b is useful to dichotomize the probability to facilitate clinical decision-making for the combined clinical and imaging models. Dichotomizing a predicted probability requires a criterion (i.e., an objective function) to balance the false positives and false negatives. Equally weighting sensitivity and specificity results in the first row of Table 2b, while equally weighting PPV and NPV results in the second row. Placing equal probability on both yields row 3. Favoring one over the other results in rows 4 and 5. PPV and NPV are dependent on the probability of high-risk disease (prevalence). As such, the results presented in rows 2, 4, and 5 will not apply if the predictive model is used in a cohort with very different prevalence. In our data set, prevalence was 26%. Different clinical reasons and scenarios motivate the choice of one dichotomization over another, but the last two lines represent the extremes where one metric is maximized while the other, consequently, is quite poor. For this reason, it is unlikely that these would be the desired thresholds. Note that the accuracy is similar in the first four rows highlighting the need for the discussion of the false positives and false negatives. Combined with clinical suspicion and other known genetic and cytological markers of high-risk disease, this model is another tool in a growing armamentarium that may help predict and prevent the development of pancreatic cancer in IPMN patients.
Our study contains several weaknesses due to the retrospective design. First, by relying on a pathological diagnosis as ground truth in our multivariate model construction, we limited our cohort to resected patients alone, resulting in a smaller sample size. Alternatively, conducting this study prospectively and including non-resected patients would be challenging due to the absence of a definitive pathological diagnosis. We also used the preoperative clinical radiology report to account for the presence of mural nodule or solid component. While a repeat assessment of the same CT images by multiple radiologists is possible, we have previously shown the limited interobserver agreement for the assessment of these radiographic features. Aside from clinicoradiological variables, the present model does not incorporate other factors that have been shown to be prognostic of high-risk disease such as cyst fluid inflammatory or genomic markers.25,26 Future work is needed to correlate cyst fluid inflammatory and/or genomic markers with quantitative imaging features to draw more definitive preoperative conclusions about IPMN pathology. Finally, since quantitative image analysis requires a visible cyst on CT, this technique would not be applicable in cases where the cyst is poorly visualized.
In conclusion, we present a multivariate model of quantitative imaging features and clinical variables that predicts low and high risk in resected BD-IPMN. This method reinforces the predictive value of CT imaging and suggests that we can enhance our ability to extract clinically relevant information from routinely acquired imaging. Applying the model to external data would give a better assessment of the model accuracy and generalizability. Prospective clinical trials are needed to validate this model so that the system can be made available to clinicians worldwide. Our institution is currently planning a clinical trial in patients undergoing surveillance for unresected IPMN. Further studies are planned to apply quantitative imaging in main duct IPMN.
Acknowledgments
This research was funded in part through the NIH/NCI Cancer Center Support Grant P30 CA008748, David M. Rubenstein Center for Pancreatic Research, American Association of Cancer Research, and the Pancreatic Cancer Action Network.
Footnotes
Disclosures: None
Publisher's Disclaimer: This is a PDF file of an unedited manuscript that has been accepted for publication. As a service to our customers we are providing this early version of the manuscript. The manuscript will undergo copyediting, typesetting, and review of the resulting proof before it is published in its final citable form. Please note that during the production process errors may be discovered which could affect the content, and all legal disclaimers that apply to the journal pertain.
REFERENCES
- 1.Fernandez-del Castillo C, Warshaw AL. Current management of cystic neoplasms of the pancreas. Adv Surg. 2000;34:237–248. PubMed PMID: . [PubMed] [Google Scholar]
- 2.Gaujoux S, Brennan MF, Gonen M, D’Angelica MI, DeMatteo R, Fong Y, et al. Cystic Lesions of the Pancreas: Changes in the Presentation and Management of 1,424 Patients at a Single Institution over a 15-Year Time Period. J Am Coll Surgeons. 2011;212(4):590–600. doi: 10.1016/j.jamcollsurg.2011.01.016. [DOI] [PMC free article] [PubMed] [Google Scholar]
- 3.Laffan TA, Horton KM, Klein AP, Berlanstein B, Siegelman SS, Kawamoto S, et al. Prevalence of Unsuspected Pancreatic Cysts on MDCT. Am J Roentgenol. 2008;191(3):802–807. doi: 10.2214/ajr.07.3340. [DOI] [PMC free article] [PubMed] [Google Scholar]
- 4.Tanaka M, Fernandez-del Castillo C, Kamisawa T, Jang JY, Levy P, Ohtsuka T, et al. Revisions of international consensus Fukuoka guidelines for the management of IPMN of the pancreas. Pancreatology. 2017;17(5):738–753. doi: 10.1016/j.pan.2017.07.007. [DOI] [PubMed] [Google Scholar]
- 5.Allen PJ. The Management of Intraductal Papillary Mucinous Neoplasms of the Pancreas. Surgical Oncology Clinics of North America. 2010;19(2):297–310. doi: 10.1016/j.soc.2009.11.002. [DOI] [PubMed] [Google Scholar]
- 6.Yeo CJ, Cameron JL, Sohn TA, Lillemoe KD, Pitt HA, Talamini MA, et al. Six Hundred Fifty Consecutive Pancreaticoduodenectomies in the 1990s. Ann Surg. 1997;226(3):248–260. doi: 10.1097/00000658-199709000-00004. [DOI] [PMC free article] [PubMed] [Google Scholar]
- 7.Birkmeyer JD, Siewers AE, Finlayson EVA, Stukel TA, Lucas FL, Batista I, et al. Hospital Volume and Surgical Mortality in the United States. New Engl J Med. 2002;346(15):1128–1137. doi: 10.1056/nejmsa012337. [DOI] [PubMed] [Google Scholar]
- 8.Tan MC, Basturk O, Brannon AR, Bhanot U, Scott SN, Bouvier N, et al. GNAS and KRAS Mutations Define Separate Progression Pathways in Intraductal Papillary Mucinous Neoplasm-Associated Carcinoma. J Am Coll Surgeons. 2015;220(5):845–854.e841. doi: 10.1016/j.jamcoNsurg.2014.n.029. [DOI] [PMC free article] [PubMed] [Google Scholar]
- 9.Nissim S, Idos GE, Wu B. Genetic Markers of Malignant Transformation in Intraductal Papillary Mucinous Neoplasm of the Pancreas. Pancreas. 2012;41(8):1195–1205. doi: 10.1097/mpa.0b013e3182580fb4. [DOI] [PMC free article] [PubMed] [Google Scholar]
- 10.Hosoda W, Sasaki E, Murakami Y, Yamao K, Shimizu Y, Yatabe Y. GNAS mutation is a frequent event in pancreatic intraductal papillary mucinous neoplasms and associated adenocarcinomas. Virchows Archiv. 2015;466(6):665–674. doi: 10.1007/s00428-015-1751-6. [DOI] [PubMed] [Google Scholar]
- 11.Do RKG, Katz SS, Gollub MJ, Li J, LaFemina J, Zabor EC, et al. Interobserver Agreement for Detection of Malignant Features of Intraductal Papillary Mucinous Neoplasms of the Pancreas on MDCT. Am J Roentgenol. 2014;203(5):973–979. doi: 10.2214/ajr.13.11490. [DOI] [PMC free article] [PubMed] [Google Scholar]
- 12.Zhang H, Graham CM, Elci O, Griswold ME, Zhang X, Khan MA, et al. Locally Advanced Squamous Cell Carcinoma of the Head and Neck: CT Texture and Histogram Analysis Allow Independent Prediction of Overall Survival in Patients Treated with Induction Chemotherapy. Radiology. 2013;269(3):801–809. doi: 10.1148/radiol.13130110. [DOI] [PubMed] [Google Scholar]
- 13.Win T, Miles KA, Janes SM, Ganeshan B, Shastry M, Endozo R, et al. Tumor Heterogeneity and Permeability as Measured on the CT Component of PET/CT Predict Survival in Patients with Non-Small Cell Lung Cancer. Clin Cancer Res. 2013;19(13):3591–3599. doi: 10.1158/1078-0432.ccr-12-1307. [DOI] [PubMed] [Google Scholar]
- 14.Aerts HJ, Velazquez ER, Leijenaar RT, Parmar C, Grossmann P, Carvalho S, et al. Decoding tumour phenotype by noninvasive imaging using a quantitative radiomics approach. Nat Commun. 2014;5:4006. doi: 10.1038/ncomms5006. PubMed PMID: ; PubMed Central PMCID: PMCPMC4059926. [DOI] [PMC free article] [PubMed] [Google Scholar]
- 15.Simpson AL, Adams LB, Allen PJ, D’Angelica MI, DeMatteo RP, Fong Y, et al. Texture Analysis of Preoperative CT Images for Prediction of Postoperative Hepatic Insufficiency: A Preliminary Study. J Am Coll Surgeons. 2015;220(3):339–346. [DOI] [PMC free article] [PubMed] [Google Scholar]
- 16.Eilaghi A, Baig S, Zhang Y, Zhang J, Karanicolas P, Gallinger S, et al. CT texture features are associated with overall survival in pancreatic ductal adenocarcinoma - a quantitative analysis. BMC Med Imaging. 2017;17(1). doi: 10.1186/s12880-017-0209-5. [DOI] [PMC free article] [PubMed] [Google Scholar]
- 17.Attiyeh MA, Chakraborty J, Doussot A, Langdon-Embry L, Mainarich S, Gonen M, et al. Survival Prediction in Pancreatic Ductal Adenocarcinoma by Quantitative Computed Tomography Image Analysis. Ann Surg Oncol. 2018;25(4):1034–1042. doi: 10.1245/s10434-017-6323-3. [DOI] [PMC free article] [PubMed] [Google Scholar]
- 18.Chakraborty J, Langdon-Embry L, Cunanan KM, Escalon JG, Allen PJ, Lowery MA, et al. Preliminary study of tumor heterogeneity in imaging predicts two year survival in pancreatic cancer patients. PLOS ONE. 2017;12(12):e0188022. doi: 10.1371/journal.pone.0188022. [DOI] [PMC free article] [PubMed] [Google Scholar]
- 19.Attiyeh MA, Fernandez-del Castillo C, Al Efishat M, Eaton AA, Gonen M, Batts R, et al. Development and Validation of a Multi-institutional Preoperative Nomogram for Predicting Grade of Dysplasia in Intraductal Papillary Mucinous Neoplasms (IPMNs) of the Pancreas. Ann Surg. 2018;267(1):157–163. doi: 10.1097/sla.0000000000002015. [DOI] [PMC free article] [PubMed] [Google Scholar]
- 20.Kira K, Rendell LA. A Practical Approach to Feature Selection Machine Learning Proceedings 1992: Elsevier; 1992:249–256. [Google Scholar]
- 21.Hastie T, Tibshirani R, Friedman J. The Elements of Statistical Learning: Data Mining, Inference, and Prediction. 2nd ed: Springer; 2009. [Google Scholar]
- 22.Hoffman DH, Ream JM, Hajdu CH, Rosenkrantz AB. Utility of whole-lesion ADC histogram metrics for assessing the malignant potential of pancreatic intraductal papillary mucinous neoplasms (IPMNs). Abdom Radiol. 2016;42(4):1222–1228. doi: 10.1007/s00261-016-1001-7. [DOI] [PubMed] [Google Scholar]
- 23.Permuth JB, Choi J, Balarunathan Y, Kim J, Chen D-T, Chen L, et al. Combining radiomic features with a miRNA classifier may improve prediction of malignant pathology for pancreatic intraductal papillary mucinous neoplasms. Oncotarget. 2016;7(52). doi: 10.18632/oncotarget.11768. [DOI] [PMC free article] [PubMed] [Google Scholar]
- 24.Hanania AN, Bantis LE, Feng Z, Wang H, Tamm EP, Katz MH, et al. Quantitative imaging to evaluate malignant potential of IPMNs. Oncotarget. 2016;7(52). doi: 10.18632/oncotarget.11769. [DOI] [PMC free article] [PubMed] [Google Scholar]
- 25.Maker AV, Katabi N, Qin LX, Klimstra DS, Schattner M, Brennan MF, et al. Cyst Fluid Interleukin-1 (IL1) Levels Predict the Risk of Carcinoma in Intraductal Papillary Mucinous Neoplasms of the Pancreas. Clin Cancer Res. 2011;17(6):1502–1508. doi: 10.1158/1078-0432.ccr-10-1561. [DOI] [PMC free article] [PubMed] [Google Scholar]
- 26.Al Efishat MA, Attiyeh MF, Eaton AA, Gonen M, Prosser D, Lokshin AE, et al. Multi-Institutional Validation Study of Pancreatic Cyst Fluid Protein Analysis for Prediction of High-Risk Intraductal Papillary Mucinous Neoplasms of the Pancreas. Ann Surg. 2017:1. doi: 10.1097/sla.0000000000002421. [DOI] [PMC free article] [PubMed] [Google Scholar]