

Abstract
Mating behaviours are diverse and noteworthy, especially within species radiations where they may contribute to speciation. Studying how differences in mating behaviours arise between species can help us understand how diversity is generated at multiple biological levels. The bioluminescent courtship displays of cypridinid ostracods (or sea fireflies) are an excellent system for this because amazing variety evolves while using a conserved biochemical mechanism. We find that the evolution of one aspect in this behavioural phenotype—the duration of bioluminescent courtship pulses—is shaped by biochemical function. First, by measuring light production from induced bioluminescence in 38 species, we discovered differences between species in their biochemical reactions. Then, for 16 species for which biochemical, phylogenetic and behavioural data are all available, we used phylogenetic comparative models to show that differences in biochemical reaction are nonlinearly correlated with the duration of courtship pulses. This relationship indicates that changes to both enzyme (c-luciferase) function and usage have shaped the evolution of courtship displays, but that they differentially contribute to these phenotypic changes. This nonlinear dynamic may have consequences for the disparity of signalling phenotypes observed across species, and demonstrates how unappreciated diversity at the biochemical level can lead to inferences about behavioural evolution.
Keywords: bioluminescence, c-luciferase, enzyme function, courtship signals, ostracod, sea fireflies
1. Background
Disparate courtship behaviours are often a hallmark of species radiations [1–3], such that learning how differences evolve is critical to understanding the origins of biodiversity. Like other phenotypes, courtship displays are sensitive to natural selection, stochasticity, and historical and developmental constraints, with the interaction of these factors determining overall phenotype [4–6]. When predicting how such phenotypes evolve, it can be useful to build a theoretical space relating structure to function to better understand both realized and potential diversity; such ‘phenospaces’ give us insight into the evolutionary process. This has been particularly well used in functional morphology to describe how the evolution of biomechanical performance (a metric analogous to behavioural output) may be enabled [7] or constrained [8] due to differences in morphological traits. For example, in the courtship behaviours of woodpeckers, this approach has shown that morphological constraints in one aspect of the phenotype can be ameliorated by sexual selection acting to elaborate overall signal design in other ways [9]. However, behaviours are a non-additive output from many biological levels, not just morphology, and we might expect that variation in any one level can contribute to phenotypic evolution. Thus, given sufficient understanding of the relationship between structure and function, we can extend this approach to any level of biological organization and begin to understand if and how variation in biological organization leads to variation in courtship phenotypes.
Unlike morphology, studies on biochemistry are either more difficult to link directly or less commonly connected with phenotypic evolution. Even though biochemistry may be studied by measuring biochemical functions, the best assessments for how it affects phenotypic evolution generally come from studies of particular proteins, like how haemoglobin changes relate to shifts in altitudinal home range [10]. But in mating phenotypes specifically, linking biochemical variation to behaviour is less well demonstrated. Most famously, in many insects, changes in the metabolic pathways creating cuticular hydrocarbon profiles have led to differences in recognition-semiochemicals, both in kind and in composition (briefly reviewed in [11]). Even outside insects, most work on biochemical variation connecting to animal communication has focused on pheromones (for some examples, see Animal Behaviour 97's special section on biochemistry and animal communication). Other studies, as in bioluminescent taxa such as fireflies, have shown that changes in coloration between species are due to changes in the biochemical binding of the substrate [12]. And in weakly electric fishes, differences between species in their communication signals have been linked to differences in the voltage-gated potassium channels that contribute to the neuronal action potentials and subsequent discharge rate in their electric organs [13]. These studies provide important initial insights on how biochemical variation can influence the production of mating signal phenotypes, albeit with a skewed focus on pheromone research. Here, using a phenospace and comparative dataset, we show how variation in biochemical kinetics can lead us to evolutionary inferences about behavioural diversity broadly.
Generally, phenotypes may change via two mechanisms: first, evolution may alter the identity of components contributing to the phenotype (‘what it is’—e.g. gene or enzyme sequence and function); and second, evolution may alter the implementation of those components (‘how they are used’—e.g. expression levels, concentration, ratios or interactions). Bioluminescent cypridinid ostracods (commonly umihotaru or ‘sea fireflies’) comprise a species radiation of marine crustaceans that share an enzymatically well-studied light reaction, allowing us to ask how enzyme identity and implementation interact during the diversification of luminous courtship signals. Both sexes produce anti-predator light pulses that cause predators like fish to spit out their potential ostracod prey, and which can be experimentally induced [14], but only male cypridinids secrete species-specific patterns of bioluminescent pulses to attract females [15,16]. These courtship trains vary little within species but widely between them, as in the number of pulses and direction of propagation, duration of each pulse and timing between pulses [17,18]. Upon detecting a single display comprised many individual pulses, females will alter their swimming trajectories to intercept a male's predicted position in the water column [16]. Other receivers such as competing males have highly plastic responses and (depending on how close they are to a display) will (1) sneak onto the display of another male, (2) begin to produce their own display in loose synchrony with a competitor (called entrainment), or (3) choose to make their own independent display [19].
In these single display trains, each pulse is composed of mucus secreted outside the body, containing the luciferase enzyme (hereafter ‘c-luciferases’) plus a conserved substrate (vargulin or cypridinid luciferin [20]), which react with oxygen to form light (figure 1a). The reaction is ATP-independent [21] and well described with first-order kinetics, meaning that reaction rates depend only on substrate concentration, as oxygen is freely available in seawater [22,23]. After secretion, light production over time has phases: upon addition of the substrate, light production should rise rapidly (‘rise phase’; figure 1a, red zone) to a maximum that correlates with the amount of active c-luciferase excreted; as the reaction stabilizes, c-luciferase oxidizes excess vargulin creating a plateau in the amount of observed light over time (‘plateau phase’; figure 1a, yellow zone); finally, the substrate becomes limiting and the reaction decays exponentially (‘decay phase’; figure 1a, blue zone). As this rate of decay in light is determined by c-luciferase becoming substrate limited, and not the total c-luciferase amount or relative c-luciferase : vargulin ratio (implementation), decay should reflect the inherent enzyme function (identity). The sequence of c-luciferase is known [24,25] and is the only identified enzyme that oxidizes vargulin to produce light in ostracods [26–28]. Orthologous c-luciferase enzymes from two other species differ in their bioluminescent reaction, specifically in their affinity for vargulin [24]. These features in particular provide an excellent system for understanding how biochemical variation contributes to courtship display diversification.
Figure 1.

Phenotyping of bioluminescent waveforms. (a) Exemplar file depicting the parsing and model fitting of individual bioluminescent peaks. Single peaks are identified from a time series of stimulated bioluminescent events (inset, circled). Shaded zones are: red, the rise of a pulse as enzyme and substrate are secreted; yellow, the plateau as the enzyme is saturated with substrate; and blue, the pulse decay as the enzyme is substrate limited. Numbers indicate (1) the background voltage removed; (2) the minimum voltage to be kept in the analysis; (3) the beginning of the exponential decay; (4) time point at which the reaction reached half its maximum length; (5) overall decay length. During parsing, waveform axes were rescaled. (b) Different combinations of the decay equation constant λ (x-axis; as blue zone from (a)) and the plateau phase duration (dashed isoclines where darker = longer phase duration; as yellow zone from (a)) can generate similar total pulse durations (y-axis). Generated from hypothetical data. (Online version in colour.)
Within ostracods, the relative contributions of identity and implementation to phenotypic evolution are unknown. On the one hand, changes in the functional kinetics of c-luciferase enzymes (identity) across species could influence light production and alter courtship pulses; theoretically, enzymes with faster reactions will consume finite levels of secreted substrate more quickly, leading to shorter pulse durations. At the same time, changing the ratio of the reactants (implementation) could explain differences in duration of courtship pulses, as suggested in [14]: here, less excess substrate relative to the enzyme amount could also produce shorter pulses (by reducing the length of time in the plateau phase). Because cypridinid bioluminescence is secreted outside the body without further input, by mapping the relationship between enzyme performance and phenotype, we can simultaneously infer aspects about enzyme implementation. In a theoretical phenospace describing the duration of natural courtship pulses (figure 1b), c-luciferase identity (measured by the decay activity of the enzyme; from figure 1a, blue zone) and implementation (estimated as a proportion of time in the plateau phase of a pulse; from figure 1a, yellow zone) can combine differentially to produce similar total pulse durations. From this model, we may predict that the power to describe changes in the pulse duration phenotype varies across enzyme identity as it interacts with enzyme implementation.
We hypothesize that as species diverged, bioluminescence reactions also diverged, contributing to variation in courtship signals. We predict different species' luminous reactions have different light-production abilities, which relate to variation in the pulse duration of courtship signals. By measuring the decay of light production (an inherent aspect of bioluminescent reactions) in many species, and comparing those kinetics to the durations of courtship pulses in situ, we find that changes in enzyme function are nonlinearly and negatively correlated with changes in pulse duration across species. From this, we infer that both enzyme identity and implementation must contribute to disparity in courtship signals between species. As the power of enzyme identity to describe pulse duration diminishes, enzyme implementation must take precedence. Our ability to evaluate identity and implementation simultaneously leads to the inference that the path of evolutionary diversification may depend on current phenotype: fast pulses may more often diversify by changing components (implementation), while slow pulses may evolve by changing enzyme kinetics (identity). These results provide a clear example of how both identity and implementation influenced diversification of behavioural phenotypes across species, and the power that illustrating this pattern in a phenospace has on revealing the role historical constraint may play in phenotypic evolution.
2. Methods
(a). Animal collection and identification
We identified and collected different species from Jamaica, Honduras (Roatán), Belize, Puerto Rico and Panamá based on unique display traits in their bioluminescent signals (direction of display initiation, courtship pulse timing and microhabitat [18,29]). We swept through a single species’s display with hand-nets of 125 µm mesh [30]. Animals were sorted by their relative length : height ratio (characteristic of species and genera [29,31]; electronic supplementary material, table S3) measured on a Nikon SMZ-745 or SMZ-460 microscope (Mellville, NY, USA) with an eyepiece micrometre. During phenotyping, animals were housed in plastic Ziploc containers (Racine, WI, USA) with new seawater kept at ambient temperatures. Most species are unknown or only anecdotally recorded (J. G. Morin and G. A. Gerrish 1986, 1988, 1989, 1993, 2015, 2016, 2017, unpublished field notes). We report species by their field identifier, with ongoing work to describe them. As a note, bioluminescence is found in cypridind ostracods worldwide, but previous [17] and ongoing (E. A. Ellis 2018, personal communication) analyses suggest that mate signalling is found only within Caribbean species. So although bioluminescence is best known from species in Japan, these lack any mating signal for comparison.
(b). Induced bioluminescence phenotyping and data processing
We adapted PMT recording methods from [14]. We induced bioluminescence via mild electric shock with an Arduino Uno (electronic supplementary material, figure S1B #4) and captured light output over time (intensity measured in volts, denoted I) with an RCA 931-A Photomultiplier tube (PMT; Harrison, NJ, USA; electronic supplementary material, figure S1B #2) in a custom brass housing. Animals were placed in a scintillation vial within the housing (electronic supplementary material, figure S1B #3) with enough fresh seawater (approx. 2 ml) to submerge the tips of two silver wires, creating a cathode and anode. The PMT was connected to an analogue data acquisition device (Dataq Instruments, Akron, OH, USA; model DI-158 U for Jamaica; model DI-155 for other countries; electronic supplementary material, figure S1B #5). To visualize and record both stimulus and light output, we split the Arduino output into an electronic breadboard (electronic supplementary material, figure S1B #6), with one half on the scintillation vial nodes and the other half into the data collector. We covered the entire PMT housing with an opaque box (24-gallon Rubbermaid Action Packer; Atlanta, GA, USA) to block ambient light.
We automatically analysed data using a custom script in RStudio (v. 1.0.136) with R (v. 3.3.1). We cut files (figure 1 inset) to focus on the decay at the end of each defensive pulse (figure 1c blue zone). For details and code, see the electronic supplementary material.
Using the program ‘nlsLM’ in the ‘minpack.lm’ package, we fitted different exponential models to the decay of each defensive pulse in order to describe differences in bioluminescent production ability as enzyme identity. First, we used a model previously used to identify cypridinid decay constants [14]:
| 2.1 |
where I is the voltage observed at time t, I0 is the initial voltage at t = 0 (to be estimated) and the decay constant to be estimated is λ. Other models of biochemical reactions were fitted to these data as well. See the electronic supplementary material for further details. For all decay parameters estimated from any model, we averaged multiple values for each individual if possible; species are averages of as many individuals as possible (details in electronic supplementary material, tables S4–S6). We also applied these models to previously published decays from two other Japanese species for comparison (see the electronic supplementary material).
(c). Natural courtship phenotyping
We used WebPlotDigitizer [32] to extract average courtship pulse duration data from the first three pulses of measured displays from [18,29] for which we had corresponding species (n = 8). We used the first three courtship pulses because these may represent the ‘initiation’ phase of the signal [15], and are expected to be the most variable in duration within and between species. The original data plotted are species' averages per pulse with no intrapulse variation reported, and therefore, none to extract. For specifics, see the electronic supplementary material.
For an additional 10 species, we used video recordings of individual displays from the field to quantify pulse duration. Using a Sony A7S with attached Atomos Shogun in a custom underwater housing, individuals were recorded by following their single courtship displays while on SCUBA. A reference of known length was used to standardize focus, focal length and provide a scale while filming. We extracted pulse duration data from as many individuals as possible manually. These data were extracted along with other metrics of each courtship display as part of a forthcoming publication [33]. For data, metadata and further methods, see the electronic supplementary material.
(d). Transcriptome processing and mitochondrial phylogeny
Species traits may appear similar simply due to shared ancestry, therefore it is necessary to use a phylogenetic approach when comparing traits across species to make inferences about their evolution [34]. We generated a mitochondrial phylogeny from transcriptomes of each species stored in RNALater prepared using Illumina v. 2 or v. 3 kits in accordance with standard procedures (figure 2b). We sequenced on platforms including NextSeq (UC Santa Barbara), HiSeq (UC Davis) and MiSeq (Novogene). We trimmed adapter sequences and low-quality forward and reverse reads (scores < 20) using TrimGalore v. 0.4.1 [35]. Using a blast database of the Vargula hilgendorfii mitochondrial genome (GenBank #AB114300), we queried trimmed reads against this reference using BLAST 2.5.0+ [36] and removed any read not with ‘Family Cypridinidae’ in the top 5 hits. We then used Trinity v. 2.2.0 [37] to assemble decontaminated reads into contigs and calculated the species tree in IQ-TREE v. 1.6.1 [38]. We used ModelFinder [39], implemented in IQ-TREE to determine the best-fit model (GTR + F+I + G4) with 20 maximum-likelihood best tree searches and 1000 bootstraps. For further details, see the electronic supplementary material.
Figure 2.

Different decay constants (λ) between species indicate differences in enzyme activity. (a) Body height (H) and length (L) measures (mean ± s.e.) for 16 inferred species. Data and best-fit trend lines are coloured by genera, with different genera having different L : H slopes: ‘H’-group, red; Photeros, blue; Kornickeria, green; other, grey. Data from electronic supplementary material, table S3. (b) Density plots with means (blue dots) are the interpolated distribution of each species' decay constant. Nind and Npul indicate the number of individuals and pulses, respectively, sampled. For species with less than three estimates, no density plot could be generated. Decays are mapped onto a mitochondrial phylogeny and coloured by genus as in (a). Bootstrap values from 1000 bootstraps are mapped to the branches preceding their respective nodes. The first two letters of each ID are country of origin (Bz, Belize; Ja, Jamaica; Pa, Panama; Jp, Japan; Pr, Puerto Rico; Ro, Roatan), followed by a species-specific identifier. Most are undescribed, but described species are as follows: PMC, Photeros mcelroyi; PJA, Photeros jamescasei; PMO, Photeros morini; PAN, Photeros annecohenae; KHC, Kornickeria hastingsi carribowae. Note that decays below zero are an artefact of the smoothing function in generating the density plot. (Online version in colour.)
(e). Statistical analyses
We hypothesize that differences in courtship pulse duration are due to differences in c-luciferase activity, a function of enzyme identity. First, in order to look at c-luciferase activity differences, we compared estimates of the decay parameters (λ) across species using a linear mixed effect model (‘lme’ in the ‘nlme’ package of R) with species and max intensity per induced pulse as fixed effects, and country of origin and individual as random effects. We included max intensity (figure 1a; height in yellow zone), an imperfect proxy for the amount of reactants secreted, as a covariate because it may also influence decay estimates (see electronic supplementary material for a discussion on this). Decay parameters were log-transformed to meet assumptions of linearity and residual normality.
Secondly, we hypothesized that enzyme identity (as decay from stimulated defensive pulses) described variation in natural courtship pulse duration. Before phylogenetic correction, we explored the relationship between decay parameters and natural courtship duration using different linear and nonlinear models (electronic supplementary material, table S1), and subsequently with and without the presence of certain species (see the electronic supplementary material). After plotting the data and seeing that the best-fit model was nonlinear, we used our phylogeny in phylogenetic generalized nonlinear least-squares (PGNLS) regressions. Using the ‘gnls’ functions in the ‘nlme’ package, we regressed the decay constant against courtship pulse duration. We fit the correlation option with a Brownian motion transformation of the phylogeny (‘corBrownian’ in ‘ape’). To account for variation in both our decay estimates and natural courtship pulse duration, we used the weights option with the standard error of each measure ([34,40], for code see the electronic supplementary material). To compare nonlinear model fits, we used the maximum-likelihood estimate of the residual standard deviation of the error; support for phylogenetic or non-phylogenetic models was compared using AICc. We report all comparisons in electronic supplementary material, table S2.
3. Results
(a). Decays vary across species
We fitted mathematical models to measures of light production over time in stimulated anti-predator pulses (figure 1a); different species have different decay constants in spite of significant variation in maximum intensity (λ constant figure 2b; linear mixed effect model, species p < 0.001, max intensity p < 0.0093; for full model details and other decay parameters, see the electronic supplementary material).
(b). Differences in decay explain differences in courtship pulse duration across 16 species
Here λ explains variation in courtship pulse durations (figure 3; generalized nonlinear least-squares p < 0.0001, Bonferroni-corrected p < 0.0001; electronic supplementary material, table S3), and its effect is not equal for all species.
Figure 3.
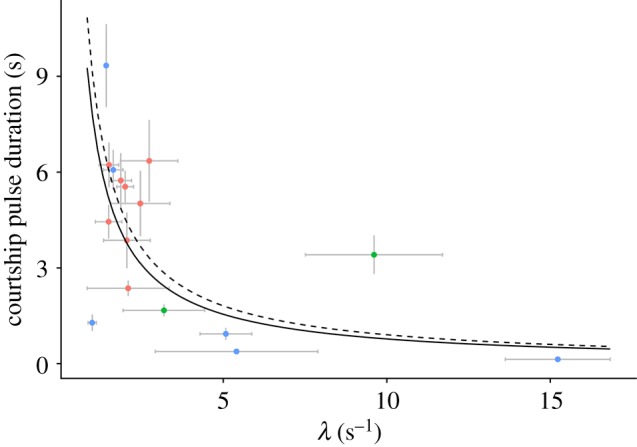
Enzyme identity (λ) describes some, but not all, differences between species in courtship duration. Scatterplot of courtship pulse duration and λ for 16 species (mean ± s.e. in grey). Given the nonlinear relationship between pulse duration and enzyme function, identity has less explanatory power at high λ values. Coloured by genera (Photeros, blue; Kornickeria, green; ‘H’-group, red), with best-fit regression estimates from an inverse model, including all data, excluding phylogeny, and without weights as a solid line and with weights as dashed line (from electronic supplementary material, table S2). (Online version in colour.)
We discovered the relationship between courtship pulse duration and λ best fits a negative, nonlinear pattern (figure 3; electronic supplementary material, table S1). On average, species with shorter pulse durations have higher, and therefore faster, decays. However, the strength of this pattern changes as pulse durations shorten and decays increase, generating a nonlinear effect. The preferred model (smallest residual squared error) was an inverse relationship between pulse duration and lambda; generally, inclusion of a phylogeny (based on AICc values) was not preferred, but in some cases was sensitive to whether certain species were included (electronic supplementary material, table S2). Excluding highly influential species in a reduced dataset (n = 14) had the same qualitative results as the full model. Analyses with or without weighting on standard error usually changed the model AICc values and sometimes model results (electronic supplementary material, table S2).
4. Discussion
We provide evidence that differences in biochemical reaction rates are associated with evolutionary divergence in behavioural phenotypes. By analysing variation in bioluminescent pulses of ostracods, we infer that both changes in c-luciferase enzyme function (identity) and implementation contributed to the diversification of courtship pulse duration in their mating displays. Between species, we found consistent differences in the decay constants of stimulated luminescence (figure 2b) explain some variation in the duration of natural courtship pulses (figure 3). One potential mechanism for increasing bioluminescent courtship diversity is changing enzyme function. In enzymatics, the parameters Vmax and Km describe an enzyme's ability to proceed through a reaction (see the electronic supplementary material for further discussion). By increasing Vmax or decreasing Km (electronic supplementary material, figure S5, equations S1 and S2), secreted c-luciferase will deplete the secreted substrate more quickly, such that decay rates could increase and courtship pulse duration will decrease. However, changes in the implementation of secretion components must also contribute to phenotypic differences in courtship pulse duration because residual variation in courtship pulse duration not due to enzyme function must be due to implementation (figure 3). There are multiple ways this could occur, including changes in enzyme : substrate ratios or unknown accessory components. Different species probably change the amount of substrate secreted, which alters the plateau phase of single pulses (yellow zone of figure 1a), thereby increasing or decreasing the overall duration of courtship pulses. Our data remain agnostic as to which particular implementation changes take place.
Changing both identity and implementation within these enzyme reactions could potentiate a high diversity of phenotypes in courtship pulse duration. Dual mechanisms underlying the phenotype may allow for evolutionary exploration of phenotype-space along more than one avenue simultaneously. By relying on more than one mechanism, courtship pulse duration could vary either enzyme ability or usage and produce multiple solutions towards a phenotypic state [7], as predicted by our phenospace. For any given pulse duration, there are multiple combinations of enzyme function and reactant implementation that produce the same result (figure 1b). This many-to-one mapping would result in a high level of convergence despite unique evolutionary pathways in functional underpinnings (e.g. as with haemoglobin [41]). Therefore, both a high level of convergence and a high level of disparity are reasonable expectations when increasing the number of different mechanisms generating a phenotype.
Importantly, the tendency for evolutionary change in courtship pulse duration to be mediated by changes to enzyme function or implementation depends on the current phenotype, suggesting that historical contingency shapes phenotypic patterns. As overall courtship pulse duration decreases, the changes in the enzymatic reaction rate describe less of the phenotype, as indicated by the nonlinear trends that best fit our data (figure 3; electronic supplementary material, table S1 and figure S6). Therefore, the residual variation due to implementation increases inversely with phenotypic state. At longer courtship pulse durations, enzyme function strongly influences the duration, so evolutionary changes in enzyme implementation (such as enzyme : substrate ratios) may not be used to evolve phenotype very much. Conversely, at short courtship pulse durations, where changes in function more weakly influence courtship pulse duration, evolution may change implementation of the reactants to drive phenotypic differences between species. Thus, the ability for evolution to alter the phenotype may depend on the phenotype's current reliance on either mechanism. Such dependence implies that courtship pulse duration is sensitive to historical contingency, as discussed in the literature [42] and implied with unique behavioural phenotypes [43,44], but rarely demonstrated (but see [45]). Our data provide a possible example as to how contingency arises at a mechanistic level, with reliance on either identity or implementation predicting the evolutionary trajectory of the phenotype.
Even though examples of both are known, the relative contributions of identity and implementation to evolution are still debated, not only for behaviour, but also for other phenotypes [46,47]. One reason for continued debate is that few studies have taken a pluralistic approach (but see [48]), leading to a limited ability to conclude how identity and implementation might jointly affect evolutionary change [49,50]. To understand best how different types of change impact evolutionary divergence, both must be evaluated to gauge their presence and efficacy for producing diversity. By conceptualizing our phenotype in a way that captures the relationship between these two mechanisms (figure 1b), we have been able to make new inferences on the evolution and disparity of ostracod courtship signals.
The relationship inferred between identity and implementation has multiple, potential explanations. First, limitations in c-luciferase function to describe changes in courtship pulse duration may be due to intrinsic enzyme properties, like maximum performance rate [51]. Alternatively, identity may be constrained by the inability to optimize all enzyme properties simultaneously (e.g. trade-offs in function and stability [52] at the protein level). Changing implementation could compensate for either of these, reminiscent of hypotheses on minimizing pleiotropic effects from coding changes [46]. Teasing apart a causal relationship between c-luciferase sequence and courtship pulse duration, as well as testing the connection between identity and implementation, will be possible in future molecular work because c-luciferase functions can be quantified in vitro [21,24].
5. Conclusion
In discovering unappreciated variation in the duration of light pulses of ostracod bioluminescence, we have generated testable hypotheses about (1) the relationship between genotype and phenotype, and (2) mechanisms of its diversification. Our data support the hypothesis that variation in courtship pulse duration between species is associated with changes in both c-luciferase function and the behavioural regulation of the bioluminescent reactants, providing a new example of how variation in biochemistry can influence the evolution of behavioural phenotypes. Each of these mechanisms has a limited, potentially interacting, role in shaping this behavioural phenotype in evolutionary time. The influence of either mechanism in shaping phenotypic diversity may depend on the phenotype's current reliance on function or implementation, which may explain why processes like historical contingency arise in phenotypic evolution.
Supplementary Material
Acknowledgements
We thank James G. Morin, Mitchel McCloskey, Yexin Jessica Li, Sarah M. Schulz, Nicholas J. Reda and Vanessa L. Gonzalez for assistance with animal collection; Morris Aguilar for transcriptome preparation; and Eric W. Slessarev, Andrew J. Swafford and Vanessa L. Gonzalez for computational analyses. We also thank field station staff members for their assistance with logistics: Cheryl and Danny Thacker (Smithsonian Institute Carrie Bow Caye Field Station), Captain Snow (University of West Indies Discovery Bay Marine Lab) and Plinio Gondola and Arcadio Castilla (Smithsonian Tropical Research Institute at Bocas del Toro). We are grateful for the UCSB Statistical Consulting Laboratory and two reviewers for improving the clarity of the manuscript.
Ethics
All organisms were collected in accordance with the regulations of the Jamaican National Environment and Planning Agency (Permit Ref. #18/27), the Belize Fisheries Department (Permit #000003-16), the Honduran Department of Fish and Wildlife (Permit #DE-MO-082-2016), the Puerto Rican Department of Natural and Environmental Resources (DRNA; Permit #2016-IC-113), and Panamanian Ministry of the Environment (MiAMBIENTE; Permit #SE/A-33-17).
Data accessibility
All code, phenotyping data, phylogeny and output files are available from the Dryad Digital Repository: http://dx.doi.org/10.5061/dryad.1fq675j [53].
Authors' contributions
T.J.R., N.M.H. and T.H.O. conceived of the study. N.M.H., J.P.F. and T.J.R. collected induced bioluminescence data. G.A.G. and T.J.R. recorded natural courtship pulse videos, and G.A.G. measured pulse duration data. E.A.E. generated the phylogenies with some sequences provided by E.T. N.M.H. extracted data from the literature, performed data analysis and statistics. N.M.H. and T.H.O. wrote the manuscript with comments from all other authors. All authors collected specimens.
Competing interests
We have no competing interests.
Funding
This work was supported by the National Science Foundation (to authors T.H.O. (DEB-1457754), G.A.G. (DEB-1457439), E.T. (DEB-1457462) and senior advisor James G. Morin). Supplementary research funds were provided by the Sigma Xi Grants in Aid of Research (G20141015722209) and the Society for the Study of Evolution Rosemary Grant Research Award to N.M.H. N.M.H. was supported by the UC Regents Special Fellowship and the National Science Foundation Graduate Research Fellowships Program. E.A.E. was supported by the UC President's Dissertation Fellowship.
References
- 1.Maan ME, Seehausen O. 2011. Ecology, sexual selection and speciation. Ecol. Lett. 14, 591–602. ( 10.1111/j.1461-0248.2011.01606.x) [DOI] [PubMed] [Google Scholar]
- 2.Ritchie MG. 2007. Sexual selection and speciation. Annu. Rev. Ecol. Evol. Syst. 38, 79–102. ( 10.1146/annurev.ecolsys.38.091206.095733) [DOI] [Google Scholar]
- 3.Ellis EA, Oakley TH. 2016. High rates of species accumulation in animals with bioluminescent courtship displays. Curr. Biol. 26, 1916–1921. ( 10.1016/j.cub.2016.05.043) [DOI] [PubMed] [Google Scholar]
- 4.Soma M, Garamszegi LZ. 2015. Evolution of courtship display in Estrildid finches: dance in relation to female song and plumage ornamentation. Front. Ecol. Evol. 3, 4 ( 10.3389/fevo.2015.00004) [DOI] [Google Scholar]
- 5.Bradbury JW, Vehrencamp SL. 2011. Principles of animal communication. Sunderland, MA: Sinauer. [Google Scholar]
- 6.Endler JA. 1992. Signals, signal conditions, and the direction of evolution. Am. Nat. 139, S125–S153. ( 10.1086/285308) [DOI] [Google Scholar]
- 7.Wainwright PC, Alfaro ME, Bolnick DI, Hulsey CD. 2005. Many-to-one mapping of form to function: a general principle in organismal design. Integr. Comp. Biol. 45, 256–262. ( 10.1093/icb/45.2.256) [DOI] [PubMed] [Google Scholar]
- 8.Podos J. 1997. A performance constraint on the evolution of trilled vocalizations in a songbird family (Passeriformes: Emberizidae). Evolution 51, 537–551. ( 10.1111/j.1558-5646.1997.tb02441.x) [DOI] [PubMed] [Google Scholar]
- 9.Miles MC, Schuppe ER, Ligon RM, Fuxjager MJ. 2018. Macroevolutionary patterning of woodpecker drums reveals how sexual selection elaborates signals under constraint. Proc. R. Soc. B 285, 20172628 ( 10.1098/rspb.2017.2628) [DOI] [PMC free article] [PubMed] [Google Scholar]
- 10.Storz JF. 2016. Hemoglobin-oxygen affinity in high-altitude vertebrates: is there evidence for an adaptive trend? J. Exp. Biol. 219, 3190–3203. ( 10.1242/jeb.127134) [DOI] [PMC free article] [PubMed] [Google Scholar]
- 11.Howard RW, Blomquist GJ. 2005. Ecological, behavioral, and biochemical aspects of insect hydrocarbons. Annu. Rev. Entomol. 50, 371–393. ( 10.1146/annurev.ento.50.071803.130359) [DOI] [PubMed] [Google Scholar]
- 12.Ohmiya Y, Hirano T, Ohashi M. 1996. The structural origin of the color differences in the bioluminescence of firefly luciferase. FEBS Lett. 384, 83–86. ( 10.1016/0014-5793(96)00288-8) [DOI] [PubMed] [Google Scholar]
- 13.Swapna I, Ghezzi A, York JM, Markham MR, Halling DB, Lu Y, Gallant JR, Zakon HH. 2018. Electrostatic tuning of a potassium channel in electric fish. Curr. Biol. 28, 2094–2102. ( 10.1016/j.cub.2018.05.012) [DOI] [PMC free article] [PubMed] [Google Scholar]
- 14.Rivers TJ, Morin JG. 2012. The relative cost of using luminescence for sex and defense: light budgets in cypridinid ostracods. J. Exp. Biol. 215, 2860–2868. ( 10.1242/jeb.072017) [DOI] [PubMed] [Google Scholar]
- 15.Rivers TJ, Morin JG. 2008. Complex sexual courtship displays by luminescent male marine ostracods. J. Exp. Biol. 211, 2252–2262. ( 10.1242/jeb.011130) [DOI] [PubMed] [Google Scholar]
- 16.Rivers TJ, Morin JG. 2013. Female ostracods respond to and intercept artificial conspecific male luminescent courtship displays. Behav. Ecol. 24, 877–887. ( 10.1093/beheco/art022) [DOI] [Google Scholar]
- 17.Cohen AC, Morin JG. 2003. Sexual morphology, reproduction and the evolution of bioluminescence in Ostracoda. Paleontol. Soc. Pap. 9, 37. [Google Scholar]
- 18.Morin JG, Cohen AC. 2010. It's all about sex: bioluminescent courtship displays, morphological variation and sexual selection in two new genera of Caribbean Ostracodes. J. Crustacean Biol. 30, 56–67. ( 10.1651/09-3170.1) [DOI] [Google Scholar]
- 19.Rivers TJ, Morin JG. 2009/9 Plasticity of male mating behaviour in a marine bioluminescent ostracod in both time and space. Anim. Behav. 78, 723–734. ( 10.1016/j.anbehav.2009.06.020) [DOI] [Google Scholar]
- 20.Morin JG. 2011. Based on a review of the data, use of the term ‘cypridinid' solves the Cypridina/Vargula dilemma for naming the constituents of the luminescent system of ostracods in the family Cypridinidae. Luminescence 26, 1–4. ( 10.1002/bio.1178) [DOI] [PubMed] [Google Scholar]
- 21.Kobayashi K, Ohmiya Y, Shinohara D, Ohmiya Y, Nabetani T, Niwa H.. 2001. Purification and properties of the luciferase from the marine ostracod Vargula hilgendorfii. In Bioluminescence and Chemiluminescence: Proceedings of the 11th International Symposium (eds Case JF, Herring PJ, Robison BH, Haddock SHD, Kricka LJ, Stanley PE), pp. 87–90. Singapore: World Scientific Publishing. [Google Scholar]
- 22.Shimomura O, Johnson FH. 1970. Mechanisms in the quantum yield of Cypridina bioluminescence. Photochem. Photobiol. 12, 291–295. ( 10.1111/j.1751-1097.1970.tb06061.x) [DOI] [PubMed] [Google Scholar]
- 23.Shimomura O, Johnson FH. 1971. Mechanism of the luminescent oxidation of cypridina luciferin. Biochem. Biophys. Res. Commun. 44, 340–346. ( 10.1016/0006-291X(71)90605-X) [DOI] [PubMed] [Google Scholar]
- 24.Nakajima Y, Kobayashi K, Yamagishi K, Enomoto T, Ohmiya Y. 2004. cDNA cloning and characterization of a secreted luciferase from the luminous Japanese ostracod, Cypridina noctiluca. Biosci. Biotechnol. Biochem. 68, 565–570. ( 10.1271/bbb.68.565) [DOI] [PubMed] [Google Scholar]
- 25.Thompson EM, Nagata S, Tsuji FI. 1989. Cloning and expression of cDNA for the luciferase from the marine ostracod Vargula hilgendorfii. Proc. Natl. Acad. Sci. USA 86, 6567–6571. ( 10.1073/pnas.86.17.6567) [DOI] [PMC free article] [PubMed] [Google Scholar]
- 26.McELROY WD, Chase AM. 1951. Purification of Cypridina luciferase. J. Cell. Comp. Physiol. 38, 401–408. ( 10.1002/jcp.1030380308) [DOI] [PubMed] [Google Scholar]
- 27.Tsuji FI, Sowinski R. 1961. Purification and molecular weight of Cypridina luciferase. J. Cell. Comp. Physiol. 58, 125–129. ( 10.1002/jcp.1030580203) [DOI] [PubMed] [Google Scholar]
- 28.Tsuji FI, Lynch RV 3rd, Stevens CL. 1974. Some properties of luciferase from the bioluminescent crustacean, Cypridina hilgendorfii. Biochemistry 13, 5204–5209. ( 10.1021/bi00722a024) [DOI] [PubMed] [Google Scholar]
- 29.Gerrish GA, Morin JG. 2016. Living in sympatry via differentiation in time, space and display characters of courtship behaviors of bioluminescent marine ostracods. Mar. Biol. 163, 190 ( 10.1007/s00227-016-2960-5) [DOI] [Google Scholar]
- 30.Morin JG. 1986. Firefleas of the sea: luminescent signaling in marine ostracode crustaceans. Fla. Entomol. 69, 105–121. ( 10.2307/3494749) [DOI] [Google Scholar]
- 31.Morin JG, Cohen AC. 2017. A guide to the morphology of bioluminescent signaling cypridinid ostracods from the Caribbean Sea, and a tabular key to the genera. Zootaxa 4303, 301–4349. [Google Scholar]
- 32.Rohatgi A. 2011. WebPlotDigitizer. See http://arohatgi.info/WebPlotDigitizer/app.
- 33.Gerrish GA, Ellis EA, Torres E, Hensley NM, Oakley TH, Rivers TJ, Morin JG.. In preparation. ‘Flashy’ speciation in Caribbean bioluminescent ostracods. [Google Scholar]
- 34.Garamszegi LZ. (ed). 2014. Modern phylogenetic comparative methods and their application in evolutionary biology: concepts and practice. Berlin, Germany: Springer. [Google Scholar]
- 35.Krueger F. 2015. Trim galore: a wrapper tool around Cutadapt and FastQC to consistently apply quality and adapter trimming to FastQ files. See http://www.bioinformatics.babraham.ac.uk/projects/trim_galore (accessed 20 October 2017). [Google Scholar]
- 36.Camacho C, Coulouris G, Avagyan V, Ma N, Papadopoulos J, Bealer K, Madden TL. 2009. BLAST+: architecture and applications. BMC Bioinf. 10, 421 ( 10.1186/1471-2105-10-421) [DOI] [PMC free article] [PubMed] [Google Scholar]
- 37.Grabherr MG, et al. 2011. Full-length transcriptome assembly from RNA-Seq data without a reference genome. Nat. Biotechnol. 29, 644–652. ( 10.1038/nbt.1883) [DOI] [PMC free article] [PubMed] [Google Scholar]
- 38.Nguyen L-T, Schmidt HA, von Haeseler A, Minh BQ.. 2015. IQ-TREE: a fast and effective stochastic algorithm for estimating maximum-likelihood phylogenies. Mol. Biol. Evol. 32, 268–274. ( 10.1093/molbev/msu300) [DOI] [PMC free article] [PubMed] [Google Scholar]
- 39.Kalyaanamoorthy S, Minh BQ, Wong TKF, von Haeseler A, Jermiin LS.. 2017. ModelFinder: fast model selection for accurate phylogenetic estimates. Nat. Methods 14, 587–589. ( 10.1038/nmeth.4285) [DOI] [PMC free article] [PubMed] [Google Scholar]
- 40.Sandel AA, Miller JA, Mitani JC, Nunn CL, Patterson SK, Garamszegi LZ. 2016. Assessing sources of error in comparative analyses of primate behavior: Intraspecific variation in group size and the social brain hypothesis. J. Hum. Evol. 94, 126–133. ( 10.1016/j.jhevol.2016.03.007) [DOI] [PMC free article] [PubMed] [Google Scholar]
- 41.Natarajan C, Hoffmann FG, Weber RE, Fago A, Witt CC, Storz JF. 2016. Predictable convergence in hemoglobin function has unpredictable molecular underpinnings. Science 354, 336–339. ( 10.1126/science.aaf9070) [DOI] [PMC free article] [PubMed] [Google Scholar]
- 42.York RA, Fernald RD. 2017. The repeated evolution of behavior. Front. Ecol. Evol. 4, 143 ( 10.3389/fevo.2016.00143) [DOI] [Google Scholar]
- 43.Blackledge TA, Gillespie RG. 2004. Convergent evolution of behavior in an adaptive radiation of Hawaiian web-building spiders. Proc. Natl Acad. Sci. USA 101, 16 228–16 233. ( 10.1073/pnas.0407395101) [DOI] [PMC free article] [PubMed] [Google Scholar]
- 44.Price JJ, Lanyon SM. 2002. Reconstructing the evolution of complex bird song in the oropendolas. Evolution 56, 1514–1529. ( 10.1554/0014-3820(2002)056[1514:RTEOCB]2.0.CO;2) [DOI] [PubMed] [Google Scholar]
- 45.Wischmann S, Floreano D, Keller L. 2012. Historical contingency affects signaling strategies and competitive abilities in evolving populations of simulated robots. Proc. Natl Acad. Sci. USA 109, 864–868. ( 10.1073/pnas.1104267109) [DOI] [PMC free article] [PubMed] [Google Scholar]
- 46.Stern DL, Orgogozo V. 2008. The loci of evolution: how predictable is genetic evolution? Evolution 62, 2155–2177. ( 10.1111/j.1558-5646.2008.00450.x) [DOI] [PMC free article] [PubMed] [Google Scholar]
- 47.Hoekstra HE, Coyne JA. 2007. The locus of evolution: evo devo and the genetics of adaptation. Evolution 61, 995–1016. ( 10.1111/j.1558-5646.2007.00105.x) [DOI] [PubMed] [Google Scholar]
- 48.Ding Y, Berrocal A, Morita T, Longden KD, Stern DL. 2016. Natural courtship song variation caused by an intronic retroelement in an ion channel gene. Nature 536, 329–332. ( 10.1038/nature19093) [DOI] [PubMed] [Google Scholar]
- 49.Turner LM, Young AR, Römpler H, Schöneberg T, Phelps SM, Hoekstra HE. 2010. Monogamy evolves through multiple mechanisms: evidence from V1aR in deer mice. Mol. Biol. Evol. 27, 1269–1278. ( 10.1093/molbev/msq013) [DOI] [PubMed] [Google Scholar]
- 50.Cande J, Stern DL, Morita T, Prud'homme B, Gompel N. 2014. Looking under the lamp post: neither fruitless nor doublesex has evolved to generate divergent male courtship in Drosophila. Cell Rep. 8, 363–370. ( 10.1016/j.celrep.2014.06.023) [DOI] [PMC free article] [PubMed] [Google Scholar]
- 51.Albery WJ, Knowles JR. 1977. Efficiency and evolution of enzyme catalysis. Angew. Chem. Int. Ed Engl. 16, 285–293. ( 10.1002/anie.197702851) [DOI] [PubMed] [Google Scholar]
- 52.Tokuriki N, Stricher F, Serrano L, Tawfik DS. 2008. How protein stability and new functions trade off. PLoS Comput. Biol. 4, e1000002 ( 10.1371/journal.pcbi.1000002) [DOI] [PMC free article] [PubMed] [Google Scholar]
- 53.Hensley NM, Ellis EA, Gerrish GA, Torres E, Oakley TH, Rivers TJ. 2018. Data from: Phenotypic evolution shaped by current enzyme function in the bioluminescent courtship signals of sea fireflies Dryad Digital Repository. ( 10.5061/dryad.1fq675j) [DOI] [PMC free article] [PubMed]
Associated Data
This section collects any data citations, data availability statements, or supplementary materials included in this article.
Data Citations
- Hensley NM, Ellis EA, Gerrish GA, Torres E, Oakley TH, Rivers TJ. 2018. Data from: Phenotypic evolution shaped by current enzyme function in the bioluminescent courtship signals of sea fireflies Dryad Digital Repository. ( 10.5061/dryad.1fq675j) [DOI] [PMC free article] [PubMed]
Supplementary Materials
Data Availability Statement
All code, phenotyping data, phylogeny and output files are available from the Dryad Digital Repository: http://dx.doi.org/10.5061/dryad.1fq675j [53].