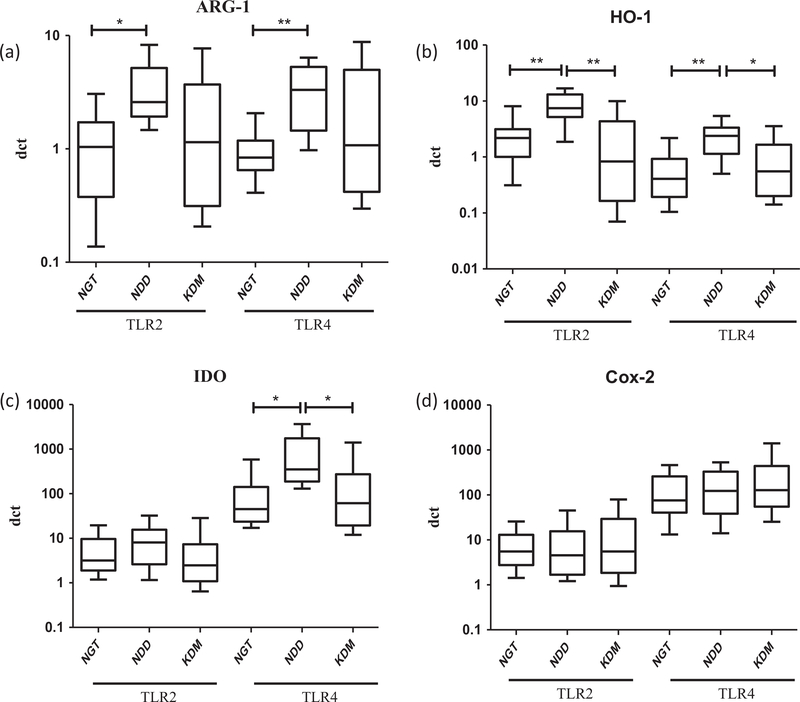
Fig. 4.
Newly diagnosed DM is characterized by increased expression of TLR induced immunomodulatory enzymes as determined by qRT-PCR. Box and whisker plots showing the fold change expression of Arg-1 (a), HO-1 (b), IDO (c) and Cox-2 (d) in NGT/control (n = 13), NDD (n = 14) and KDM (n = 15) subjects are shown. Statistical significance was determined by non-parametric Mann–Whitney U test and p < 0.05 was considered significant. NGT – normal glucose tolerance, NDD – newly diagnose ddiabetic, KDM – known diabetic subjects.

