Abstract
Incomplete fusion of the optic fissure leads to ocular coloboma, a congenital eye defect that affects up to 7.5 per 10,000 births and accounts for up to 10 percent of childhood blindness. The molecular and cellular mechanisms that facilitate optic fissure fusion remain elusive. We have profiled global gene expression during optic fissure morphogenesis by transcriptome analysis of tissue dissected from the margins of the zebrafish optic fissure and the opposing dorsal retina before (32 hours post fertilisation, hpf), during (48 hpf) and after (56 hpf) optic fissure fusion. Differential expression analysis between optic fissure and dorsal retinal tissue resulted in the detection of several known and novel developmental genes. The expression of selected genes was validated by qRT-PCR analysis and localisation investigated using in situ hybridisation. We discuss significantly overrepresented functional ontology categories in the context of optic fissure morphogenesis and highlight interesting transcripts from hierarchical clustering for subsequent analysis. We have identified netrin1a (ntn1a) as highly differentially expressed across optic fissure fusion, with a resultant ocular coloboma phenotype following morpholino antisense translation-blocking knockdown and downstream disruption of atoh7 expression. To support the identification of candidate genes in human studies, we have generated an online open-access resource for fast and simple quantitative querying of the gene expression data. Our study represents the first comprehensive analysis of the zebrafish optic fissure transcriptome and provides a valuable resource to facilitate our understanding of the complex aetiology of ocular coloboma.
Introduction
Epithelial fusion events during embryogenesis are crucial for the correct formation and function of multiple organs and tissues. Fusion requires precise spatiotemporal molecular control of cell migration, proliferation and programmed cell death1. During ocular development, the neuroectodermal layers of the optic vesicle invaginate to form a bi-layered optic cup. The invagination process leads to the formation of a transient opening along the ventral aspect of the retina and optic stalk, called the optic fissure, through which the hyaloid artery and vein enter and supply the developing eye2–4. Fusion of the optic fissure, which normally occurs during weeks 5 to 7 of human gestation, involves apposition of the epithelial margins around the vasculature, spatial specification along the proximal-distal axis of the fissure and basement membrane breakdown, resulting in the formation of a continuous epithelial layer5–7.
Incomplete fusion of the optic fissure leads to the congenital eye defect ocular coloboma, located in the inferonasal quadrant of the eye. It can involve one or multiple ocular tissues spanning the iris, zonules and ciliary body, retina, choroid and optic nerve8,9. Ocular coloboma has a prevalence of up to 7.5 per 10,000 births and accounts for approximately 10% of childhood blindness worldwide10,11. Ocular coloboma can present in isolation, as part of a clinical spectrum with microphthalmia and anophthalmia (mixed), associated with other ocular disorders (complex) or with other systemic features (syndromic)12. To date, around 100 genes have been associated with non-syndromic and syndromic ocular coloboma, microphthalmia and anophthalmia, showing extensive genetic heterogeneity and complexity12,13.
Zebrafish eye development displays molecular complexity and stringent spatiotemporal regulation which is similar to that seen in humans14,15. Our objective was to analyse transcriptome changes in the zebrafish optic fissure before (32 hours post fertilisation, hpf), during (48 hpf) and after fissure fusion (56 hpf). Thus, we analysed global gene expression in tissue dissected from the margins of the optic fissure and opposing dorsal retina tissue. In zebrafish, a superior ocular sulcus also extends across the dorsal retina, separating the nasal and temporal retinal lobes, however this sulcus is present transiently, closing by 26 hpf16.
We discuss biological themes inferred from gene ontology (GO) overrepresentation analysis in the context of optic fissure morphogenesis. Hierarchical clustering facilitated the detection of homogeneous co-expressed gene subgroups, including known and predicted unknown genes underlying fusion of the optic fissure, thus expanding the coloboma target gene repertoire for screening, diagnostics and further functional studies. We further characterised candidates fam132a and ntn1a by gene silencing via morpholino antisense translation-blocking knockdown. Finally, we have used our dataset to generate an open access resource for fast and simple quantitative querying of the RNA-seq gene expression data (bit.ly/ZfOptic2018).
Results
Transcriptome sequencing and mapping
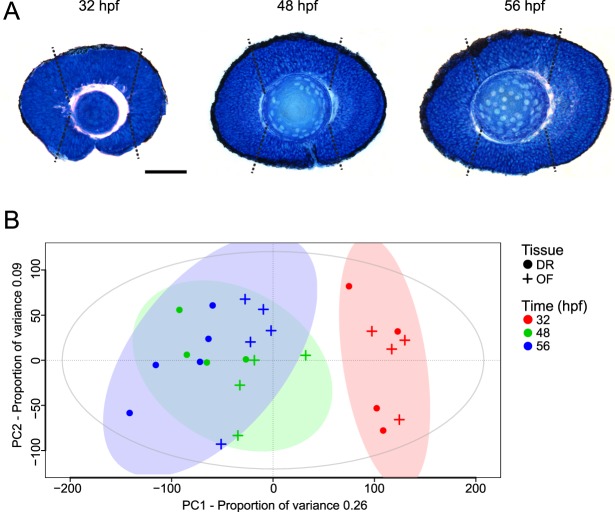
To investigate the mechanisms that underpin optic fissure fusion, we carried out RNA transcriptome analysis using high quality mRNA extracted from wild-type, AB-strain zebrafish optic fissure (OF) and opposing dorsal retina (DR) tissue (Fig. 1A). Time points 32 hpf, 48 hpf and 56 hpf were chosen as representative of before, during and after optic fissure fusion (Fig. 1A). Tissue was dissected from five biological replicates at each time point for sufficient statistical power. Four of the thirty samples failed library read duplication quality control and were removed from subsequent analysis (paired OF and DR samples at 32 hpf and 48 hpf). High quality reads were mapped to the reference zebrafish genome GRCz10. A summary of read alignment metrics for each sample is shown in Table S1. Principle component analysis (PCA) clustered the 48 hpf and 56 hpf OF and DR samples, distinct from 32 hpf OF and DR samples emphasising less biological variance between samples at 48 hpf and 56 hpf, whilst 32 hpf demonstrated a more disparate transcriptome signature (Fig. 1B).
Figure 1.
Optic fissure (OF) and dorsal retina (DR) tissue collection and principle component analysis (PCA). (A) Sagittal section through the zebrafish eye at the level of the lens at 32, 48 and 56 hpf, representative of before, during and after optic fissure fusion. White dotted lines indicate the tissue (inferior is optic fissure and superior is dorsal retina) harvested for RNA-seq transcriptome analysis. Scale bar 50 µm. (B) PCA of RNA-seq transcriptome data expression patterns using regularized-logarithm transformed count data in DESeq2. Time (hours post fertilization, hpf) is represented by colour and origin of tissue by shape.
OF versus DR pairwise tissue analysis
To identify differentially expressed gene (DEG) events within the data we carried out pairwise condition testing. All possible discrete combinations of tissue type and time point conditions were tested, identifying DEGs with a fold change greater than two and adjusted p-value below 0.01. The filtered data output for each test are listed in Table S2. We prioritised pairwise OF versus reference DR tissue tests at 32 hpf, 48 hpf and 56 hpf to identify biologically important DEG events for proper optic fissure morphogenesis. DEGs were reported in relation to the expression in reference DR tissue at each time point. At 32 hpf, we identified 181 DEGs in OF tissue; 146 DEGs were upregulated and 35 downregulated in OF tissue relative to the DR. At 48 hpf, 79 DEGs were identified; 63 DEGs were upregulated and 16 downregulated in OF tissue. Finally, at 56 hpf, we identified 62 DEGs; 44 DEGs were upregulated and 18 downregulated in OF tissue (Table S2).
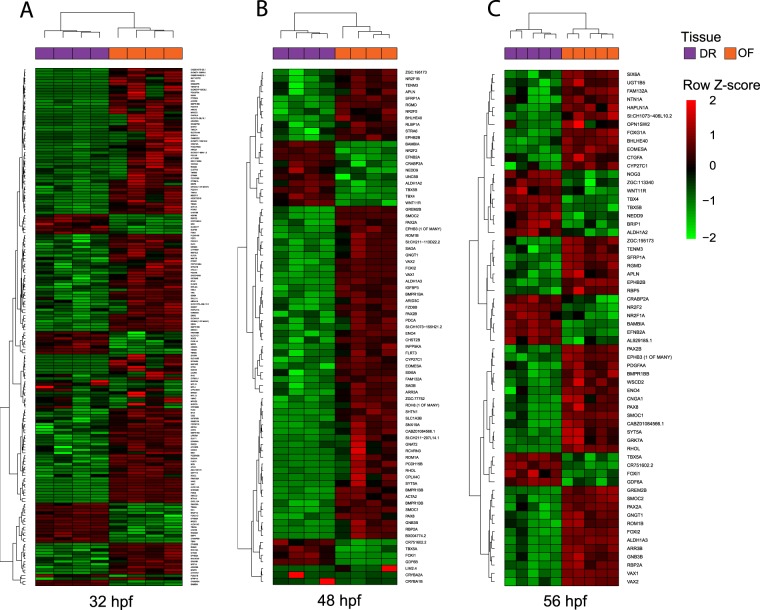
We performed unbiased hierarchical cluster analysis on significant DEG events at each time point to identify co-regulated or functionally related DEGs. The data were visualised using heat maps (Fig. 2A–C). Individual clusters were assigned to general groups following visual examination of the expression patterns. Gene ontology enrichment analysis was performed on clusters with positive fold change increase. At 32 hpf clusters of genes with higher expression in OF versus DR showed an enrichment for ‘regulation of neurogenesis’ (GO:0050767) and ‘embryonic morphogenesis’ (GO:0048598) [gna2, nr2f5, vax2, rom1a, arr3a, rhoI]. At 48 hpf, we identified ontologies including: ‘visual perception’ (GO:0007601), ‘embryonic camera-type eye morphogenesis’ (GO:0048596) [pax2a, vax1, vax2 and sfrp1a], as well as ‘closure of optic fissure’ (GO:0061386) with vax1, vax2 and sfrp1a as the most significant group. Clustering genes higher expressed in OF versus DR at 56 hpf identified ‘closure of optic fissure’ (GO:0061386).
Figure 2.
Hierarchical clustered heatmaps illustrating significant differentially expressed gene (DEG) profiles between optic fissure (OF) and opposing dorsal retina (DR) tissue. DEG events between OF versus DR pairwise tests at (A) 32 hpf, (B) 48 hpf and (C) 56 hpf. Rows indicate DEG genes; columns represent individual tissue samples from the time points.
Overrepresentation analysis of DEG events during optic fissure morphogenesis
To classify gene sets functionally, we conducted overrepresentation analysis of statistically significant DEG events between OF and DR tissue at each time point and subset ‘Biological process’ gene ontology (GO) terms with the aim to delineate processes governing optic fissure fusion. At 32 hpf, 34 significantly overrepresented GO terms derived from the ‘Biological Process’ category were identified, 22 terms at 48 hpf and 24 terms at 56 hpf. A detailed summary of significantly overrepresented GO terms at each time point is provided in Table S3. Significantly overrepresented GO terms, after multiple testing adjustment, for each time point tissue comparison are shown in Fig. 3.
Figure 3.
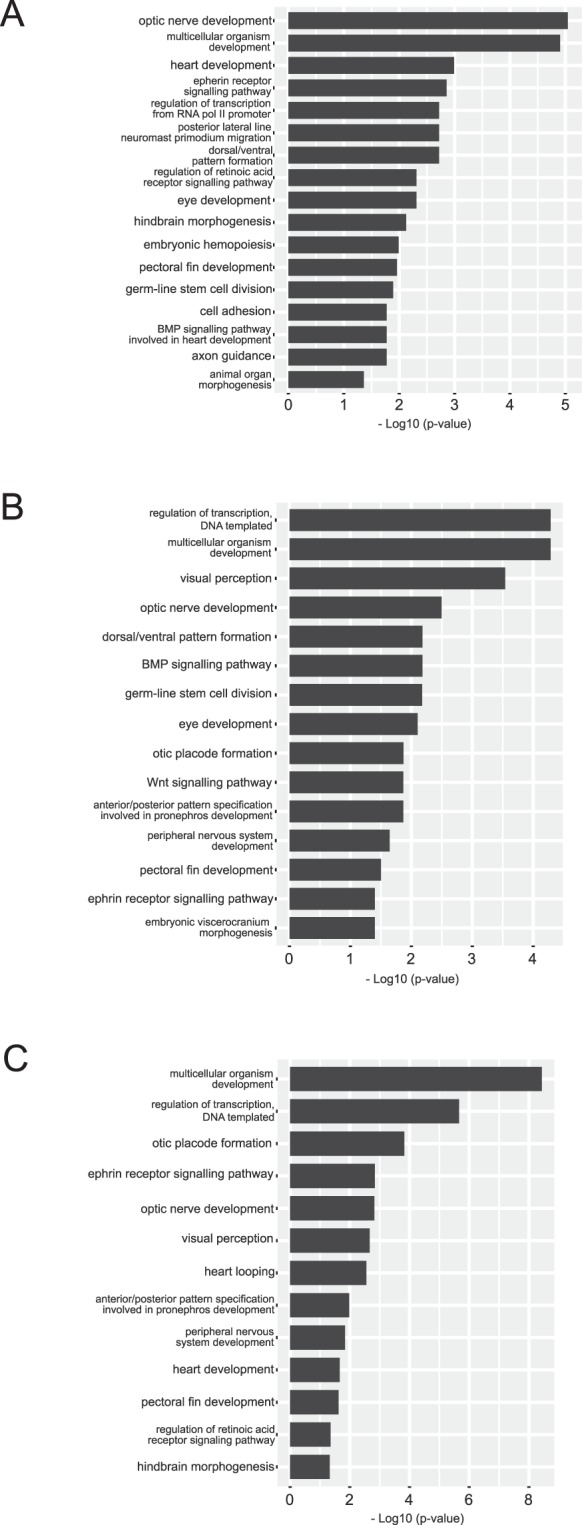
Gene ontology overrepresentation analysis of significant differentially expressed gene (DEG) events between optic fissure (OF) and opposing dorsal retina (DR) tissue. Assigned gene ontology (GO) terms were used to classify functions of DEGs based on biological process at (A) 32 hpf, (B) 48 hpf and (C) 56 hpf. The plots show significantly enriched GO terms at each time point. Detailed information can be found in Table S3.
Ocular development and function
At each time point investigated, DEG events were significantly overrepresented for GO terms linked to ocular development, including ‘eye development’ (GO:0001654), ‘retina morphogenesis in camera-type eye’ (GO:0060042) and ‘optic nerve development’ (GO:0021554). Importantly, at 48 hpf and 56 hpf DEG events were significantly overrepresented for the GO term, ‘optic fissure fusion’ (GO:0061386); specifically, we observed upregulation of vax2 (LFC [log2FoldChange] 5.60, p < 0.001 at 48 hpf; LFC 3.98, p < 0.001 at 56 hpf) and sfrp1a (LFC 2.19, p < 0.001 at 48 hpf; LFC 2.29, p < 0.001 at 56 hpf) in OF relative to DR tissue. Both vax2 and sfrp1a genes have been implicated in dorsoventral patterning of the developing eye and their loss of function leads to ocular coloboma17,18.
Throughout 32–56 hpf, DEG events were also significantly overrepresented for GO terms linked to ocular function, such as, ‘phototransduction’ (GO:0007602), ‘detection of light stimulus involved in visual perception’ (GO:0050908), ‘visual perception’ (GO:0007601) and ‘photoreceptor activity’ (GO:0009881).
Retinal patterning and signal transduction pathways
Patterning of the developing eye is critically important for proper axonal pathfinding and morphogenetic events, such as optic fissure fusion19. In our pairwise tissue DEG data GO terms, ‘dorsal/ventral pattern formation’ (GO:0009953), ‘anterior/posterior pattern specification’ (GO:0009952) and ‘determination of dorsal identity’ (GO:0048263) were overrepresented.
Wnt, Bmp4 and RA signalling pathways in the dorsal retina play significant roles in establishing dorsoventral retinal boundaries and related morphogenetic movements20. Accordingly, GO terms, ‘regulation of RA receptor signalling pathway’ (GO:0048385), ‘BMP signalling pathway’ (GO:0030509) and ‘negative regulation of BMP signalling pathway’ (GO:0030514) were overrepresented between 32–56 hpf alongside terms, ‘Wnt signalling pathway’ (GO:0016055) and ‘Positive regulation of Wnt signalling pathway (GO:0090263). For example, at 32 hpf, we observed downregulation of bmp4 (LFC −1.64, p < 0.001) in OF tissue as well as down-regulation of putative BMP target, tbx5a (LFC −9.29, p < 0.001) and BMP and activin membrane bound inhibitor, bambia (LFC −3.38, p < 0.001) in OF relative to DR. Additionally, we observed downregulation of wnt11r at 48–56 hpf in OF (LFC −2.21 at 48 hpf, LFC −1.84 at 56 hpf, p < 0.01). Importantly, optic fissure fusion defects have been linked to aberrant dorsal-ventral neuro-retinal patterning and the spatiotemporal interaction of signalling pathways in normal optic vesicle development has been described3,21.
Periocular mesenchyme (POM) development and function
During optic fissure morphogenesis, POM cells, which arise from both the head mesoderm and neural crest, migrate into the optic cup through the optic fissure to form the retinal vasculature22,23. POM-derived endothelial cells that give rise to the hyaloid vasculature contribute to basement membrane breakdown, extending processes to contact the cells of the optic fissure margins to facilitate fusion5,24. At 32 hpf, the GO category ‘mesodermal cell migration’ (GO:0008078), was found to be significantly over-represented; specifically, we observed upregulation of genes encoding Apelin (apln) (LFC 2.69, p < 0.001) and its cognate receptor aplnrb (LFC 1.43, p < 0.01), in OF tissue at 32 hpf. At 48 hpf and 56 hpf, these genes were no longer significantly differentially expressed in OF samples, in keeping with the observed presence of mesodermal-derived POM cells within the fissure up until, but not after optic fissure fusion24. Importantly. mutations in genes controlling POM development or function have been shown to disrupt optic fissure fusion25.
Vascular development
The hyaloid vasculature and/or POM-derived endothelial cells giving rise to the hyaloid vasculature enter the optic cup through the optic fissure and contribute to basement membrane breakdown and fissure fusion5. DEG events were significantly overrepresented for GO terms ‘embryonic hemopoiesis’ (GO:0035162), ‘angiogenesis’ (GO:0001525), ‘negative regulation of angiogenesis’ (GO:0016525), ‘vasculogenesis’ (GO:0001570), and ‘vasculature development’ (GO:0001944), at 32 hpf. Specifically, at 32 hpf we observed upregulated expression of vasculo- and angio-genesis regulators including; ntn1a (LFC 5.52, p < 0.001), klf2a (LFC 2.81, p < 0.001), adgrb3 (LFC 5.19, p < 0.01), tbx20 (LFC 4.32, p < 0.001) and slc4a1a (LFC 4.63, p < 0.001) in OF tissue, alongside DR DEGs unc5b (LFC -3.14, p < 0.001) and efnb2a (LFC -2.93, p < 0.001).
By 48 hpf the margins of the optic fissure come together, enclosing the hyaloid artery and vein. At 48 hpf the GO term, ‘venous blood vessel development’ (GO:0060841) was significantly overrepresented, with vascular specification markers nr2f2 (LFC -1.63, p < 0.001) and nr2f1b (LFC 1.22, p < 0.01) showing differential expression between the OF and DR. Functional redundancy of genes involved in hematopoiesis and vascular development can lead to failed optic fissure fusion26.
Cell-cell interactions
After mesenchymal cell migration, the margins of the optic fissure align and fuse forming a continuous optic cup. This process requires complex cell morphological changes and rearrangement at the optic fissure margin, largely mediated by the structural remodelling of cell-cell adhesions27,28. For example, cell adhesion molecules regulate homotypic interactions between projecting axons. In this context, between 30–36 hpf the first (RGC) axons exit and navigate along the optic stalk29. At 32 hpf DEG events were overrepresented for GO terms, ‘cell adhesion’ (GO:0007155) and ‘homophilic cell adhesion via plasma membrane adhesion molecules’ (GO:0007156). Specifically, we observed upregulation of cadherin superfamily genes cdh4 (LFC 1.93, p < 0.001), pcdh8 (LFC 2.72, p < 0.001), pcdh11 (LFC 4.19, p < 0.001) and pcdh12 (LFC 3.61, p < 0.01) in OF tissue.
Validation and visualisation of mRNA expression
We validated the expression of 11 selected genes using real-time quantitative RT-PCR (qRT-PCR) analysis. Genes g6pd, znf644a, tbx3a, efnb2a, nxn, dacha, smad6a, msxc, bambia, src and arl3l1 were selected due to their distribution across varied GO hierarchy (Table S3). To evaluate concordance in gene expression intensities between RNA-seq and qRT-PCR data, we applied Spearman’s correlation coefficient. The Spearman correlation coefficient was 0.913 (p < 0.001) for selected genes (Fig. 4), indicating the high reliability and accuracy of our RNA-seq transcriptome analysis to quantify gene expression during zebrafish optic fissure morphogenesis.
Figure 4.
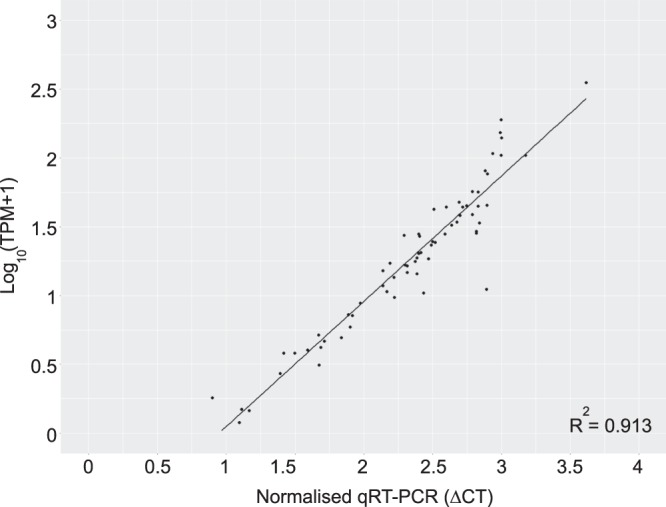
Gene expression correlation between qRT-PCR and RNA-seq trancriptome data. The plot shows gene expression abundance determined by qRT-PCR and RNA-seq transcriptome analysis for 11 selected genes. TPMs were calculated using the online resource generated for this manuscript (bit.ly/ZfOptic2018). The Pearson correlation coefficient (R2) and linear regression line are indicated (p < 0.001).
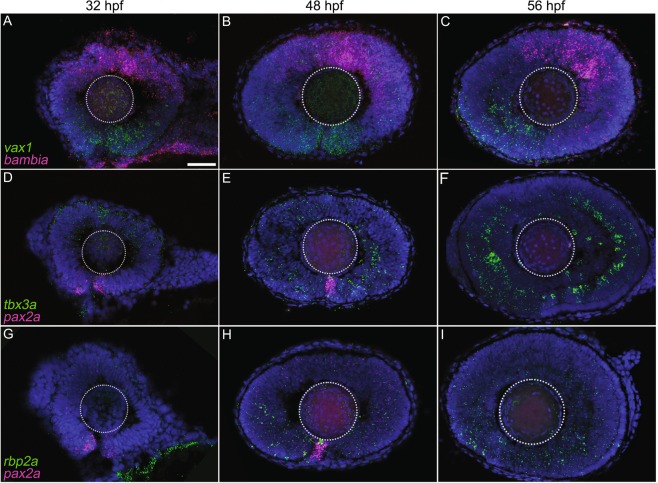
RNAscope in situ hybridisation (ISH) permitted the visualisation of mRNA transcripts providing spatial and morphological context to the expression data (Fig. 5). Transcripts selected were predicted to show distinct spatiotemporal expression patterns across the dorsal-ventral axis of the developing retina using the transcriptome analysis. Positive signal for pax2a mRNA was restricted to the margins of the optic fissure during fusion, with little/no expression once fusion was complete (Fig. 5D–I). Expression of vax1 mRNA was confined to the developing ventral retina throughout optic fissure fusion (Fig. 5A–C). Expression of rbp2a was observed in the retina at 48 and 56 hpf, predominantly in the ventral region and with increasing expression over time (Fig. 5G–I). We also analysed the expression of BMP-antagonists bambia and tbx3a. Consistent with previous reports, expression of bambia was restricted to the dorsal developing retina30 (Fig. 5A–C). Expression of tbx3a was observed in the dorsal retina throughout 32–56 hpf and in the ventral retina from 48–56 hpf, with highest expression in the ventral retina (Fig. 5D–F).
Figure 5.
RNAscope in situ hybridisation for visualisation of selected differentially expressed gene (DEG) events from RNA-seq transcriptome analysis. Representative images of dual in situ hybridisation in the wild-type zebrafish retina using mRNA probes to (A–C) vax1 and bambia, (D–F) tbx3a and pax2a, and (G–I) rbp2a and pax2a at 32, 48 and 56 hpf. Nuclei were labelled with 4′,6-diamidino-2-phenylindole (DAPI). White dotted lines indicate the location of the lens. Scale bar 50 µm.
Global analysis of differentially expressed genes over time
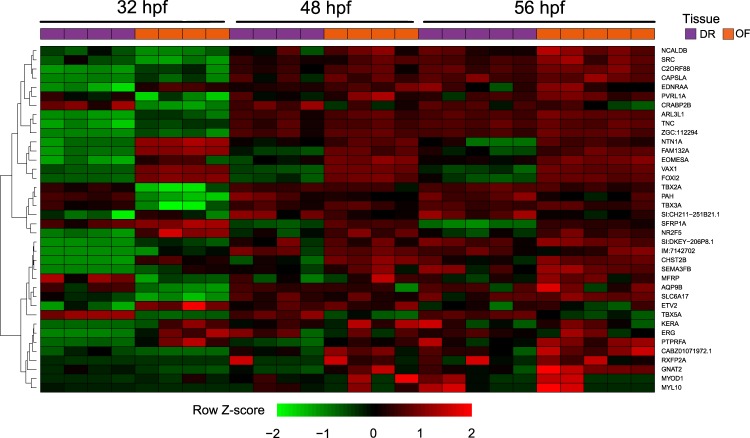
To better define the dynamic changes in global gene expression levels between 32–56 hpf and to isolate high priority candidates that are biologically relevant during optic fissure fusion we performed a time series DEG analysis using the DESeq2 likelihood-ratio test (LRT). LRT aims to test whether a gene’s expression alters in a condition specific manner between OF and DR tissue over time. In analysing count data, DESeq2 estimates dispersion of each transcript’s expression by considering the dispersion of genes expressed at similar levels. Using this method, we identified 38 significant DEG events between OF and DR tissue over time (Table S5). Highly significant (p < 0.001) DEG events between OF and DR over time included T-box genes involved in heart development (tbx2a/3a), regulation of glucose (fam132a), membrane component (chst2b), regulation of vascular permeability (src), transmembrane transport (slc6a17), metabolic process (pah), retinoic acid regulation (nr2f5) and axon guidance (arl3l1, ntn1a, tnc).
To identify co-expression patterns between DEG events, we applied unbiased hierarchical cluster analysis to the data sets and visualised the data using heat maps (Fig. 6). Tissue-type/stage hierarchical clustering and PCA analysis (Fig. 1B) supported similar interpretations; 32 hpf OF and DR samples formed distinct clusters from 48–56 hpf OF and DR samples. Additionally, OF samples at 48 hpf and 56 hpf clustered together, and DR samples at 48 hpf and 56 hpf clustered together.
Figure 6.
Global analysis of differentially expressed gene (DEG) events over time. The heatmap shows DEG events between optic fissure (OF) and dorsal retina (DR) tissue over time after being subjected to hierarchical cluster analysis.
Of note, ntn1a, fam132a and eomesa clustered together with coloboma-causing vax131 and forkhead box gene foxi2, which has a role in ocular size, localised in the ventral retina32. This ventral distribution of foxi2 is significantly altered in zebrafish lacking gdf6a which results in a spectrum of microphthalmia, anophthalmia and coloboma (MAC) phenotypes. This gene set demonstrated upregulated expression in OF relative to DR tissue at 32 hpf, which was still evident but less pronounced by 48–56 hpf (Fig. 6).
Functional investigation of highly significant DEGs identified using LRT analysis highlights ntn1a as a novel mediator of optic fissure fusion
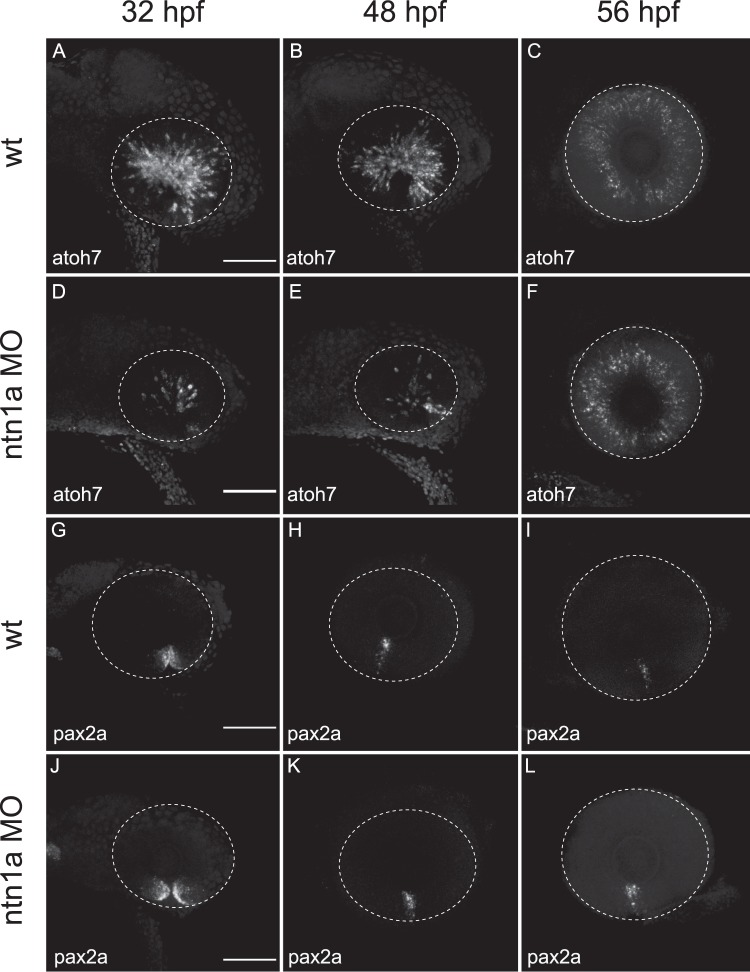
To assess the functional role of novel genes having higher expression in OF over time compared to DR, we undertook morpholino antisense translation-blocking knockdown of two candidates, fam132a and ntn1a, not previously related to fusion clustered in the LRT analysis (Fig. 6). Morphant fam132a embryos demonstrated no discernible phenotype on wholemount morphology (data not shown), however the reduction of ntn1a resulted in loss of optic fissure fusion at 48 hpf and 56 hpf timepoints (Fig. 7B,C). No significant difference was observed at 32 hpf (Fig. 7C). Temporal expression of ntn1a from the RNA-seq data showed significantly higher expression in the optic fissure at 32 hpf, decreasing over 52 hpf (Fig. 7A). In situ analysis of specific genes related to coloboma/optic fissure fusion/eye development (vax1/2, pax2a, eomesa, and atoh7) were carried out on 32, 48 and 56 hpf staged wt and ntn1a morphant embryos. The expression pattern of atoh7, critical for the develop of retinal ganglion cells and optic nerve formation33, was significantly reduced in ntn1a morphant embryos at 32 hpf and 48 hpf compared to wt (Fig. 8A,B,D,E). However, at 56 hpf the expression of atoh7 was similar in wt and ntn1a morphants (Fig. 8C,F). Expression of pax2a remained persistent in ntn1a morphant embryos at 56 hpf compared to wt (Fig. 8I,L). Analysis of the expression of eomesa and vax1/2 showed no difference between morphants and controls, however showed expression patterns validating the RNA-seq data between OF and DR tissues (data not shown).
Figure 7.
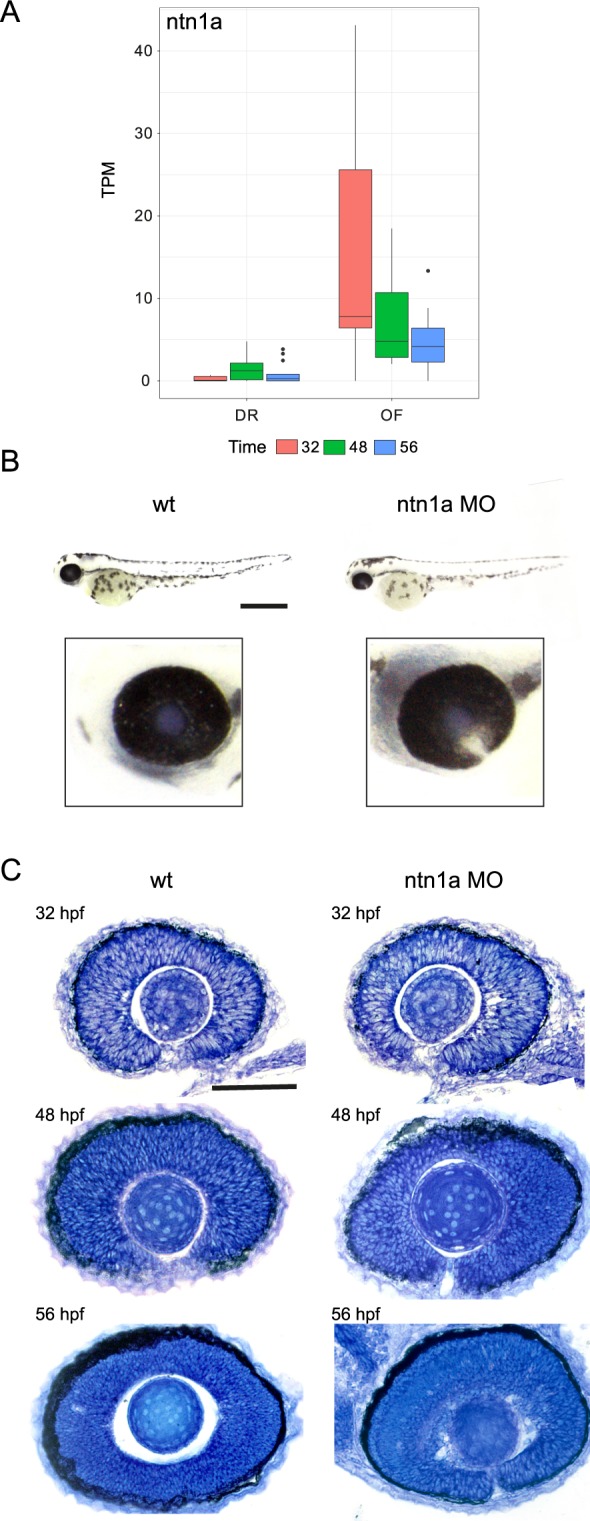
Failure of optic fissure fusion in ntn1a morphant zebrafish embryos. Expression levels (TPM, transcripts per million) of ntn1a candidate DEG showing temporal expression at 32,48 and 56 hours post fertilization (hpf) (A). (B) Wholemount and ocular morphology of 56 hpf wildtype (wt) and ntn1a morphant embryos, showing loss of ntn1a results in an ocular coloboma phenotype, scale bar 500 µm. (C) Histological analysis confirming loss of optic fissure fusion in ntn1a morphants. Scale bar 50 µm.
Figure 8.
Expression analysis of ntn1a morphant embryos through optic fissure fusion. Representative images of in situ hybridisation in wild-type and ntn1a morphant zebrafish retina using mRNA probes for (A–F) atoh7 and (G–L) pax2a at 32, 48 and 56 hpf. White dotted lines indicate the circumference of the eye. Scale bar 50 µm.
Discussion
During zebrafish development, at 32 hpf despite tight opposition of the optic fissure margins, the basement membrane remains intact throughout the proximal-distal axis of the fissure and by 48 hpf, basement membrane breakdown has commenced5. Optic fissure fusion is complete by 56 hpf5,24. Through analysis of genome-wide expression patterns within tissue dissected from the OF and opposing DR at these three key developmental stages, we have identified DEGs and highlighted functional characteristics of gene-sets during optic fissure fusion. Our analyses captured molecular signatures of ocular development, which could further be exploited to help elucidate the mechanisms that underpin normal and aberrant optic fissure fusion.
Pairwise condition testing revealed the highest number of significant DEG events between OF and DR at 32 hpf, anticipated by stark differences in tissue morphology between the unfused OF and the opposing DR at this time. Notably, many of the genes differentially expressed between OF and DR tissue at 48 hpf, were also differentially expressed at 56 hpf, indicating a level of homogeneity in gene expression in OF once the margins of the fissure have opposed at 48 hpf. Overrepresentation and hierarchical cluster analysis of pairwise condition test data, facilitated the enrichment of known biological functions, interactions and pathways, providing biological insight to the data. For example, optic fissure morphogenesis involves a complex series of dynamic tissue rearrangements at the ventral side of the optic cup and optic stalk; the margins of the fissure grow and fuse to form a seamless conduit through which the POM and hyaloid vasculature enters the eye. This spectrum of cellular events is sensitive to genetic perturbation. A high degree of concordance in gene expression intensities between RNA-seq and qRT-PCR, as indicated by Spearman’s correlation coefficient indicated that, for most genes, our RNA-seq data provides a highly reliable estimate of gene expression levels during optic fissure closure.
Importantly, our RNA-sequencing data provided information on the expression of a number of known or putative ocular patterning, optic fissure fusion and/or ocular coloboma-causing genes. Using time-course analysis to define dynamic changes in global gene expression over time allowed the prioritisation of highly significant DEG events between OF and DR for further functional investigation.
Netrins are secreted proteins that mediate cell migration, cell-cell interactions and cell-extracellular matrix adhesion34 and may therefore govern the morphogenetic movements that lead to optic fissure fusion. Zebrafish ntn1a expression has been described in the cells that flank the zebrafish optic fissure at 32–36 hpf35 and ntn1a expression is reduced at the optic fissure of coloboma pax2a (noi) mutants36. During ocular development, ntn1a has been shown to mediate retinal ganglion cell axonal pathfinding and angiogenesis at the optic disc37 however, its role in optic fissure fusion has not been described. Here, we show that during wild-type ocular development, ntn1a expression is lost at the optic fissure margin prior to fusion and that morpholino-mediated depletion of ntn1a leads to ocular coloboma, confirming its role as a novel mediator of optic fissure fusion and validating our systematic approach to RNA-sequencing data analysis and candidate gene prioritisation. The corresponding down-regulation of atoh7, a modulator of ganglion cell differentiation, confirms the functional loss of ntn1a, a known stimulator of axonal outgrowth.
The gene fam132a, also known as c1qtnf12 (C1q and TNF related 12, CTRP12) has no previous expression data contained in the ZFIN database. As a significant DEG event we chose fam132a for translation-blocking morpholino knockdown. No altered phenotype was observed at the time points, compared to wild-type zebrafish. The C1QTNF gene family has many members, each encompassing a complement component C1q domain. This is a globular domain which forms a trimer as the basic unit, but also potentially assembles into higher multimeric structures38,39. Although no identified paralogues of fam132a are present in the GRCz10 genome build, we isolated a sequence termed si:ch1073-184j22.1 through amino acid conservation with the mammalian fam132b sequence. Due to the nature of the C1QTNF gene family, functional compensation by redundant genes may prevent a phenotype being observed or this allele may not be fully disruptive to protein function.
Further work is required to elucidate the function of other significant DEG events and their interactors identified via the time-course analysis, specifically, gene clusters showing precise expression across the dorsoventral axis of the developing retina, which are likely relevant during this developmental process. This will contribute to our understanding of unknown cell behaviours central to optic fissure morphogenesis.
Conclusion
Our study represents the first detailed temporal analysis of the zebrafish optic fissure transcriptome. We have discussed characteristic biological signatures inferred from overrepresentation analysis of DEG events and highlighted ntn1a as a novel mediator required for optic fissure fusion. This data not only informs the molecular basis of optic fissure fusion but will contribute to the validation of genetic variants discovered in human patients, the elucidation of pathological pathways, and the development of novel therapeutics for ocular coloboma.
Materials and Methods (see Supplementary Information for detailed methods)
Zebrafish husbandry
Zebrafish (wild-type, AB-strain [wt]) were bred and maintained according to local UCL and UK Home Office regulations for the care and use of laboratory animals under the Animals Scientific Procedures Act at the UCL Institute of Ophthalmology animal facility. UCL Animal Welfare and Ethical Review Body approved all procedures for experimental protocols, in addition to the UK Home Office (License no. PPL PC916FDE7). All approved standard protocols followed the guidelines of the ARVO Statement for the Use of Animals in Ophthalmic and Vision Research Ethics40,41.
RNA collection and sequencing
Optic fissure and opposing dorsal retinal tissue was dissected from 5 biological replicates at 32 hpf, 48 hpf and 56 hpf. RNA was extracted using the RNeasy FFPE Kit (Qiagen) and quantified using the Bioanalyzer 2100 RNA Pico system (Agilent biosystems). cDNA libraries were constructed from total RNA (RIN ≥ 8) using the Clontech SMART-Seq v4 Ultra Low Input RNA Kit for Sequencing (Clontech) and sequenced on a HiSeq 2500 system using v4 chemistry (Illumina). Paired-end sequences of 100 bp were generated.
RNA-seq data analysis
The FASTQ files were assessed for quality control using FASTQC (v0.11.5). Adapter sequences were removed using Trimgalore (v0.4.3). Reads were aligned to the Ensembl D. rerio reference genome (build GRCz10). Counts were summarised using HTSeq (v0.6.1) after read duplicates were marked using Picard tools. Differential expression analysis including successive pairwise condition testing and likelihood ratio tests (LRT) was performed using DESeq2 (v1.18.1). DEGs were subjected to GO enrichment analysis using the Bioconductor R package GOseq (v1.32.0), Gorilla42 and WebGestalt43.
Quantitative RT-PCR and in situ hybridisation
RT-qPCR was performed on the StepOnePlus Real-Time PCR system (Applied Biosystems) using SYBR Select Master Mix (Applied biosystems). mRNA levels were measured in triplicate and normalised to znf644a and g6pd (Primer sequences are detailed in Table S4). RNAscope in situ hybridisation was performed as per the manufacturer’s protocol. Slides were mounted in Prolong Gold Antifade mountant (Life Technologies) and imaged using a Leica LSM 700 confocal microscope.
Morpholino injections
25-mer morpholinos (MOs; Gene Tools, LLC Philomath, Oregon) were designed to target the ATG translation start site for both the ntn1a and fam132a mRNA transcripts. One cell stage embryos were co-injected with 10 nl of 5 pg of GFP mRNA and 2.5 pmol of ntn1a, fam132a or control morpholino. Morpholino sequences: ntn1a (5′ CAT CAG AGA CTC TCA ACA TCC TCG C 3′), fam132a (5′ CAG CTA GTA CCC AGC AAC GCA TCT T 3′), and control (TGT TGA AAT CAG CGT GTT CAA G).
Supplementary information
Acknowledgements
We gratefully acknowledge funding from the Wellcome Trust 205174/Z/16/Z (NO, MM), Moorfields Eye Charity (RR, MM), and BIPOSA Research Award (MM). The funders had no role in study design, data collection and analysis, decision to publish, or preparation of the manuscript. We also acknowledge the support of the UCL Computer Science High Performance Cluster team for providing us with the platform for data analysis.
Author Contributions
M.M. acquired funding. M.M. and R.R. devised experiments. R.R., M.T., D.T.W. and R.M.Y. carried out experiments. N.O. carried out bioinformatics analysis. R.R., N.O. and M.M. wrote the manuscript. All authors reviewed the manuscript.
Data Availability
All data generated or analysed during this study are included in this published article (and its Supplementary Information files).
Competing Interests
The authors declare no competing interests.
Footnotes
Publisher’s note: Springer Nature remains neutral with regard to jurisdictional claims in published maps and institutional affiliations.
Electronic supplementary material
Supplementary information accompanies this paper at 10.1038/s41598-018-38379-5.
References
- 1.Ray HJ, Niswander L. Mechanisms of tissue fusion during development. Development. 2012;139:1701–1711. doi: 10.1242/dev.068338. [DOI] [PMC free article] [PubMed] [Google Scholar]
- 2.Barishak YR. Embryology of the eye and its adnexae. Dev Ophthalmol. 1992;24:1–142. doi: 10.1159/000429697. [DOI] [PubMed] [Google Scholar]
- 3.Fuhrmann S. Eye morphogenesis and patterning of the optic vesicle. Curr Top Dev Biol. 2010;93:61–84. doi: 10.1016/b978-0-12-385044-7.00003-5. [DOI] [PMC free article] [PubMed] [Google Scholar]
- 4.Martinez-Morales JR, Wittbrodt J. Shaping the vertebrate eye. Curr Opin Genet Dev. 2009;19:511–517. doi: 10.1016/j.gde.2009.08.003. [DOI] [PubMed] [Google Scholar]
- 5.James A, et al. The hyaloid vasculature facilitates basement membrane breakdown during choroid fissure closure in the zebrafish eye. Developmental Biology. 2016;419:262–272. doi: 10.1016/j.ydbio.2016.09.008. [DOI] [PMC free article] [PubMed] [Google Scholar]
- 6.Hartsock A, Lee C, Arnold V, Gross JM. In vivo analysis of hyaloid vasculature morphogenesis in zebrafish: A role for the lens in maturation and maintenance of the hyaloid. Dev Biol. 2014;394:327–339. doi: 10.1016/j.ydbio.2014.07.024. [DOI] [PMC free article] [PubMed] [Google Scholar]
- 7.Gage PJ, Rhoades W, Prucka SK, Hjalt T. Fate maps of neural crest and mesoderm in the mammalian eye. Invest Ophthalmol Vis Sci. 2005;46:4200–4208. doi: 10.1167/iovs.05-0691. [DOI] [PubMed] [Google Scholar]
- 8.Onwochei BC, Simon JW, Bateman JB, Couture KC, Mir E. Ocular colobomata. Surv Ophthalmol. 2000;45:175–194. doi: 10.1016/S0039-6257(00)00151-X. [DOI] [PubMed] [Google Scholar]
- 9.Shah SP, et al. Anophthalmos, microphthalmos, and typical coloboma in the United Kingdom: a prospective study of incidence and risk. Invest Ophthalmol Vis Sci. 2011;52:558–564. doi: 10.1167/iovs.10-5263. [DOI] [PubMed] [Google Scholar]
- 10.Fujiki K, Nakajima A, Yasuda N, Tanabe U, Kabasawa K. Genetic analysis of microphthalmos. Ophthalmic Paediatrics and Genetics. 1982;1:139–149. doi: 10.3109/13816818209031458. [DOI] [Google Scholar]
- 11.Verma AS, FitzPatrick DR. Anophthalmia and microphthalmia. Orphanet Journal of Rare Diseases. 2007;2:47. doi: 10.1186/1750-1172-2-47. [DOI] [PMC free article] [PubMed] [Google Scholar]
- 12.Williamson KA, FitzPatrick DR. The genetic architecture of microphthalmia, anophthalmia and coloboma. Eur J Med Genet. 2014;57:369–380. doi: 10.1016/j.ejmg.2014.05.002. [DOI] [PubMed] [Google Scholar]
- 13.Moosajee M, Gregory-Evans CY. Advances in the molecular genetics of ocular coloboma. Expert Review of Ophthalmology. 2006;1:209–227. doi: 10.1586/17469899.1.2.209. [DOI] [Google Scholar]
- 14.Richardson R, Tracey-White D, Webster A, Moosajee M. The zebrafish eye-a paradigm for investigating human ocular genetics. Eye (Lond) 2017;31:68–86. doi: 10.1038/eye.2016.198. [DOI] [PMC free article] [PubMed] [Google Scholar]
- 15.Schmitt EA, Dowling JE. Early eye morphogenesis in the zebrafish, Brachydanio rerio. J Comp Neurol. 1994;344:532–542. doi: 10.1002/cne.903440404. [DOI] [PubMed] [Google Scholar]
- 16.Hocking JC, et al. Morphogenetic defects underlie Superior Coloboma, a newly identified closure disorder of the dorsal eye. PLOS Genetics. 2018;14:e1007246. doi: 10.1371/journal.pgen.1007246. [DOI] [PMC free article] [PubMed] [Google Scholar]
- 17.Barbieri AM, et al. Vax2 inactivation in mouse determines alteration of the eye dorsal-ventral axis, misrouting of the optic fibres and eye coloboma. Development. 2002;129:805–813. doi: 10.1242/dev.129.3.805. [DOI] [PubMed] [Google Scholar]
- 18.Holly VL, Widen SA, Famulski JK, Waskiewicz AJ. Sfrp1a and Sfrp5 function as positive regulators of Wnt and BMP signaling during early retinal development. Dev Biol. 2014;388:192–204. doi: 10.1016/j.ydbio.2014.01.012. [DOI] [PubMed] [Google Scholar]
- 19.Stacher Horndli C, Chien CB. Sonic hedgehog is indirectly required for intraretinal axon pathfinding by regulating chemokine expression in the optic stalk. Development. 2012;139:2604–2613. doi: 10.1242/dev.077594. [DOI] [PMC free article] [PubMed] [Google Scholar]
- 20.Tuazon FB, Mullins MC. Temporally coordinated signals progressively pattern the anteroposterior and dorsoventral body axes. Semin Cell Dev Biol. 2015;42:118–133. doi: 10.1016/j.semcdb.2015.06.003. [DOI] [PMC free article] [PubMed] [Google Scholar]
- 21.Zhou C-J, et al. Ocular Coloboma and Dorsoventral Neuroretinal Patterning Defects in Lrp6 Mutant Eyes. Developmental dynamics: an official publication of the American Association of Anatomists. 2008;237:3681–3689. doi: 10.1002/dvdy.21770. [DOI] [PMC free article] [PubMed] [Google Scholar]
- 22.Hero I. Optic fissure closure in the normal cinnamon mouse. An ultrastructural study. Invest Ophthalmol Vis Sci. 1990;31:197–216. [PubMed] [Google Scholar]
- 23.Chow RL, Lang RA. Early eye development in vertebrates. Annu Rev Cell Dev Biol. 2001;17:255–296. doi: 10.1146/annurev.cellbio.17.1.255. [DOI] [PubMed] [Google Scholar]
- 24.Gestri, G., Bazin-Lopez, N., Scholes, C. & Wilson, S. W. Cell Behaviors during Closure of the Choroid Fissure in the Developing Eye. Frontiers in Cellular Neuroscience12, 10.3389/fncel.2018.00042 (2018). [DOI] [PMC free article] [PubMed]
- 25.Cao M, Ouyang J, Guo J, Lin S, Chen S. Metalloproteinase Adamts16 Is Required for Proper Closure of the Optic Fissure. Investigative Ophthalmology & Visual Science. 2018;59:1167–1177. doi: 10.1167/iovs.17-22827. [DOI] [PubMed] [Google Scholar]
- 26.Xu L, Overbeek PA, Reneker LW. Systematic analysis of E-, N- and P-cadherin expression in mouse eye development. Exp Eye Res. 2002;74:753–760. doi: 10.1006/exer.2002.1175. [DOI] [PubMed] [Google Scholar]
- 27.Baum B, Georgiou M. Dynamics of adherens junctions in epithelial establishment, maintenance, and remodeling. J Cell Biol. 2011;192:907–917. doi: 10.1083/jcb.201009141. [DOI] [PMC free article] [PubMed] [Google Scholar]
- 28.Harris TJ, Tepass U. Adherens junctions: from molecules to morphogenesis. Nat Rev Mol Cell Biol. 2010;11:502–514. doi: 10.1038/nrm2927. [DOI] [PubMed] [Google Scholar]
- 29.Burrill JD, Easter SS., Jr. The first retinal axons and their microenvironment in zebrafish: cryptic pioneers and the pretract. J Neurosci. 1995;15:2935–2947. doi: 10.1523/JNEUROSCI.15-04-02935.1995. [DOI] [PMC free article] [PubMed] [Google Scholar]
- 30.French CR, Erickson T, French DV, Pilgrim DB, Waskiewicz AJ. Gdf6a is required for the initiation of dorsal–ventral retinal patterning and lens development. Developmental Biology. 2009;333:37–47. doi: 10.1016/j.ydbio.2009.06.018. [DOI] [PubMed] [Google Scholar]
- 31.Take-uchi M, Clarke JD, Wilson SW. Hedgehog signalling maintains the optic stalk-retinal interface through the regulation of Vax gene activity. Development. 2003;130:955–968. doi: 10.1242/dev.00305. [DOI] [PubMed] [Google Scholar]
- 32.French CR, Stach TR, March LD, Lehmann OJ, Waskiewicz AJ. Apoptotic and proliferative defects characterize ocular development in a microphthalmic BMP model. Invest Ophthalmol Vis Sci. 2013;54:4636–4647. doi: 10.1167/iovs.13-11674. [DOI] [PubMed] [Google Scholar]
- 33.Brzezinski JAT, Prasov L, Glaser T. Math5 defines the ganglion cell competence state in a subpopulation of retinal progenitor cells exiting the cell cycle. Dev Biol. 2012;365:395–413. doi: 10.1016/j.ydbio.2012.03.006. [DOI] [PMC free article] [PubMed] [Google Scholar]
- 34.Sun KLW, Correia JP, Kennedy TE. Netrins: versatile extracellular cues with diverse functions. Development. 2011;138:2153–2169. doi: 10.1242/dev.044529. [DOI] [PubMed] [Google Scholar]
- 35.Lupo G, et al. Retinoic acid receptor signaling regulates choroid fissure closure through independent mechanisms in the ventral optic cup and periocular mesenchyme. Proc Natl Acad Sci USA. 2011;108:8698–8703. doi: 10.1073/pnas.1103802108. [DOI] [PMC free article] [PubMed] [Google Scholar]
- 36.Macdonald R, et al. The Pax protein Noi is required for commissural axon pathway formation in the rostral forebrain. Development. 1997;124:2397–2408. doi: 10.1242/dev.124.12.2397. [DOI] [PubMed] [Google Scholar]
- 37.Deiner MS, et al. Netrin-1 and DCC mediate axon guidance locally at the optic disc: loss of function leads to optic nerve hypoplasia. Neuron. 1997;19:575–589. doi: 10.1016/S0896-6273(00)80373-6. [DOI] [PubMed] [Google Scholar]
- 38.Wong GW, et al. Identification and characterization of CTRP9, a novel secreted glycoprotein, from adipose tissue that reduces serum glucose in mice and forms heterotrimers with adiponectin. Faseb j. 2009;23:241–258. doi: 10.1096/fj.08-114991. [DOI] [PMC free article] [PubMed] [Google Scholar]
- 39.Wong GW, et al. Molecular, biochemical and functional characterizations of C1q/TNF family members: adipose-tissue-selective expression patterns, regulation by PPAR-gamma agonist, cysteine-mediated oligomerizations, combinatorial associations and metabolic functions. Biochem J. 2008;416:161–177. doi: 10.1042/bj20081240. [DOI] [PMC free article] [PubMed] [Google Scholar]
- 40.Westerfield, M. The Zebrafish Book: A Guide for the Laboratory Use of Zebrafish (Danio Rerio). (Institute of Neuroscience. University of Oregon, 2000).
- 41.Kimmel CB, Ballard WW, Kimmel SR, Ullmann B, Schilling TF. Stages of embryonic development of the zebrafish. Dev Dyn. 1995;203:253–310. doi: 10.1002/aja.1002030302. [DOI] [PubMed] [Google Scholar]
- 42.Eden E, Navon R, Steinfeld I, Lipson D, Yakhini Z. GOrilla: a tool for discovery and visualization of enriched GO terms in ranked gene lists. BMC Bioinformatics. 2009;10:48. doi: 10.1186/1471-2105-10-48. [DOI] [PMC free article] [PubMed] [Google Scholar]
- 43.Wang J, Duncan D, Shi Z, Zhang B. WEB-based GEne SeT AnaLysis Toolkit (WebGestalt): update 2013. Nucleic Acids Res. 2013;41:W77–83. doi: 10.1093/nar/gkt439. [DOI] [PMC free article] [PubMed] [Google Scholar]
Associated Data
This section collects any data citations, data availability statements, or supplementary materials included in this article.
Supplementary Materials
Data Availability Statement
All data generated or analysed during this study are included in this published article (and its Supplementary Information files).


