Abstract
It is difficult to predict the pharmacokinetics and plasma concentration-time profiles of new chemical entities in humans based on animal data. Some pharmacokinetic parameters, such as clearance and volume of distribution, can be scaled allometrically from rodents, mammals, and nonhuman primates with good success. However, it is far more challenging to predict the oral pharmacokinetics of experimental drug candidates. In the present study, we used in situ estimates of intestinal permeability, obtained in silico and from rat, wild-type (WT), and humanized PepT1 (huPepT1) mice, to predict the systemic exposure of cefadroxil, an orally administered model compound, under a variety of conditions. Using the GastroPlus simulation software program (Simulations Plus, Lancaster, CA), we found that the Cmax and area under the plasma concentration-time curve from time zero to the last measurable concentration of cefadroxil were better predicted using intestinal permeability estimates (both segmental and jejunal) from huPepT1 than from WT mice, and that intestinal permeabilities based on in silico and rat estimates gave worse predictions. We also observed that accurate predictions were possible for cefadroxil during oral dose escalation (i.e., 5, 15, and 30 mg/kg cefadroxil), a drug-drug interaction study (i.e., 5 mg/kg oral cefadroxil plus 45 mg/kg oral cephalexin), and an oral multiple dose study [i.e., 500 mg (6.7 mg/kg) cefadroxil every 6 hours]. Finally, the greatest amount of cefadroxil was absorbed in duodenal and jejunal segments of the small intestine after a 5 mg/kg oral dose. Thus, by combining a humanized mouse model and in silico software, the present study offers a novel strategy for better translating preclinical pharmacokinetic data to oral drug exposure during first-in-human studies.
Introduction
The translation of animal pharmacokinetics and plasma concentration-time profiles to humans is critical for the safe and effective development of new chemical entities. Allometric scaling is a valuable approach in predicting, from preclinical studies, primary pharmacokinetic parameters of candidate drugs in humans such as clearance (CL) and the volume of distribution (Vd) (Tang and Mayersohn, 2006). However, other pharmacokinetic parameters, such as the absorption rate constant (Ka) and bioavailability (F) and related effects on the maximum plasma concentration (Cmax) and systemic exposure [area under the curve (AUC)] of candidate drugs, are more unpredictable. This unpredictability is due, in part, to species differences in intestinal physiology, along with differences among species in the quantity and quality of intestinal transporters and/or enzymes that impact systemic availability.
Oral drug absorption is a complex process, and as a result its predictive modeling and simulation continue to be a challenge in humans. Thus, several mechanistic approaches have emerged to better predict oral absorption and bioavailability (Huang et al., 2009), including quasiequilibrium models, steady-state models, and dynamic models, differing largely by their dependence on spatial and temporal variables. Dynamic models, developed and extended from the mid-1990s, include the compartmental absorption and transit model (Yu et al., 1996), Grass model (Grass, 1997), gastrointestinal transit absorption model (Sawamoto et al., 1997), advanced compartmental absorption and transit (ACAT) model (Yu and Amidon, 1999), and advanced dissolution, absorption, and metabolism model (Jamei et al., 2009). All of these models treat the gastrointestinal tract as a series of linked sequential compartments in which drug absorption occurs from each compartment as a function of time.
The ACAT model, as implemented in the Gastroplus software program (Simulations Plus, Lancaster, CA), takes into account physicochemical factors (e.g., pKa, solubility, and permeability), physiologic factors (e.g., gastric emptying, intestinal transit, and presystemic metabolism and transport), and formulation factors (e.g., dosage form and dose) in predicting oral drug absorption. In doing so, Gastroplus was successful in predicting the oral absorption profiles of several drugs in which transporters and/or enzymes were involved (Tubic et al., 2006; Bolger et al., 2009; Abuasal et al., 2012), as well as in predicting food effects (Henze et al., 2018), formulation effects (Cvijic et al., 2018), and drug-drug interactions (Pedersen et al., 2017; Chung and Kesisoglou, 2018). However, even though Gastroplus has a function for the optimization of select parameters, accuracy in predicting plasma concentration-time profiles of a drug is still limited by the quality of data that are parameterized into the program (as are other programs). In particular, one must rely on the fidelity of in silico estimates for some parameters such as intestinal permeability, or obtain these estimates experimentally from in vitro Caco-2 cells, parallel artificial membrane permeability assays, or in situ intestinal perfusions of mice or rats. The ability of intestinal permeability to predict oral bioavailability is made even more difficult by differences between species, regional differences along the length of the small and large intestines, and the presence and potential saturability of enzymes and transporters (Cao et al., 2006).
Membrane transporters have demonstrated an essential role in the absorption, distribution, metabolism, and excretion of many drugs, although sometimes they are accompanied by species differences in functional activity and specificity (Hu et al., 2012; Chu et al., 2013; Hu and Smith, 2016). To overcome these species differences, humanized mouse models were developed in which the human genomic DNA was introduced into mice lacking the target gene, thereby avoiding overlapping functional activities between the endogenous murine gene and the human transgene (Cheung and Gonzalez, 2008; Hu et al., 2014). For example, previous oral dose escalation studies by our group (Hu and Smith, 2016) demonstrated a linear AUC (or Cmax) relationship with cefadroxil dose in wild-type (WT) mice. However, in humanized PepT1 (huPepT1) mice as well as in human subjects (Garrigues et al., 1991), a nonlinear relationship was observed between the AUC (or Cmax) value and cefadroxil dose. In situ jejunal perfusions indicated that this species difference was due to the greater affinity (i.e., lower Km) of cefadroxil for human PepT1 compared with mouse PepT1, such that saturable intestinal absorption occurred in huPepT1 (and human subjects) but not WT mice. Humanized mouse models have also been generated to overcome species differences in drug metabolism, disposition, and regulation (Miksys et al., 2005; Ma et al., 2007; Cheung and Gonzalez, 2008; Patterson et al., 2008; Liu et al., 2015).
In the present study, we hypothesized that the in situ intestinal permeability of cefadroxil obtained from huPepT1 mice compared with in silico or rat values would better predict the in vivo plasma concentration-time profiles of cefadroxil in humans. This approach was successfully applied to the in vivo performance of cefadroxil in humans after oral dose escalation, an oral drug-drug interaction study, and multiple oral dosing.
Materials and Methods
Physicochemical Properties of Cefadroxil.
Details on the physicochemical properties of cefadroxil, including dose and dosage form information, are given in Table 1. The values provided are based on literature information, default values provided in GastroPlus version 9.5 (Simulations Plus), and ADMET Predictor version 8.5 (Simulations Plus).
TABLE 1.
Predicted physicochemical properties of cefadroxil
| Property | Cefadroxil | Source |
|---|---|---|
| Molecular formula | C16H17N3O5S | |
| Molecular weight | 363.39 | |
| Predicted log P (neutral) | −2.08 | ADMET Predictor version 8.5 |
| pK1a | 2.55 | Shalaeva et al. (2008) |
| pK2a | 7.21 | Shalaeva et al. (2008) |
| pK3a | 9.71 | Shalaeva et al. (2008) |
| Aqueous solubility | 2.68 mg/ml (pH 5.13) | ADMET Predictor version 8.5 |
| Diffusion coefficient | 0.72 × 10⁻⁵ cm2/s | ADMET Predictor version 8.5 |
| Mean precipitation time | 900 s | GastroPlus Default |
| Drug particle density | 1.2 g/ml | GastroPlus Default |
| Particle size (radius) | 25.0 μm | GastroPlus Default |
| Dosage form (human) | Solution | |
| Dose volume (human) | 250 ml |
In Vivo Pharmacokinetics of Intravenous Cefadroxil.
The plasma concentration-time profiles of cefadroxil in mice, following an 11 nmol/g (4 mg/kg) intravenous dose, were reported previously (Hu and Smith, 2016) and fit to a two-compartment body model using Phoenix WinNonlin version 8.0 (Certara USA, Inc., Princeton, NJ) and a weighing scheme of 1/y2. Other models (e.g., one- and three-compartment body models) were tested but were found less suitable as judged by Akaike’s information criterion. The goodness of fit was evaluated by r2, the S.E. of parameter estimates, and visual inspection of the residual plots. The total clearance and central volume of distribution values were then adjusted for humans using an allometric scaling approach (as described subsequently).
Intestinal Permeability of Cefadroxil.
The effective permeability (Peff) of cefadroxil in human intestine was unknown, and as a result four different methods were used to estimate this parameter. They included values based on: 1) in silico human Peff of 0.35 × 10⁻⁴ cm/s (ADMET Predictor); 2) rat Peff of 0.75 × 10⁻⁴ cm/s (Caldwell et al., 2004); 3) WT mouse Peff; and 4) huPepT1 mouse Peff (Hu and Smith, 2016). The rodent values were then adjusted for humans using an allometric scaling approach (as described subsequently).
Allometric Scaling.
The predicted values of cefadroxil CL and Vd were estimated in human subjects by eq. 1 (Santella and Henness, 1982; Ito and Houston, 2005; Hosea et al., 2009) and eq. 2 (Huh et al., 2011; Sanoh et al., 2015):
| (1) |
| (2) |
where BW is the body weight of human (70 kg) and rodent (0.25 kg for rat and 0.02 kg for mouse). The final estimates for CL and Vd are listed in Table 2.
TABLE 2.
Observed and allometric scaling of primary pharmacokinetic parameters of cefadroxil
Plasma concentration-time profiles were fit to a two-compartment disposition model in mice after an 11 nmol/g (4 mg/kg) intravenous bolus dose of cefadroxil (Hu and Smith, 2016). For the total plasma clearance, K10 = CL/V1. For the clearance between the central and peripheral compartments, CLD = CL12 = CL21, K12 = CL12/V1, and K21 = CL21/V2.
| Parameter |
Mouse (Observed) |
CV |
Mouse (Optimized) |
Error |
Human (Predicted) |
|---|---|---|---|---|---|
| % | % | ||||
| CL (l/h per kilogram) | 0.92 | 10.5 | 0.88 | -4.3 | 0.079 |
| CLD (l/h per kilogram) | 0.38 | 29.8 | 0.041 | ||
| V1 (l/kg) | 0.18 | 20.6 | 0.16 | -15.5 | 0.063 |
| V2 (l/kg) | 0.31 | 42.9 | 0.122 |
CLD, clearance between the central and peripheral compartments; V1, volume of distribution in the central compartment; V2, volume of distribution in the peripheral compartment.
Given that the absorption rate constant (Ka) = 2 × Peff/R (Yu et al., 1996; Yang and Smith, 2017) and assuming that the absorption rate constant was the same between human subjects and huPepT1 mice (i.e., Ka.human = Ka.huPepT1), the predicted Peff in human subjects (Peff.human) was estimated as
| (3) |
where R is the intestinal radius. Here, the jejunal Peff of cefadroxil was obtained using the method presented in the Supplemental Material (see Supplemental Fig. 1; Supplemental Table 1), with the Peff values in other regions of the mouse intestines estimated accordingly (see Supplemental Table 2). The results were then scaled allometrically to human subjects (Table 3).
TABLE 3.
Allometric scaling of cefadroxil Peff to humans when estimated by the in situ permeability of small and large intestines from WT and humanized PepT1 mice
Intestinal segments include duodenum, jejunum, ileum, and ascending colon. The Peff values of cefadroxil in humans were predicted after single oral doses of 5, 15, and 30 mg/kg, after 500 mg (6.7 mg/kg) oral doses every 6 hours, and after the drug-drug interaction of 5 mg/kg cefadroxil plus 45 mg/kg cephalexin. The intestinal permeability (Peff) is in units of centimeter/second (×10−4). The method for obtaining these values is described in the Supplemental Material.
| Segment | 5 mg/kg Dose |
15 mg/kg Dose |
30 mg/kg Dose |
500 mg (6.7 mg/kg) Dose |
CEF + CEP Dose (hu) | ||||
|---|---|---|---|---|---|---|---|---|---|
| WT | hu | WT | hu | WT | hu | WT | hu | ||
| Stomach | 0.00 | 0.00 | 0.00 | 0.00 | 0.00 | 0.00 | 0.00 | 0.00 | 0.00 |
| Duo | 3.95 | 1.69 | 2.19 | 0.96 | 1.40 | 0.58 | 3.46 | 1.49 | 0.35 |
| Jej 1 | 4.48 | 1.24 | 2.49 | 0.70 | 1.58 | 0.42 | 3.93 | 1.09 | 0.26 |
| Jej 2 | 4.32 | 1.19 | 2.40 | 0.68 | 1.53 | 0.41 | 3.78 | 1.05 | 0.25 |
| Ile 1 | 1.95 | 0.80 | 1.08 | 0.45 | 0.69 | 0.27 | 1.71 | 0.71 | 0.17 |
| Ile 2 | 1.86 | 0.76 | 1.03 | 0.43 | 0.66 | 0.26 | 1.63 | 0.67 | 0.16 |
| Ile 3 | 1.73 | 0.71 | 0.96 | 0.40 | 0.61 | 0.24 | 1.52 | 0.63 | 0.15 |
| Cecum | 0.01 | 0.20 | 0.01 | 0.11 | 0.01 | 0.07 | 0.01 | 0.17 | 0.04 |
| Asc colon | 0.02 | 0.24 | 0.01 | 0.13 | 0.01 | 0.08 | 0.02 | 0.21 | 0.05 |
Asc, ascending; CEF, cefadroxil; CEP, cephalexin; Duo, duodenum; hu, humanized; Ile, ileum; Jej, jejunum.
Finally, in studies in which cefadroxil was coadministered with cephalexin (CEP), a PepT1 inhibitor, the predicted Peff in human subjects [Peff.human + CEP] was estimated as
| (4) |
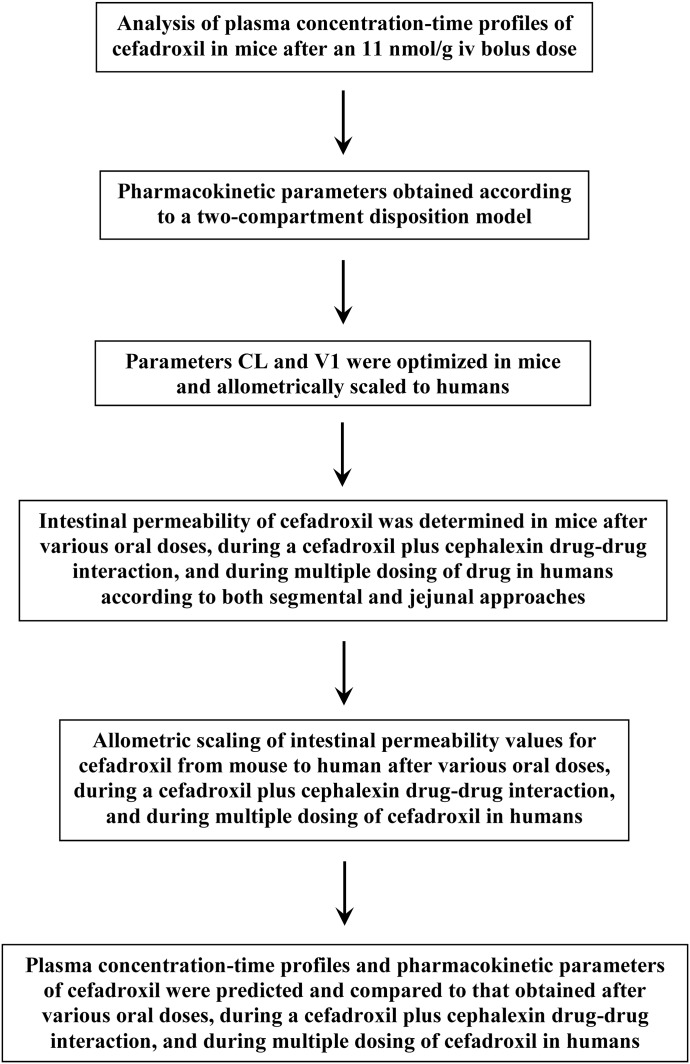
Here, the Peff value of cefadroxil was obtained during in situ jejunal perfusions of huPepT1 mice when coperfused with 10 mM cephalexin (Hu and Smith, 2016). The Peff values in other regions of the mouse intestines were then estimated accordingly (see Supplemental Material and Supplemental Table 2), and scaled allometrically to human subjects (Table 3). A flowchart outlining our overall approach is shown in Fig. 1.
Fig. 1.
Schematic strategy of the simulations.
Parameter Sensitivity Analysis.
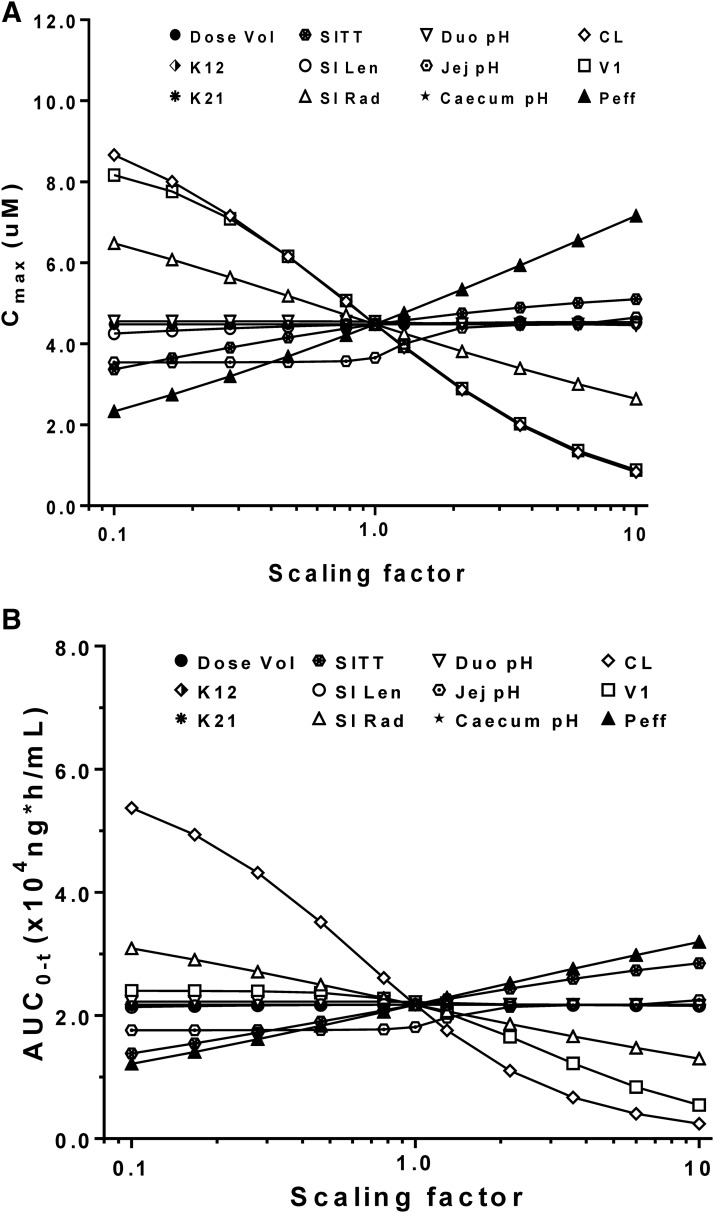
Accurate input parameters are crucial for obtaining meaningful predictions of the oral performance of cefadroxil using the ACAT model. Therefore, several physiologic (i.e., intestinal transit time, length, radius, pH, permeability, and fluid volume) and pharmacokinetic (i.e., clearances and volumes of distribution) properties of cefadroxil were examined to determine which parameters, if any, might most influence the in silico predictions. Specifically, the effect of parameter sensitivity on the maximum plasma concentration (Cmax) and area under the plasma concentration-time curve from time zero to the last measurable concentration (AUC0–t) was determined for cefadroxil at a human dose of 5 mg/kg. Test factors used in the parameter sensitivity analysis were scaled by10-fold in each direction.
In Silico Predictions of Oral Cefadroxil Performance.
All simulations for the plasma concentration-time profiles of cefadroxil were performed using the GastroPlus version 9.5 software program. The ACAT model conditions included “human-physical-fasted” and “Opt logD Model SA/V 6.1.” Input parameters produced by ADMET Predictor version 8.5 remained unchanged except for that of allometric scaling. Cefadroxil was administered as immediate release solution in 250 ml of water, regardless of dose. The oral plasma concentration-time data in humans were obtained from the literature after dose escalation of cefadroxil (5, 15, and 30 mg/kg) and during a drug-drug interaction study of 5 mg/kg cefadroxil + 45 mg/kg cephalexin (Garrigues et al., 1991), and from an oral multiple dose study of 500 mg (6.7 mg/kg) cefadroxil every 6 hours (Santella and Henness, 1982). Population estimates (i.e., mean, 90% confidence interval, and 95% probability) were also obtained from 25 bootstrap analyses and the predicted values compared with observed values in humans for Cmax and AUC0–t.
Results
Parameter Sensitivity Analysis.
As shown in Fig. 2A, the Cmax value of cefadroxil was most sensitive to changes in CL, central compartment volume of distribution, and Peff, followed by modest changes caused by small intestinal radius and little to no change by the other physiologic parameters. Figure 2B shows that cefadroxil AUC0–t is most sensitive to changes in CL, with modest changes caused by small intestinal radius, transit time, and Peff. Collectively, it appeared that intestinal permeability had the greatest effect on cefadroxil, in which intestinal permeability was positively correlated with drug exposure, resulting in 3.5- and 3.0-fold changes in Cmax and AUC0–t, respectively, over a 100-fold range of Peff values.
Fig. 2.
Sensitivity of predicted Cmax (A) and AUC0–t (B) to input parameters after a human oral dose of 5 mg/kg cefadroxil. Parameters were changed by multiplying the initial input values by the scaling factors in the range of 0.1–10. K12 and K21 are the distribution rate constants between the central and peripheral comparments, respectively, and V1 is the volume of distribution for the central compartment. Duo, duodenum; Jej, jejunum; Len, length; Rad, radius; SI, small intestine; SITT, small intestine transit time; Vol, volume.
Effect of Species-Dependent Intestinal Permeability on Predicting the Systemic Oral Exposure of Cefadroxil in Human Subjects.
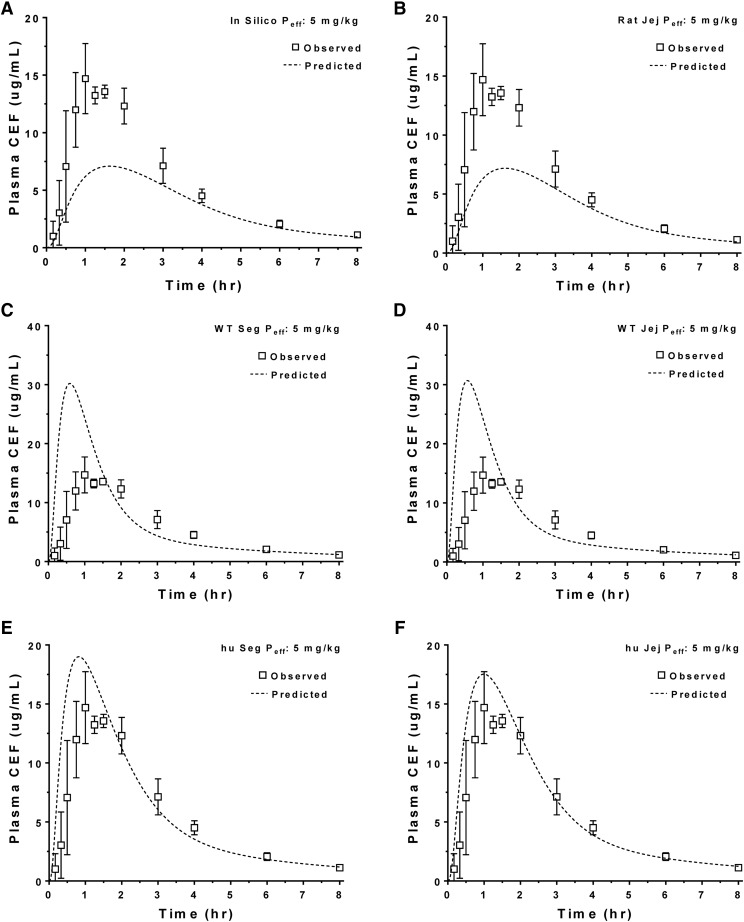
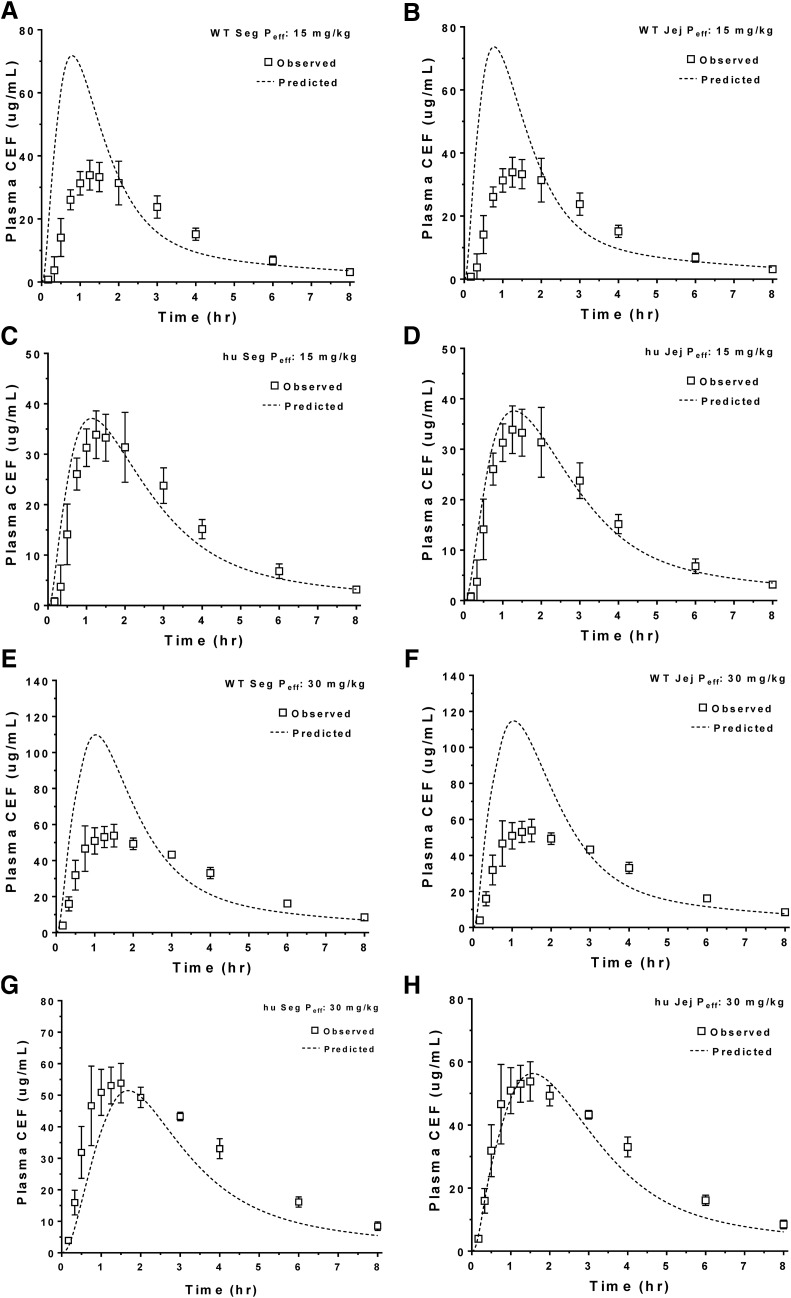
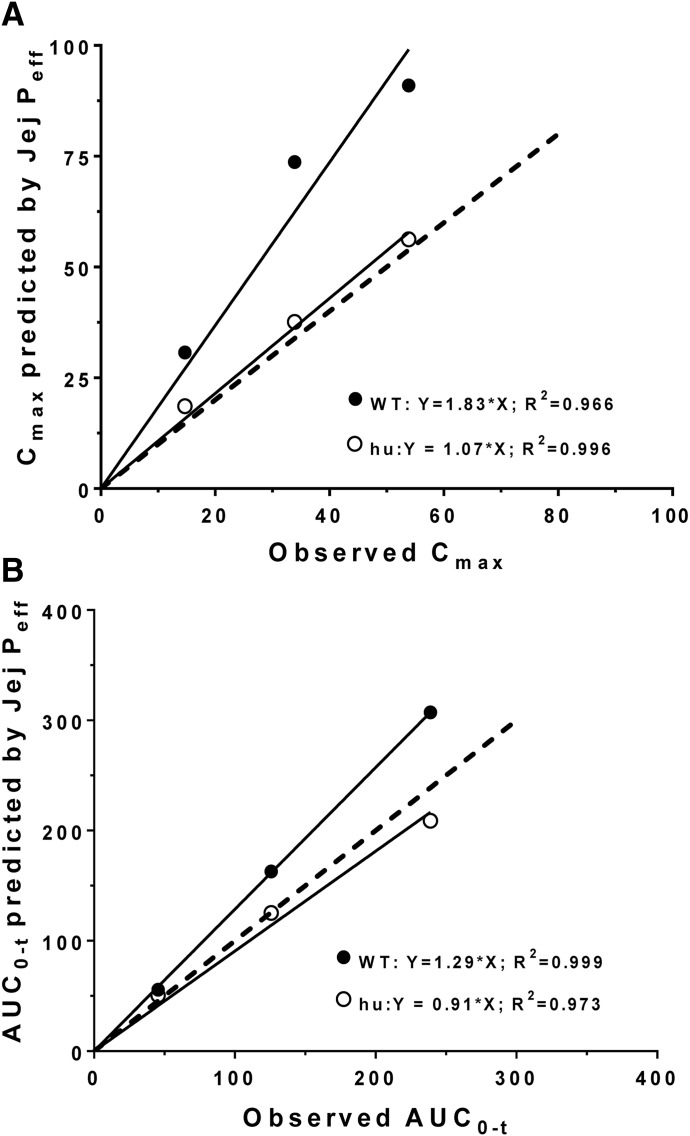
The predicted plasma concentration-time profiles of cefadroxil in human subjects were generated using in silico estimates of intestinal Peff, rat Peff (jejunal), WT mouse Peff (jejunal vs. segmental), and huPepT1 mouse Peff (jejunal vs. segmental) at an oral cefadroxil dose of 5 mg/kg. As shown in Fig. 3, A and B, the predicted plasma concentrations of cefadroxil were substantially lower than those observed in humans when using in silico and rat Peff estimates, respectively. In fact, the percentages of error of predicted versus observed values were on the order of 51% for Cmax and 37% for AUC0–t when using these two approaches (Table 4). Although Peff estimates from WT mice (segmental and jejunum) also poorly predicted the plasma concentration-time profiles of cefadroxil (Fig. 3, C and D, respectively), much better predictions were observed when Peff estimates from huPepT1 mice (jejunal and segmental) were applied, in which the percentages of error were about 28% for Cmax and 10% AUC0–t (Fig. 3, E and F, respectively). Based on these results, mouse Peff was further analyzed after oral cefadroxil doses of 15 and 30 mg/kg. As shown in Fig. 4 and Table 4, the Peff values from huPepT1 mice continued to provide substantially better predictions of cefadroxil system exposure than from WT mice, for both of the higher dose levels. In fact, the correlation between observed and predicted Cmax (Fig. 5A) and AUC0–t (Fig. 5B) of cefadroxil at the 5, 15, and 30 mg/kg oral doses was more congruent when Peff was based on huPepT1 compared with WT mice.
Fig. 3.
Model predicted plasma concentration-time profiles of cefadroxil (CEF) after a human oral dose of 5 mg/kg using permeability estimates (Peff) obtained in silico (A), and from rats (B) and WT (C and D) and humanized (E and F) mice. Both segmental (Seg) and jejunal (Jej) approaches were applied in mice. Human data were obtained from the literature (Garrigues et al., 1991); hu, humanized PepT1 mice.
TABLE 4.
Comparison of predicted and observed pharmacokinetic parameters of cefadroxil in humans when estimated by in silico and allometric scaling methods of in situ intestinal permeability from WT and humanized PepT1 mice
The Peff values are based on the jejunal permeability and the segmental permeabilities of the duodenum, jejunum, ileum, and colon. The observed values were obtained from the literature (Garrigues et al., 1991).
| Dose |
Peff Method |
Cmax (μg/ml) |
AUC0–t (μg⋅h/ml) |
||||
|---|---|---|---|---|---|---|---|
| Observed |
Predicted |
Error |
Observed |
Predicted |
Error |
||
| mg/kg | % | % | |||||
| 5 | In Silico | 14.7 | 7.1 | −51.7 | 45.5 | 28.4 | −37.5 |
| Rat Jej | 14.7 | 7.2 | −51.1 | 45.5 | 28.7 | −36.8 | |
| WT Seg | 14.7 | 30.2 | 106 | 45.5 | 55.1 | 21.1 | |
| WT Jej | 14.7 | 30.7 | 109 | 45.5 | 55.6 | 22.3 | |
| hu Seg | 14.7 | 19.1 | 29.8 | 45.5 | 49.2 | 8.3 | |
| hu Jej | 14.7 | 18.6 | 26.4 | 45.5 | 50.5 | 11.0 | |
| 15 | WT Seg | 33.9 | 71.8 | 112 | 126 | 158 | 25.4 |
| WT Jej | 33.9 | 73.7 | 117 | 126 | 163 | 29.5 | |
| hu Seg | 33.9 | 37.1 | 9.5 | 126 | 119 | −5.2 | |
| hu Jej | 33.9 | 37.6 | 10.9 | 126 | 125 | −0.4 | |
| 30 | WT Seg | 53.8 | 110 | 104 | 239 | 287 | 20.1 |
| WT Jej | 53.8 | 91.0 | 69.0 | 239 | 307 | 28.6 | |
| hu Seg | 53.8 | 53.0 | −1.5 | 239 | 196 | −17.8 | |
| hu Jej | 53.8 | 56.2 | 4.5 | 239 | 209 | −12.6 | |
hu, humanized; Jej, jejunum; Seg, segment.
Fig. 4.
Model predicted plasma concentration-time profiles of cefadroxil (CEF) after human oral doses of 15 and 30 mg/kg using permeability estimates (Peff) obtained from WT (A, B, E, and F) and humanized (C, D, G, and H) mice. Both segmental (Seg) and jejunal (Jej) approaches were applied. Human data were obtained from the literature (Garrigues et al., 1991); hu, humanized PepT1 mice.
Fig. 5.
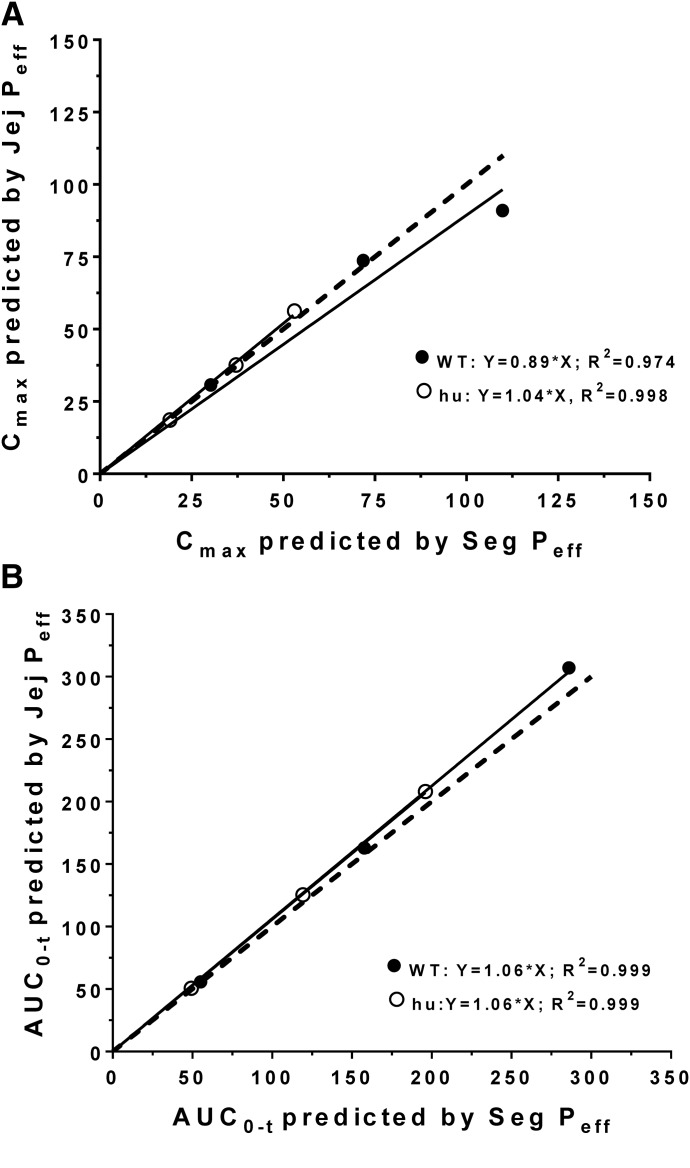
Correlation between the segmental (Seg Peff) and jejunal permeability (Jej Peff) estimates in predicting the Cmax (A) and AUC0–t (B) values of cefadroxil after human oral doses of 5, 15, and 30 mg/kg. The dashed line represents a slope of unity; hu, humanized PepT1 mice. Cmax has units of ug/ml and AUC0–t has units of ug*h/ml. Human data were obtained from the literature (Garrigues et al., 1991).
Comparison of Segmental versus Jejunal Permeability Approach on Predicting the Systemic Oral Exposure of Cefadroxil in Human Subjects.
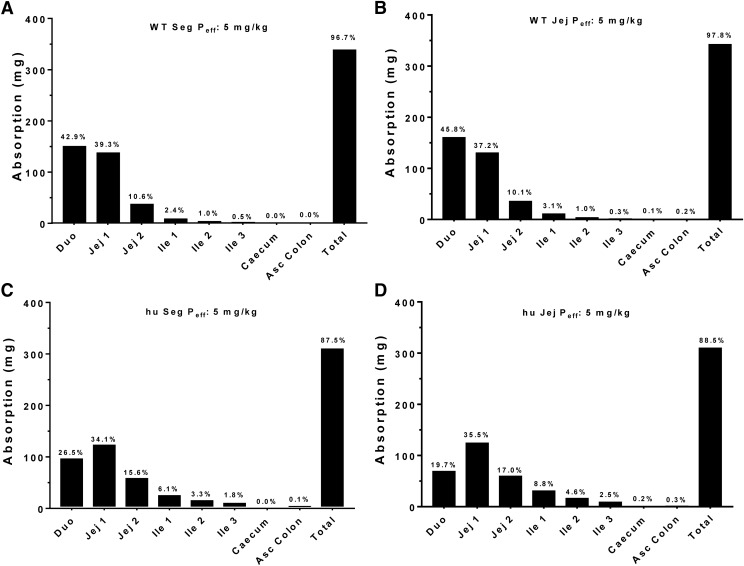
At the onset, it was unclear as to whether the plasma concentration-time profiles of cefadroxil would be better predicted by Peff values based on the jejunum alone or all segments of the small and large intestines (i.e., duodenum, jejunum, ileum, and colon). As a result, we performed simulations based on both approaches and found that neither approach had a clear advantage over the other in the dose range studied (Table 4). In fact, there was no difference between the segmental versus jejunal approach in predicting Cmax (Fig. 6A) or AUC0–t (Fig. 6B) for both WT and huPepT1 mice, as demonstrated by all slopes being within 10% of unity. This finding was consistent with the greatest amount of cefadroxil being absorbed from regions having similar Peff values, such as that observed in the duodenum and jejunum (Fig. 7).
Fig. 6.
Correlation between the observed and predicted Cmax (A) and AUC0–t (B) values of cefadroxil after human oral doses of 5, 15, and 30 mg/kg. The pharmacokinetic parameters were predicted using jejunal permeability (Jej Peff), as estimated from WT and humanized (hu) PepT1 mice. The dashed line represents a slope of unity. Cmax has units of ug/ml and AUC0–t has units of ug*h/ml.
Fig. 7.
Contribution of specific intestinal regions in the absorption of cefadroxil after a human oral dose of 5 mg/kg. Oral absorption was predicted using both segmental (Seg Peff) and jejunal (Jej Peff) permeability, as estimated from WT (A and B, respectively) and humanized (C and D, respectively) mice; hu, humanized PepT1 mice.
Population Analysis of the Drug-Drug Interaction Study for Cefadroxil ± Cephalexin in Human Subjects.
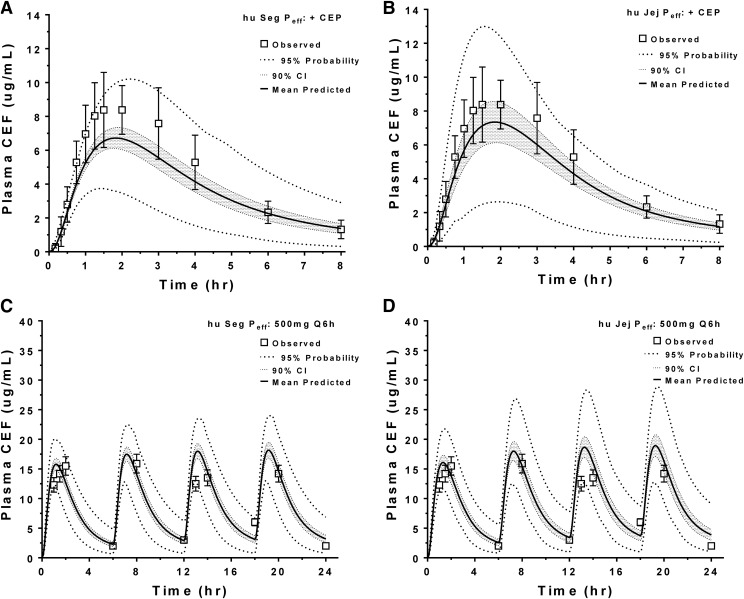
The huPepT1 Peff approach was further evaluated for its ability to predict the plasma concentration-time profiles of 5 mg/kg oral cefadroxil in human subjects when administered in the presence of 45 mg/kg oral cephalexin, a PepT1 inhibitor (Garrigues et al., 1991). As shown in Table 5, the percentage of error for Cmax and AUC0–t values of cefadroxil were <20% of that in human subjects when based on either the segmental or jejunal Peff approach; moreover, as shown in Fig. 8A (segmental) and Fig. 8B (jejunal), the 90% confidence intervals for the plasma concentration-time profiles of cefadroxil overlapped with most of the observed data in human subjects.
TABLE 5.
Population analysis for drug-drug interaction of 5 mg/kg cefadroxil plus 45 mg/kg cephalexin in human subjects when estimated by the intestinal permeability from huPepT1 mice
Observed values were obtained from the literature (Garrigues et al., 1991).
| Parameter |
Observed |
Segmental Peff |
Jejunal Peff |
||||
|---|---|---|---|---|---|---|---|
| Predicted |
CV |
Error |
Predicted |
CV |
Error |
||
| % | % | % | % | ||||
| Cmax (μg/ml) | 8.4 | 6.8 | 27.4 | −19.3 | 7.5 | 16.4 | −10.5 |
| AUC0–t (μg⋅h/ml) | 36.8 | 29.7 | 31.4 | −19.2 | 30.6 | 21.7 | −16.8 |
Fig. 8.
Population analysis of the predicted plasma concentration-time profiles of cefadroxil during a drug-drug interaction study of 5 mg/kg oral cefadroxil plus 45 mg/kg oral cephalexin (A and B) [human data were obtained from Garrigues et al. (1991)], and during a multiple dose study of 500 mg (6.7 mg/kg) cefadroxil administered orally every 6 hours (Q6h) [human data were obtained from Santella and Henness (1982)] (C and D). Analyses were performed using segmental (Seg Peff) and jejunal (Jej Peff) permeability, as estimated from humanized (hu) PepT1 mice. CEF, cefadroxil; CEP, cephalexin.
Population Analysis of the Plasma Concentration-Time Profiles for Cefadroxil in Human Subjects after Oral Multiple Dosing.
Since the therapeutic efficacy of cefadroxil (and most drugs in general) is assessed using steady-state plasma concentrations, the huPepT1 Peff approach was further evaluated for its ability to predict the plasma concentration-time profiles of cefadroxil in human subjects when administered 500 mg (6.7 mg/kg) orally every 6 hours for 24 hours (i.e., four doses) (Santella and Henness, 1982). As shown in Table 6, the percentages of error for the Cmax and AUC0–t values of cefadroxil were <23% and <5%, respectively, of that in human subjects when based on either the segmental or jejunal Peff approach. In addition, as shown in Fig. 8C (segmental) and Fig. 8D (jejunal), the 90% confidence intervals for the plasma concentration-time profiles of cefadroxil during multiple dose sampling appeared to overlap with most of the observed data in human subjects.
TABLE 6.
Population analysis for multiple dosing regimen of 500 mg (6.7 mg/kg) cefadroxil administered orally every 6 hours in human subjects when estimated by the intestinal permeability from huPepT1 mice
Observed values were obtained from the literature (Santella and Henness, 1982).
| Parameter |
Observed |
Segmental Peff |
Jejunal Peff |
||||
|---|---|---|---|---|---|---|---|
| Predicted |
CV |
Error |
Predicted |
CV |
Error |
||
| % | % | % | % | ||||
| Cmax (μg/ml) | 15.9 | 19.5 | 26.3 | 22.9 | 19.5 | 26.3 | 22.4 |
| AUC0–t (μg⋅h/ml) | 223 | 225 | 31.3 | −1.0 | 237 | 34.0 | 4.2 |
Discussion
Cefadroxil, a PepT1 substrate, is a first generation aminocephalosporin that has good patient compliance and a relatively broad spectrum of antibacterial activity (Pfeffer et al., 1977; Tanrisever and Santella, 1986). At equivalent oral doses, cefadroxil has greater drug exposure and a longer serum half-life compared with cephalexin and cephradine (Pfeffer et al., 1977). Importantly, cefadroxil is rapidly and almost completely absorbed following oral administration, with more than 90% of drug being excreted unchanged in the urine over 24 hours (Garrigues et al., 1991). However, because of the nonlinear absorption reported by these same authors for cefadroxil in humans, the drug’s maximum plasma concentration (Cmax) and systemic exposure (AUC) are more difficult to predict, in contrast to drugs that exhibit linear pharmacokinetics. Although cefadroxil is relatively safe with few severe adverse reactions (https://www.pdr.net/drug-summary/Cefadroxil-Tablets-cefadroxil-3008.2894), accurate predictions of Cmax and AUC are extremely valuable, in general, in determining efficacy and safety for first-in-man clinical trials, especially for those drugs that are administered orally (https://www.fda.gov/downloads/Drugs/Guidances/UCM078932.pdf%23search5%27guidekines1for1industry1sfe1starting%27).
CL and Vd have been successfully predicted in humans by interspecies allometric scaling (Mahmood, 1999, 2002; Mahmood et al., 2006; Martinez et al., 2006). However, it is still problematic to translate the absorption rate constant (Ka) and oral bioavailability (F) from preclinical studies to clinical trials (Musther et al., 2014), especially for drugs that have transporter-mediated intestinal uptake. Indeed, some investigators have attempted, but with limited success, to correlate rat and human jejunal permeabilities and then extend these correlations to fraction absorbed and oral bioavailability (Fagerholm et al., 1996; Cao et al., 2006). Although differences in carrier-mediated transport were noted in one study as a significant factor in reducing the confidence in predictions (Fagerholm et al., 1996), differences in presystemic drug metabolism were identified as a limiting factor in another study (Cao et al., 2006). Moreover, such comparisons are challenging because of disparities between relevant gene expression profiles obtained during in vitro and in vivo conditions (Sun et al., 2002) and differences between species in drug capacity (Vmax) and affinity (Km) of related transporters (Hu et al., 2012; Song et al., 2017).
Humanized mouse models have been developed in an attempt to improve the predictability of pharmacokinetics, metabolic contributions, drug toxicity, and receptor response when translating results from animals to human subjects (Katoh et al., 2004; Gonzalez and Yu, 2006; Scheer and Roland Wolf, 2013; Scheer and Wilson, 2016). In particular, our laboratory generated huPepT1 mice (Hu et al., 2014) and demonstrated that the correlation between systemic exposure (or Cmax) of cefadroxil with oral dose escalation in humans was more similar to that of huPepT1 mice compared with WT animals (Hu and Smith, 2016). This current study extended these results and addressed the ability of huPepT1 mouse intestinal permeability to predict the oral dose nonlinear pharmacokinetics of cefadroxil in humans without the need for using transport parameters (i.e., Vmax and Km) scaled for humans. In doing so, we made the following major observations: 1) the Cmax and AUC0–t values of cefadroxil were better predicted using intestinal permeability estimates (both segmental and jejunal) from huPepT1 than from WT mice; 2) intestinal permeabilities based on in silico and rat estimates gave worse predictions; 3) accurate predictions were possible for cefadroxil during oral dose escalation, a drug-drug interaction with cephalexin, and multiple oral dosing; and 4) the greatest amount of cefadroxil was absorbed in the duodenal and jejunal segments of the small intestine.
CL and central compartment volume of distribution showed the greatest effect on Cmax and AUC0–t (Fig. 2), and as a result these two parameters were optimized in our analysis (Table 2). The Peff value also showed a significant effect on the plasma concentration-time profile of orally administered cefadroxil, indicating that an accurate assessment of this parameter was essential for improved predictions (Fig. 2). Thus, significant effort was applied to ascertaining the best way to estimate intestinal permeability, first by comparing in silico and rodent estimates and then by comparing jejunal versus multiple intestinal segments.
It should be noted that the substitution of human PepT1 for mouse PepT1 had no effect on the total clearance (or renal clearance) of cefadroxil since this parameter did not differ between WT and huPepT1 mice after both low (i.e., 11 nmol/g or 4 mg/kg) and high (528 nmol/g or 192 mg/kg) intravenous bolus administrations of drug (Hu and Smith, 2016). Moreover, renal PepT1 plays a very minor role in the tubular reabsorption of cefadroxil in kidney, accounting for only 5% of this process compared with 95% being reabsorbed by PepT2 (Shen et al., 2007). Based on the volume of distribution steady state of cefadroxil, the drug would be restricted to extracellular fluid. Given Vd (extracellular fluid) = 7 + 8 ⋅ unbound fraction = 7 + 8 ⋅ 0.8, the volume of distribution steady state equals 13.4 l (the unbound fraction for cefadroxil is 0.8) (Shen et al., 2007). Based on a 75-kg human, the 0.185 l/kg value (the central compartment volume of distribution plus the volume of distribution in the peripheral compartment) (Table 2) equals 13.9 l.
There is scant information on the in vitro-in vivo extrapolation of scaling factors for intestinal transport proteins, especially with respect to kinetic data (e.g., Vmax and Km) describing the active uptake and oral absorption of transporter substrates or drugs. Literature-obtained relative expression factors (i.e., human protein expression divided by Caco-2 protein expression for a given transporter) have been reported to range from 0.4 to 5.1 for P-glycoprotein and from 1.1 to 90 for breast cancer resistance protein (Harwood et al., 2016). This variability, especially from different laboratories, has made it difficult to apply in vitro-in vivo extrapolation for successful pharmacokinetic outcomes in human subjects. This difficulty may be due to a variety of reasons, including in vitro accuracy and reproducibility of cell culture systems, culture conditions, inconsistent intestinal expression of transporters and expression quantification, and post-translational effects on transporter activity. As shown by Harwood et al. (2016), a 4.3-fold increase (optimization) in the Vmax value of P-glycoprotein was required to account for the drug-drug interaction between orally administered digoxin and rifampin in eight healthy volunteers. Because of the difficulty in scaling kinetic data such as Vmax, whether estimated in vitro from cell cultures or parallel artificial membrane permeability assays or in situ from single-pass intestinal perfusions, we elected to use a concentration-dependent permeability approach and to then allometrically scale the results from mouse to human based on intestinal radius.
During our analysis, we found that in silico rat and WT mouse estimates of jejunal permeability were inadequate predictors of cefadroxil oral pharmacokinetics (Figs. 3 and 4). However, segmental and jejunal estimates of huPepT1 mouse permeability both gave improved estimates of the plasma concentration-time profiles of orally administered cefadroxil (Figs. 3 and 4), the former approach being more physiologically correct. However, it may not make much of a difference in this specific case because the duodenal and jejunal permeabilities were similar for cefadroxil (Table 3), representing intestinal regions where most of the drug was predicted to be absorbed (Fig. 7). It was also observed, using huPepT1 mouse permeabilities (both segmental and jejunal), that the population predictions of oral cefadroxil pharmacokinetics were well characterized during a drug-drug interaction study with cephalexin (Fig. 8, A and B) and multiple oral dosing of cefadroxil (Fig. 8, C and D). Thus, our approach in applying concentration-dependent permeabilities based on huPepT1 mice gave improved predictions of oral cefadroxil pharmacokinetics (i.e., Cmax and AUC0–t) under nonlinear conditions and for a number of study designs. One caveat is that we assumed in our analyses that the absorption rate constant of cefadroxil was the same between human subjects and huPepT1 mice (i.e., Ka.human = Ka.huPepT1). We feel this is a reasonable assumption since valacyclovir, another PepT1 substrate therapeutic, had similar Ka values in humans (0.68 hour−1) and huPepT1 mice (0.86 hour−1) (Epling et al., 2018).
In summary, the current studies have demonstrated that simulation software (i.e., GastroPlus), in combination with intestinal permeability estimates from huPepT1 mice, can be used to predict the oral pharmacokinetic behavior of a therapeutic agent in humans without the need for artificial scaling of Vmax. Moreover, our approach was applied for the first time to the nonlinear intestinal absorption of a model PepT1 substrate, cefadroxil. This approach may have great practical value in the accurate prediction of the plasma concentration-time profiles during oral single and multiple dosing and for drug-drug interaction studies of new chemical entities in humans that are primarily absorbed in the intestines by PepT1. The possibility of extending this approach to compounds that are absorbed by other intestinal uptake and/or efflux transporters would have to be tested and validated experimentally.
Abbreviations
- ACAT
advanced compartmental absorption and transit
- AUC
area under the curve
- AUC0–t
area under the plasma concentration-time curve from time zero to the last measurable concentration
- BW
body weight
- CL
clearance
- CEP
cephalexin
- huPepT1
humanized PepT1
- Peff
effective permeability
- Vd
volume of distribution
- WT
wild-type
Authorship Contributions
Participated in research design: Hu, Smith.
Conducted experiments: Hu.
Performed data analysis: Hu.
Wrote or contributed to the writing of the manuscript: Hu, Smith.
Footnotes
This work was supported by the National Institutes of Health National Institute of General Medical Sciences [Grant R01-GM115481 to D.E.S.].
 This article has supplemental material available at dmd.aspetjournals.org.
References
- Abuasal BS, Bolger MB, Walker DK, Kaddoumi A. (2012) In silico modeling for the nonlinear absorption kinetics of UK-343,664: a P-gp and CYP3A4 substrate. Mol Pharm 9:492–504. [DOI] [PubMed] [Google Scholar]
- Bolger MB, Lukacova V, Woltosz WS. (2009) Simulations of the nonlinear dose dependence for substrates of influx and efflux transporters in the human intestine. AAPS J 11:353–363. [DOI] [PMC free article] [PubMed] [Google Scholar]
- Caldwell GW, Masucci JA, Yan Z, Hageman W. (2004) Allometric scaling of pharmacokinetic parameters in drug discovery: can human CL, Vss and t1/2 be predicted from in-vivo rat data? Eur J Drug Metab Pharmacokinet 29:133–143. [DOI] [PubMed] [Google Scholar]
- Cao X, Gibbs ST, Fang L, Miller HA, Landowski CP, Shin HC, Lennernas H, Zhong Y, Amidon GL, Yu LX, et al. (2006) Why is it challenging to predict intestinal drug absorption and oral bioavailability in human using rat model. Pharm Res 23:1675–1686. [DOI] [PubMed] [Google Scholar]
- Cheung C, Gonzalez FJ. (2008) Humanized mouse lines and their application for prediction of human drug metabolism and toxicological risk assessment. J Pharmacol Exp Ther 327:288–299. [DOI] [PMC free article] [PubMed] [Google Scholar]
- Chu X, Bleasby K, Evers R. (2013) Species differences in drug transporters and implications for translating preclinical findings to humans. Expert Opin Drug Metab Toxicol 9:237–252. [DOI] [PubMed] [Google Scholar]
- Chung J, Kesisoglou F. (2018) Physiologically based oral absorption modelling to study gut-level drug interactions. J Pharm Sci 107:18–23. [DOI] [PubMed] [Google Scholar]
- Cvijic S, Ibric S, Parojcic J, Djuris J. (2018) An in vitro-in silico approach for the formulation and characterization of ranitidine gastroretentive delivery systems. J Drug Deliv Sci Technol 45:1–10. [Google Scholar]
- Epling D, Hu Y, Smith DE. (2018) Evaluating the intestinal and oral absorption of the prodrug valacyclovir in wildtype and huPepT1 transgenic mice. Biochem Pharmacol 155:1–7. [DOI] [PMC free article] [PubMed] [Google Scholar]
- Fagerholm U, Johansson M, Lennernäs H. (1996) Comparison between permeability coefficients in rat and human jejunum. Pharm Res 13:1336–1342. [DOI] [PubMed] [Google Scholar]
- Garrigues TM, Martin U, Peris-Ribera JE, Prescott LF. (1991) Dose-dependent absorption and elimination of cefadroxil in man. Eur J Clin Pharmacol 41:179–183. [DOI] [PubMed] [Google Scholar]
- Gonzalez FJ, Yu AM. (2006) Cytochrome P450 and xenobiotic receptor humanized mice. Annu Rev Pharmacol Toxicol 46:41–64. [DOI] [PMC free article] [PubMed] [Google Scholar]
- Grass GM. (1997) Simulation models to predict oral drug absorption from in vitro data. Adv Drug Deliv Rev 23:199–219. [Google Scholar]
- Harwood MD, Achour B, Neuhoff S, Russell MR, Carlson G, Warhurst G, Rostami-Hodjegan A. (2016) In vitro-in vivo extrapolation scaling factors for intestinal P-glycoprotein and breast cancer resistance protein: part II. The impact of cross-laboratory variations of intestinal transporter relative expression factors on predicted drug disposition. Drug Metab Dispos 44:476–480. [DOI] [PubMed] [Google Scholar]
- Henze LJ, Griffin BT, Christiansen M, Bundgaard C, Langguth P, Holm R. (2018) Exploring gastric emptying rate in minipigs: effect of food type and pre-dosing of metoclopramide. Eur J Pharm Sci 118:183–190. [DOI] [PubMed] [Google Scholar]
- Hosea NA, Collard WT, Cole S, Maurer TS, Fang RX, Jones H, Kakar SM, Nakai Y, Smith BJ, Webster R, et al. (2009) Prediction of human pharmacokinetics from preclinical information: comparative accuracy of quantitative prediction approaches. J Clin Pharmacol 49:513–533. [DOI] [PubMed] [Google Scholar]
- Hu Y, Chen X, Smith DE. (2012) Species-dependent uptake of glycylsarcosine but not oseltamivir in Pichia pastoris expressing the rat, mouse, and human intestinal peptide transporter PEPT1. Drug Metab Dispos 40:1328–1335. [DOI] [PMC free article] [PubMed] [Google Scholar]
- Hu Y, Smith DE. (2016) Species differences in the pharmacokinetics of cefadroxil as determined in wildtype and humanized PepT1 mice. Biochem Pharmacol 107:81–90. [DOI] [PMC free article] [PubMed] [Google Scholar]
- Hu Y, Xie Y, Wang Y, Chen X, Smith DE. (2014) Development and characterization of a novel mouse line humanized for the intestinal peptide transporter PEPT1. Mol Pharm 11:3737–3746. [DOI] [PMC free article] [PubMed] [Google Scholar]
- Huang W, Lee SL, Yu LX. (2009) Mechanistic approaches to predicting oral drug absorption. AAPS J 11:217–224. [DOI] [PMC free article] [PubMed] [Google Scholar]
- Huh Y, Smith DE, Feng MR. (2011) Interspecies scaling and prediction of human clearance: comparison of small- and macro-molecule drugs. Xenobiotica 41:972–987. [DOI] [PMC free article] [PubMed] [Google Scholar]
- Ito K, Houston JB. (2005) Prediction of human drug clearance from in vitro and preclinical data using physiologically based and empirical approaches. Pharm Res 22:103–112. [DOI] [PubMed] [Google Scholar]
- Jamei M, Marciniak S, Feng K, Barnett A, Tucker G, Rostami-Hodjegan A. (2009) The Simcyp population-based ADME simulator. Expert Opin Drug Metab Toxicol 5:211–223. [DOI] [PubMed] [Google Scholar]
- Katoh M, Matsui T, Nakajima M, Tateno C, Kataoka M, Soeno Y, Horie T, Iwasaki K, Yoshizato K, Yokoi T. (2004) Expression of human cytochromes P450 in chimeric mice with humanized liver. Drug Metab Dispos 32:1402–1410. [DOI] [PubMed] [Google Scholar]
- Liu Z, Megaraj V, Li L, Sell S, Hu J, Ding X. (2015) Suppression of pulmonary CYP2A13 expression by carcinogen-induced lung tumorigenesis in a CYP2A13-humanized mouse model. Drug Metab Dispos 43:698–702. [DOI] [PMC free article] [PubMed] [Google Scholar]
- Ma X, Shah Y, Cheung C, Guo GL, Feigenbaum L, Krausz KW, Idle JR, Gonzalez FJ. (2007) The PREgnane X receptor gene-humanized mouse: a model for investigating drug-drug interactions mediated by cytochromes P450 3A. Drug Metab Dispos 35:194–200. [DOI] [PubMed] [Google Scholar]
- Mahmood I. (1999) Prediction of clearance, volume of distribution and half-life by allometric scaling and by use of plasma concentrations predicted from pharmacokinetic constants: a comparative study. J Pharm Pharmacol 51:905–910. [DOI] [PubMed] [Google Scholar]
- Mahmood I. (2002) Prediction of clearance in humans from in vitro human liver microsomes and allometric scaling. A comparative study of the two approaches. Drug Metabol Drug Interact 19:49–64. [DOI] [PubMed] [Google Scholar]
- Mahmood I, Martinez M, Hunter RP. (2006) Interspecies allometric scaling. Part I: prediction of clearance in large animals. J Vet Pharmacol Ther 29:415–423. [DOI] [PubMed] [Google Scholar]
- Martinez M, Mahmood I, Hunter RP. (2006) Interspecies allometric scaling: prediction of clearance in large animal species: Part II: mathematical considerations. J Vet Pharmacol Ther 29:425–432. [DOI] [PubMed] [Google Scholar]
- Miksys SL, Cheung C, Gonzalez FJ, Tyndale RF. (2005) Human CYP2D6 and mouse CYP2Ds: organ distribution in a humanized mouse model. Drug Metab Dispos 33:1495–1502. [DOI] [PubMed] [Google Scholar]
- Musther H, Olivares-Morales A, Hatley OJ, Liu B, Rostami Hodjegan A. (2014) Animal versus human oral drug bioavailability: do they correlate? Eur J Pharm Sci 57:280–291. [DOI] [PMC free article] [PubMed] [Google Scholar]
- Patterson D, Graham C, Cherian C, Matherly LH. (2008) A humanized mouse model for the reduced folate carrier. Mol Genet Metab 93:95–103. [DOI] [PMC free article] [PubMed] [Google Scholar]
- Pedersen JM, Khan EK, Bergström CAS, Palm J, Hoogstraate J, Artursson P. (2017) Substrate and method dependent inhibition of three ABC-transporters (MDR1, BCRP, and MRP2). Eur J Pharm Sci 103:70–76. [DOI] [PubMed] [Google Scholar]
- Pfeffer M, Jackson A, Ximenes J, de Menezes JP. (1977) Comparative human oral clinical pharmacology of cefadroxil, cephalexin, and cephradine. Antimicrob Agents Chemother 11:331–338. [DOI] [PMC free article] [PubMed] [Google Scholar]
- Sanoh S, Naritomi Y, Fujimoto M, Sato K, Kawamura A, Horiguchi A, Sugihara K, Kotake Y, Ohshita H, Tateno C, et al. (2015) Predictability of plasma concentration-time curves in humans using single-species allometric scaling of chimeric mice with humanized liver. Xenobiotica 45:605–614. [DOI] [PubMed] [Google Scholar]
- Santella PJ, Henness D. (1982) A review of the bioavailability of cefadroxil. J Antimicrob Chemother 10 (Suppl B):17–25. [DOI] [PubMed] [Google Scholar]
- Sawamoto T, Haruta S, Kurosaki Y, Higaki K, Kimura T. (1997) Prediction of the plasma concentration profiles of orally administered drugs in rats on the basis of gastrointestinal transit kinetics and absorbability. J Pharm Pharmacol 49:450–457. [DOI] [PubMed] [Google Scholar]
- Scheer N, Roland Wolf C. (2013) Xenobiotic receptor humanized mice and their utility. Drug Metab Rev 45:110–121. [DOI] [PubMed] [Google Scholar]
- Scheer N, Wilson ID. (2016) A comparison between genetically humanized and chimeric liver humanized mouse models for studies in drug metabolism and toxicity. Drug Discov Today 21:250–263. [DOI] [PubMed] [Google Scholar]
- Shalaeva M, Kenseth J, Lombardo F, Bastin A. (2008) Measurement of dissociation constants (pKa values) of organic compounds by multiplexed capillary electrophoresis using aqueous and cosolvent buffers. J Pharm Sci 97:2581–2606. [DOI] [PubMed] [Google Scholar]
- Shen H, Ocheltree SM, Hu Y, Keep RF, Smith DE. (2007) Impact of genetic knockout of PEPT2 on cefadroxil pharmacokinetics, renal tubular reabsorption, and brain penetration in mice. Drug Metab Dispos 35:1209–1216. [DOI] [PubMed] [Google Scholar]
- Song F, Hu Y, Jiang H, Smith DE. (2017) Species differences in human and rodent PEPT2-mediated transport of glycylsarcosine and cefadroxil in Pichia pastoris transformants. Drug Metab Dispos 45:130–136. [DOI] [PMC free article] [PubMed] [Google Scholar]
- Sun D, Lennernas H, Welage LS, Barnett JL, Landowski CP, Foster D, Fleisher D, Lee KD, Amidon GL. (2002) Comparison of human duodenum and Caco-2 gene expression profiles for 12,000 gene sequences tags and correlation with permeability of 26 drugs. Pharm Res 19:1400–1416. [DOI] [PubMed] [Google Scholar]
- Tang H, Mayersohn M. (2006) A global examination of allometric scaling for predicting human drug clearance and the prediction of large vertical allometry. J Pharm Sci 95:1783–1799. [DOI] [PubMed] [Google Scholar]
- Tanrisever B, Santella PJ. (1986) Cefadroxil. A review of its antibacterial, pharmacokinetic and therapeutic properties in comparison with cephalexin and cephradine. Drugs 32 (Suppl 3):1–16. [DOI] [PubMed] [Google Scholar]
- Tubic M, Wagner D, Spahn-Langguth H, Bolger MB, Langguth P. (2006) In silico modeling of non-linear drug absorption for the P-gp substrate talinolol and of consequences for the resulting pharmacodynamic effect. Pharm Res 23:1712–1720. [DOI] [PubMed] [Google Scholar]
- Yang B, Smith DE. (2017) In silico absorption analysis of valacyclovir in wildtype and Pept1 knockout mice following oral dose escalation. Pharm Res 34:2349–2361. [DOI] [PMC free article] [PubMed] [Google Scholar]
- Yu LX, Amidon GL. (1999) A compartmental absorption and transit model for estimating oral drug absorption. Int J Pharm 186:119–125. [DOI] [PubMed] [Google Scholar]
- Yu LX, Lipka E, Crison JR, Amidon GL. (1996) Transport approaches to the biopharmaceutical design of oral drug delivery systems: prediction of intestinal absorption. Adv Drug Deliv Rev 19:359–376. [DOI] [PubMed] [Google Scholar]


