

Abstract
Rationale and Objectives:
In order to establish the range of normal for quantitative CT-based measures of lung structure and function, we seek to develop methods for matching pulmonary structures across individuals and establishing a normative human lung atlas.
Materials and Methods:
In our previous work, we have presented a 3D image registration method suitable for pulmonary atlas construction based on CT datasets. The method has been applied to a populations of normative lungs in multiple experiments and, in each instance, has resulted in significant reductions in registration errors. This study is a continuation to our previous work by presenting a method for synthesizing a computerized human lung atlas from previously registered and matched 3D pulmonary CT datasets from a population of normative subjects. Our method consists of defining the origin of the atlas coordinate system; defining the normaclature and labels for anatomical structures within the atlas system; computing the average transformation based on the displacement fields to register individual subject to the common template subject; constructing the atlas by deforming the template with the average transformation; and calculating shape variations within the population.
Results:
The feasibility of pulmonary atlas construction was evalued using CT data sets from 20 normal volunteers. Substantial reductions in shape variability were demonstrated. In addition, the constructed atlas depends only slightly on a specific subject being selected as the template. These results indicate the framework is a robust and valid method for pulmonary atlas construction based on CT scans. The atlas consists of a grayscale CT data set of the template, a labeled mask data set of the template (i.e., lungs, lobes, and lobar fissures are labeled with different graylevels), a data set representing the population’s average shape, data sets representing the population’s shape variations (i.e., the magnitude of standard deviation), a data structure to contain the labels and coordinates of major airway branchpoints, and the labels of the mask data set, and a reference coordinate system for each lung.
Conclusion:
A computerized human lung atlas representing by the average shape of a population of twenty normal subjects was constructed and visualized. The atlas provides a basis for establishing regional ranges of normative values for structural and functional measures of the human lung. In the future, we plan to use the computerized human lung atlas to help detect and quantify early signs of lung pathology.
Keywords: Pulmonary imaging, lung atlas, atlas nomenclature, average transformation, shape variation
1. INTRODUCTION
To reduce lung cancer-associated mortality, many CT-based new therapeutic interventions for lung disease have emerged. As one takes advantage of new methods for CT-based assessment of regional ventilation and perfusion [1–4], it becomes necessary to detect age and gender-based normative values for CT-based measures of lung structure and function. Therefore, there is a need to establish methods by which lung structure can be compared from person to person (inter-subject) [5]. A computerized atlas (or standard structural model) that defines a normal range of pulmonary variation can greatly facilitate the understanding of subject-invariant structure-function relationships. It can also provide standard, quantitative, and sensitive measures of chronic structural change due to aging or disease.
In our previous work [6–8], we presented an semi-automatic method for inter-subject registration and warping of volumetric CT datasets. Our method consists of the following steps. First, in all subjects, the lungs, lobes, and airways are segmented based on image graylevel information and 3-D connectivity of tissues. Next, the airways are futher processed by skeletonization technique to extract a set of reproducible airway branchpoints to be used as anatomical landmarks in the registration process. The airway branchpoints are labelled and matched across subjects by an automatic airway tree matching and labeling algorithm [9]. Third, image registration in general requires all images to be in the same coordinate system. This is achieved by a combination of rigid alignment, isotropic scaling, padding, and downsampling. This step results in the segmented lungs, lobes, and matched airway branchpoints, all in the coordinate system of the template image. Finally, a landmark and intensity-based consistent image registration technique [10] is used to register a template image volume with the remaining lung volumes in the population. Results from clinical studies showed that our proposed method was able to reduce the average landmark registration error and average relative volume overlap error from 10.5 mm and 0.70 before registration to 0.4 mm and 0.11, respectively, after registration. The results indicate the method is suitable for pulmonary atlas construction based on CT datasets.
Our previous work was the first step towards the goal of developing a normative human lung atlas from a population of 3-D pulmonary CT datasets of normative subjects. However, several critical and practical questions still remain unanswered. Namingly, the computation of the average transformation and the shape variations within the population, the proper selection of the origin of the atlas coordinate system, and the strategy to label and color-code the atlas system. As a continuation to our previous work, this study addresses these questions by presenting a method for synthesizing a computerized human lung atlas from previously registered and matched 3D pulmonary CT datasets from a population of normative subjects. Our method consists of selecting a normal subject as the template; defining the origin of the atlas coordinate system; defining the normaclature and labels for anatomical structures within the atlas system; computing the average transformation based on the displacement fields to register individual subject to the common template subject; constructing the atlas by deforming the template with the average transformation; and calculating shape variations within the population.
This paper is organized as follows. Section 2 describes the patient selection criteria, image acquisition protocol, and the details of the proposed method to construct the normative atlas. The experimental results and the constructed atlas are presented in Section 3. It is then followed by discussions and conclusions in Section 4 and 5.
2. MATERIALS AND METHODS
2.1. Image Acquisition
2.1.1. Participants
Prospective research participants were screened to determine their eligibility to participate in the research. In order to be deemed eligible to participate in the research, prospective participants had to indicate that they were 18 years old or older and had not smoked a pack of tobacco in their lifetime. They were asked to fill out an extensive questionnaire regarding their health and history, a baseline dyspnea index, and a chronic respiratory questionnaire, to make sure they did not have chronic respiratory diseases or any related health problems in the history. Their demographic information (age, gender, height, and weight, etc.) were also collected during the screening. In addition, all females of child bearing age must undergo a pregnancy test prior to CT scanning.
Furthermore, pulmonary function test (PFTs) data was collected prior to the CT scanning for this study to ensure that the participants did not have asthma. The following commonly used criteria were used in this research. If any of these tests come back abnormal, the CT scan of the subject is cancelled.
FVC% of the predicted greater or equal to 80%,
FEV1% of the predicted greater or equal to 80%,
FEV1/VC% of the predicted greater or equal to 75%,
DLCO% of the predicted greater or equal to 75%.
2.1.2. Selecting An Template
A carefully selected normal subject is used as the template. The criteria involved in the selection of this subject are listed below:
Non-smoker.
Normal subject as evidenced by the PFTs. The standards for considering a subject is normal appear in Section 2.1.1.
Complete, normal airway tree segmentation available for the subject. This was done by visually checking the segmented airway tree and comparing with a topological model of the human airway tree (Figure 1). Details concerning this model was discussed in our previous work [6,7].
Complete, normal pulmonary blood vessel tree segmentation available for the subject. This was done by visually checking the segmented blood vessel trees.
Body mass index (BMI) is between 18.5 and 24.9, following the guideline published by the National Institute of Health (NIH) for adults.
Figure 1:
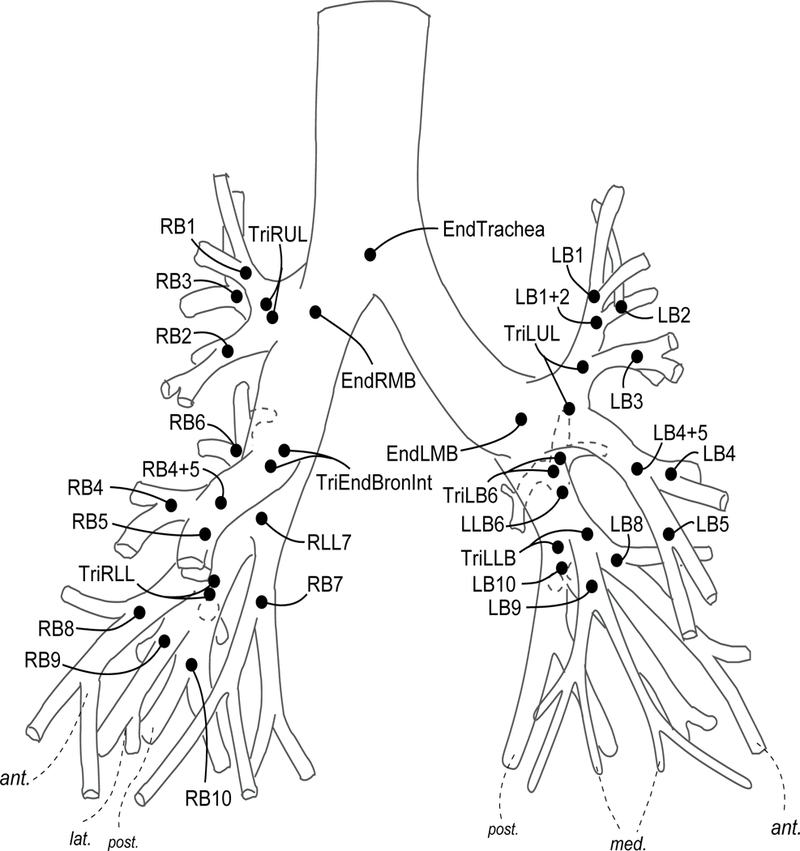
A topological model of human airway tree developed in this research. Details concerning this model was discussed in our previous work [6,7].
Of the twenty participants included in this study, there were eight female subjects at their twenties. Among them, three subjects were selected as the initial candidates for the template. It was decided to exclude other five subjects because of out-of-range body mass indices or because of the missing airway branches in their airway tree segmentation.
The graylevel CT images of the three candidates were reviewed by two experienced pulmonary experts to determine which candidate is the best as the template. They used a non-commercial pulmonary software package called PASS© [11,12] to examine the CT images. PASS provides a slice-by-slice display of three orthogonal views (transversal, sagittal, and coronal) of a CT data set, which allows the experts to pan through all CT slices in one view while looking at the other two views at the same time. It was found that three-dimensional surface renderings of the segmented lungs were also helpful during the review process.
A 22-year-old “perfectly normal” female subject with an excellent airway tree segmentation was finally selected as the template in this research.
2.1.3. CT Scan Protocol
The image data sets used in this work consist of twenty volumetric pulmonary CT images. The subjects were studied under a protocol approved by the University of Iowa IRB. Images were acquired using a multi-detector row CT (MDCT) scanner (Philips MX8000 – 4 rows) with accurate lung volume control (images acquired at 85% total lung capacity). Each volume contained between 300 and 600 image slices with a slice thickness of 1.3 mm, a slice spacing of 0.6 mm and a reconstruction matrix of 512 × 512 pixels. In-plane pixel size was approximately 0.6 × 0.6 mm2. Figure 2 shows two typical transverse slices of a 3-D pulmonary CT image (in this case, subject 9). The subject demographics are given in Table 1. Subject 9 was selected as the template based on the criteria described in Section 2.1.2; the remainder of the subjects are healthy based on the established study criteria (Section 2.1.1).
Figure 2:
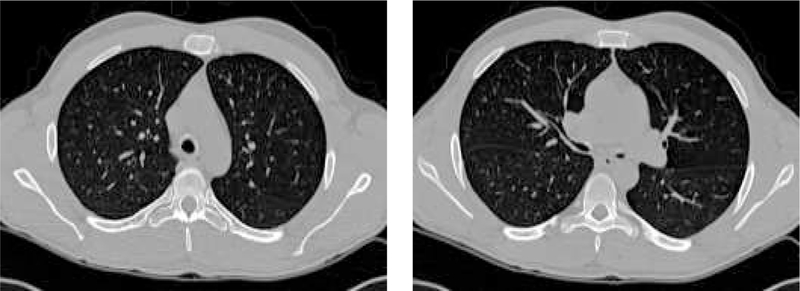
Two transverse slices of a 3-D pulmonary CT image from subject 9 from Table 1.
Table 1:
Demographics for the twenty subjects used in this study for atlas construction. Subject 9 was selected as the template based on the criteria described in Section 2.1.2.
| Subject Number | Age (years) | Gender | Weight (kg) | Height (cm) |
|---|---|---|---|---|
| 1 | 20 | m | 99.8 | 174 |
| 2 | 22 | m | 81 | 177 |
| 3 | 60 | f | 72 | 162 |
| 4 | 25 | m | 79 | 182 |
| 5 | 25 | m | 84 | 187.9 |
| 6 | 24 | f | 63.3 | 170 |
| 7 | 37 | f | 79.5 | 167.6 |
| 8 | 21 | f | 70.4 | 172.7 |
| 9* | 22 | f | 60 | 165 |
| 10 | 20 | f | 54 | 162.5 |
| 11 | 22 | f | 65.7 | 184.5 |
| 12 | 25 | m | 91.8 | 187.9 |
| 13 | 29 | m | 80 | 172.2 |
| 14 | 46 | f | 61.3 | 155 |
| 15 | 20 | f | 69 | 172 |
| 16 | 21 | f | 67.7 | 167 |
| 17 | 24 | f | 63.6 | 177.5 |
| 18 | 43 | f | 53 | 161.3 |
| 19 | 23 | f | 70.45 | 180 |
| 20 | 40 | m | 109 | 185 |
Because lung inflation level reflects different state of the lung in terms of pulmonary function and physiology (e.g. breathing, body posture, circulation level, disease, etc.), images acquired at the same lung inflation level across subjects were preferred in this research. A sophisticated gated programmable ventilator (Eric Hoffman et al., US Patent No. US5183038) was used in image acquisition to achieve the accurate lung volume control at 85% of total lung capacity (TLC).
The CT datasets were hereby registered and warped with respect to the template (subject 9) using the method described in our previous work [6–8].
2.2. Atlas Coordinate Systems
In human pulmonary system, the left and right lungs are relatively independent functionally and structurally. Moreover, it has been shown that the two lungs can deform independently during respiration [13]. This has posed unique challenge for the high dimensional registration algorithm to capture the extremely large and irregular shape deformations. To construct the atlas reliably, we decide to build separate atlas (as well as coordinate system) for each lung.
There were two criteria considered in selecting the origin for the reference coordinate system of the lung atlas. First, the feature point selected as the origin should be easy to identify, so it can be detected repeatedly and reliably. This requirement is particularly important in the inter-subject registration. Second, the origin should be part of lung anatomy, so it does not depend on the imaging system and scan protocol.
Like the anterior commissure to the brain atlas, the end of right mainstem bronchus (EndRMB) and the end of left mainstem bronchus (EndLMB) are small but easy to spot regions, making them ideal origins for the coordinate systems (Figure 1). In this coordinate system, each location in the lung is represented by three coordinates, describing the distances in millimeters (or pixels) from the origin: X is the right/left dimension, Y is the anterior/posterior dimension, and Z is the cranial/caudal dimension. Therefore, the position 0×0×0 is precisely at the origin, while −32×21×10 is right (32mm), posterior (21mm) and cranial (10mm) from the origin. In this atlas axial slices are referred to by their Z coordinate, coronal images are referred to by their Y coordinate, and sagittal slices are referred to by their X coordinate.
2.3. Labeling the Template Data Set and Atlas Nomenclature
We have pointed out in Section 1, nomenclature is an integral part of an atlas system. In medical images, a common form of nomenclature is to represent anatomic labels with pixel graylevels [14–16]. Therefore, in this research, we seek to label the template data set using different graylevels to represent different anatomic units.
There are four groups of anatomic regions under consideration: the lungs, lobes, major airway branches up to sixth generations, and major airway branchpoints. For the first three groups, the labels and the corresponding graylevels are unique identifiers. Airway branchpoints are associated with airway branches where the branchpoints mark the end of the branches. However, for the airway branchpoints, the labels and corresponding voxel coordinates are unique identifier. In this research, we limited ourselves to those major airway branches (and branchpoints) that could be reliably identified and matched [9].
There are 256 (28) labels available for a 8-bit graylevel image. Table 2 shows the suggested allocation of these 256 labels and their corresponding graylevels. Labels 1–28 are used by lungs, lobes, and sub-lobes; 29–59 are populated for major airway branches up to the sixth generations. Labels 81–83 are occupied by lobar fissures. Labels 60–80 are currently not used and reserved for the additional airway branches beyond the sixth generation. The remaining labels are not used and may be used for pulmonary arteries and veins, and/or disease-specific labels for nodules, etc. Label 0 (black) always represents the background.
Table 2:
The suggested allocation of labels for the template data set. There are totally 256 (28) labels available for a 8-bit graylevel image.
| Label (Graylevel) | Nomenclature (Anatomy) | Label (Graylevel) | Nomenclature (Anatomy) |
|---|---|---|---|
| 0 | Background | 1 | Lung |
| 2 | Lung Left | 3 | Lung Right |
| 4 | Lung Left Upper Lobe | 5 | Lung Left Lower Lobe |
| 6 | Lung Right Upper Lobe | 7 | Lung Right Middle Lobe |
| 8 | Lung Right Lower Lobe | 9 | Lung LB1+LB2 Sub Lobe |
| 10 | Lung LB3 Sub Lobe | 11 | Lung LB4 Sub Lobe |
| 12 | Lung LB5 Sub Lobe | 13 | Lung LB6 Sub Lobe |
| 14 | Lung LB7+LB8 Sub Lobe | 15 | Lung LB9 Sub Lobe |
| 16 | Lung LB10 Sub Lobe | 17 | Lung LBA Sub Lobe |
| 18 | Lung RB1 Sub Lobe | 19 | Lung RB2 Sub Lobe |
| 20 | Lung RB3 Sub Lobe | 21 | Lung RB4 Sub Lobe |
| 22 | Lung RB5 Sub Lobe | 23 | Lung RB6 Sub Lobe |
| 24 | Lung RB7 Sub Lobe | 25 | Lung RB8 Sub Lobe |
| 26 | Lung RB9 Sub Lobe | 27 | Lung RB10 Sub Lobe |
| 28 | Lung RBA Sub Lobe | 29 | Airway Trachea |
| 30 | Airway LMB | 31 | Airway RMB |
| 32 | Airway LUL | 33 | Airway LLB6 |
| 34 | Airway RUL | 35 | Airway BronInt |
| 36 | Airway LB1+2 | 37 | Airway LB3 |
| 38 | Airway LB4+5 | 39 | Airway LB6 |
| 40 | Airway LLB | 41 | Airway RB1 |
| 42 | Airway RB2 | 43 | Airway RB3 |
| 44 | Airway RB4+5 | 45 | Airway RB6 |
| 46 | Airway RLL7 | 47 | Airway LB1 |
| 48 | Airway LB2 | 49 | Airway LB4 |
| 50 | Airway LB8 | 51 | Airway LB9 |
| 52 | Airway LB10 | 53 | Airway RB4 |
| 54 | Airway RB5 | 55 | Airway RLL |
| 56 | Airway RB7 | 57 | Airway RB8 |
| 58 | Airway RB9 | 59 | Airway RB10 |
| 60–80 | Reserved | 81 | Right Horizontal Fissure |
| 82 | Right Oblique Fissure | 83 | Left Oblique Fissure |
| 84–255 | Not used | ||
There are some practical issues. It would be nice to integrate the segmentations with the dictionary into one system, in reality, it is often the case that different segmentation routines are used to extract different anatomies from graylevel CT images, and they do not necessarily assign labels to the anatomies according to the dictionary. So there is a need to combine the segmentation results together and re-assign the labels. This can be achieved by a look-up-table (LUT) method which maps the old labels from individual segmentation routines to the labels in dictionary. Table 3 is an example (portion) of such a label LUT.
Table 3:
An example (portion) of a label LUT which maps the old labels from individual segmentation routines to the labels in Table 2. Note that the actual LUT is determined by the labeling conventions of the segmentation algorithms.
| Nomenclature | Old Label (Graylevel) | → | New Label (Graylevel) |
|---|---|---|---|
| Background | 0 | → | 0 |
| Lung Left | 20 | → | 2 |
| Lung right | 30 | → | 3 |
| Airway LMB | 5 | → | 31 |
| Airway RMB | 4 | → | 32 |
| Airway LUL | 8 | → | 33 |
| Airway LLB6 | 9 | → | 34 |
| Airway RUL | 7 | → | 35 |
| Airway BronInt | 6 | → | 36 |
| Airway LB1+2 | 26 | → | 37 |
| Airway LB1+2 | 49 | → | 37 |
| Airway LB3 | 27 | → | 38 |
| Airway LB4+5 | 15 | → | 39 |
| Airway LB6 | 16 | → | 40 |
| Airway LLB | 17 | → | 41 |
| Airway RB1 | 12 | → | 42 |
| Airway RB2 | 25 | → | 43 |
| Airway RB3 | 24 | → | 44 |
| Airway RB4+5 | 10 | → | 45 |
| Airway … | … | → | … |
| Airway RLL7 | 20 | → | 47 |
| Airway … | … | → | … |
| Airway RB8 | 68 | → | 58 |
| Airway RB9 | 69 | → | 59 |
| Airway RB10 | 100 | → | 60 |
Another practical issue may rise if different segmentation routines assign the same label to different anatomies - duplicated labels. For example, in Table 3, label #20 was assigned to the left lung as well as the airway branch RLL7 because two different segmentation routines were used. In this case, the label LUT may be divided into multiple sub-LUTs where no duplicated labels in each sub-LUT. The sub-LUTs are then applied in a sequence.
2.4. Computing the Average Shape
The lung atlas is constructed by computing the average shape of a population of normal lungs from CT images. This shape representation best captures the lung size and shape across the population and is on average closest to all of the individual lung shapes.
In this work, we compute the human lung atlas by computing the average shape of a population of lung images using the method described in [17–19] and summarized as follows. One image is selected from the population as the template. Using the consistent image registration method described in detail in our previous work [6–8], the Lagrangian transformations ,i = 1, 2,..., N, are computed to deform the template image into the shape of each image in the population. Next, the average Lagrangian transformation is computed by
| (1) |
and is applied to the template T to synthesize the average shape of the population as
| (2) |
The above described procedure is illustrated in Figure 3.
Figure 3:
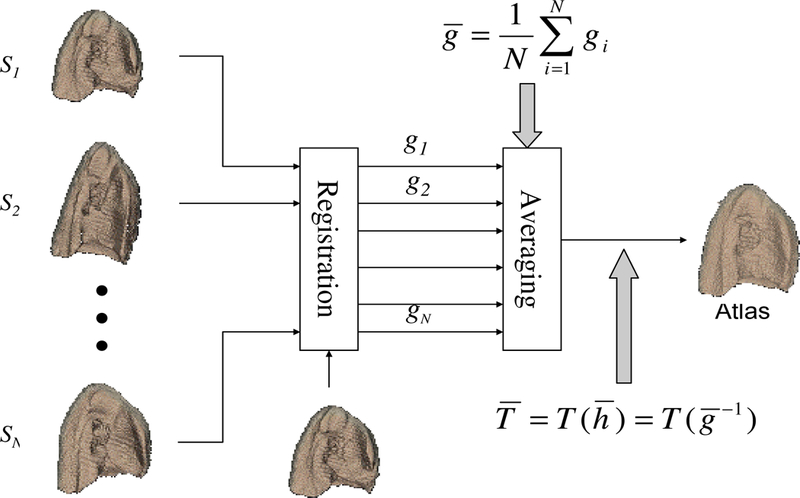
The procedure to build an image-based average shape for a homogeneous population.
Prior to computing the lobar atlases, we segment the template image T for lobes, which yields a lobar mask image containing four lobes - right upper, right lower, left upper, and right lower lobes [20,21]. We then divide the lobar mask image into two subimages, where each subimage contains two lobes of each lung. The lobar atlas is constructed by applying the displacement fields computed from the registering the lung to the lobar subimage, i.e.
| (3) |
where L represents the upper and lower lobar atlas and MT is the lobar mask subimage of the template.By this means, the upper and lower lobar atlas for each lung is calculated at the same time. Alternatively, the upper and lower lobar atlases can be constructed separated. A detailed discussion on this matter can be found in Section 4.
2.5. Computing The Population Shape Variations
The average displacement distance measurement describes how far on average a voxel element in T(i) has to travel to get to its corresponding locations in the population. The average displacement distance is defined in terms of the pointwise distances between data sets given by the transformation. The distance from a point in the coordinate system of image T(i) (x) to its corresponding location in the coordinate system of is defined by the displacement field w(i,j) described in Equation 4.
| (4) |
The average displacement distance between images T(i) and T(j) in a region of interest where is an anatomical mask is defined as
| (5) |
where is the volume of the region of interest. The average displacement distance between image T(i) and the population of images T(j) for j = 1,..., N within the region of interest is defined as the average of the pairwise average displacement distances. The average displacement distance between a data set and the population is given by
| (6) |
The displacement variance distance measures the variance in the displacement distance between corresponding points in T(i) and the population. The displacement variance between a point in the coordinate system of image T(i) and its corresponding locations in the population is defined as
| (7) |
In order to characterize this displacement variance as a distance measurement, the average of these pointwise displacement variances is computed. The displacement variance distance between image T(i) and the population for where is an anatomical mask is defined as DDV(i) in Equation 8.
| (8) |
Therefore, the displacement variance distance DDV (i) is a measure of how variable the displacement between data set i and the population data sets is within the region of interest.
To make the atlas more useful, the average shape and shape variations in the population can be combined into a colorized atlas, where the colors correspond to the standard deviation displacement from the atlas to the population and thus visualize the normal range presented in the population on a voxel basis. A standard color map (i.e., jmartin3.ucm [22]) with seven color scales was used to color code the standard deviation displacement. A commercially available software package called Analyze (Analyze Direct, Inc., Lenexa, KS) was used to combine the color with the atlas data set and volume render the result.
3. RESULTS
An image-based lung atlas was computed from the twenty registered and matched CT datasets using the procedure described in Section 2 of this paper. Figure 4 shows the three orthogonal views of the graylevel CT data set of the template, the most representative subject of the population sampled. The major anatomy of this data set has been shown in Figure 5, which is a volume renderings of the template with labels supplied by the labeled mask. The user may examine a region of interest in the CT data set and get the corresponding anatomic label from the labeled mask, or vice versa. Therefore, this data set may be used as a reference for surgical planning, radiation therapy planning, or teaching.
Figure 4:

The three orthogonal views of the graylevel CT data set of the template, the most representative subject of the population sampled.
Figure 5:
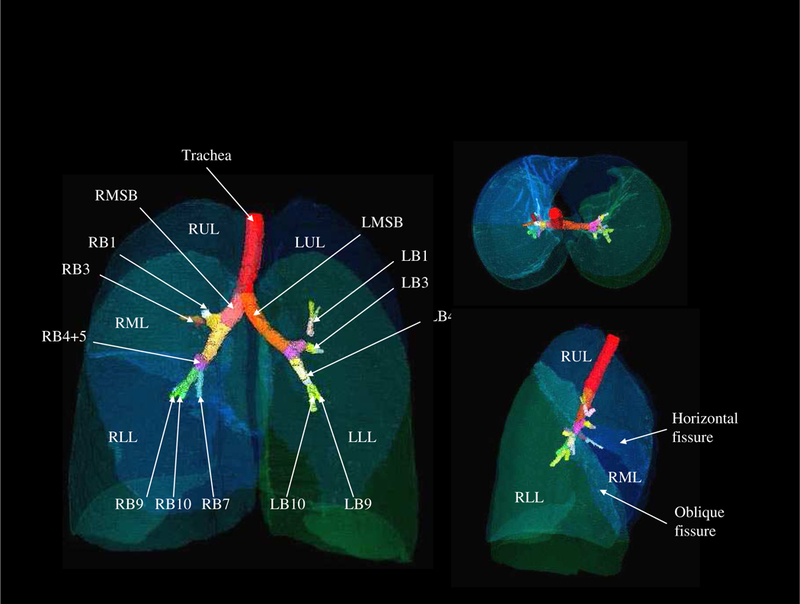
The volume renderings of the labeled mask. User may click the structure of interest in the CT data set and get the corresponding anatomic label from the labeled mask, or vice versa.
To assess the dependency of the proposed method on a particular subject being selected as the template, we performed an experiment in which two additional subjects (subject 11 and 19) were used as the template. This experiment resulted in three atlases and they are compared in Figure 8. Examination of the average shapes and shape variations suggests that the proposed atlas construction method depends only slightly on a specific subject being selected as the template.
Figure 8:
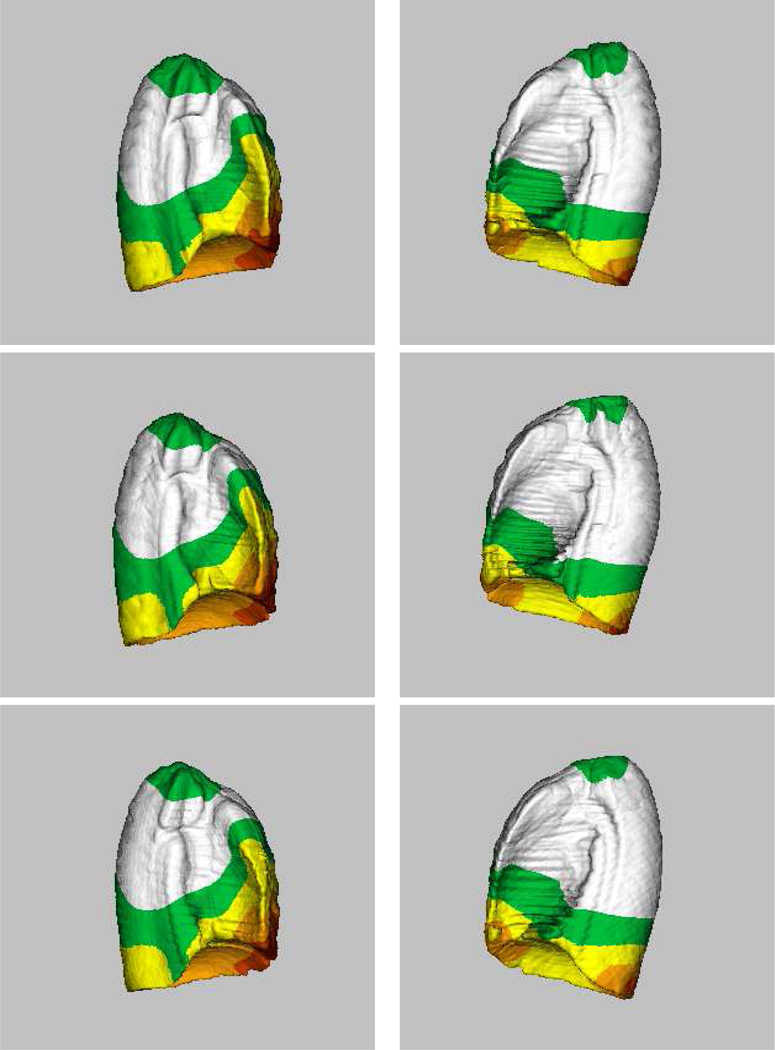
Computed lung atlases (averages + shape variations) from twenty subjects, using three different subjects as the template. (Top row) Subject 9 as the template. (Middle row) Subject 19 as the template. (Bottom row) Subject 11 as the template. For each atlas, the left column represents the right lung and the right column represents the left lung. Examination of the average shapes and shape variations suggests that the proposed atlas construction method depends only slightly on a specific subject being selected as the template.
Figure 9 further demonstrates the effacy of the proposed method in the form of overlapping contours from axial CT images. The top row shows the shape variations among a set of (N=6) subjects involved in this study, while the botton row corresponds to the transformed CT datasets after transforming individual subject with respect to a common template subject (subject 9). Only six subjects were displayed here to avoid overcrowding the figure. The columns represent three axial image slices randomly chosen near the apex (top), the body (center), and the diaphragm (bottom). Significant reduction in registration errors can be seen with reduced variability.
Figure 9:
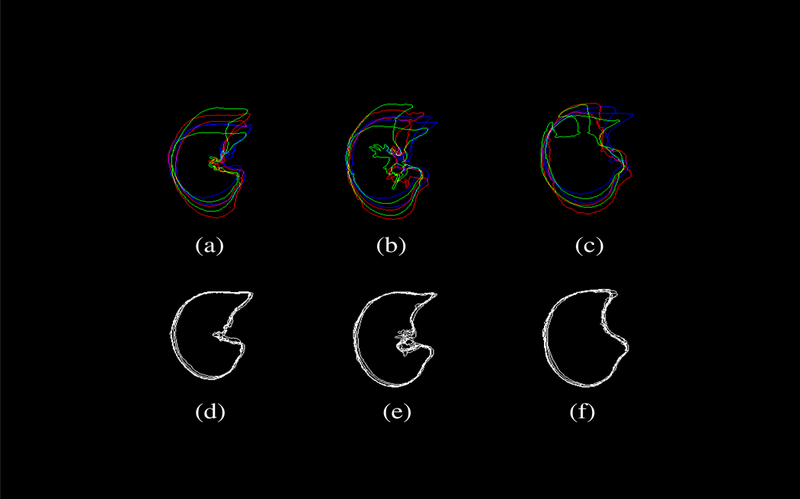
The shape variability among a set of (N=6) subjects involved in this study is demonstrated by overlapping contours from axial CT images. The top row shows ithe shape variation among the subjects, while the bottom row corresponds to the transformed CT datasets after transforming individual subject with respect to a common template subject (subject 9). Only six subjects were displayed here to avoid overcrowding the figure. The columns represent three axial image slices randomly chosen near the apex (top), the body (center), and the diaphragm (bottom). Significant reduction in registration errors can be seen with reduced variability.
These results demonstrate the robustness of our method described in Sections 2.4 and 2.5.
4. DISCUSSIONS
We have described in detail a method by which one can construct an atlas of the lungs and their internal structures from a population. This method consists of selecting a normal subject as the template; defining the origin of the atlas coordinate system; defining the normaclature and labels for anatomical structures within the atlas system; computing the average transformation based on the displacement fields to register individual subject to the common template subject; constructing the atlas by deforming the template with the average transformation; and calculating shape variations within the population. In this section, we discuss several practical considerations that have not been explicitly covered in previous chapters.
4.1. Construction of Lobar Atlas
In Section 3 we obtained the lobar atlas by first registering each left or right lung, then applying the deformation fields to lobe mask images. Alternatively, one could register the lobe separately to obtain the same atlas. There are advantages as well as drawbacks associated with both approaches:
Lobe slippage. During expiration, it has been shown that the upper lobes slip on the surfaces of the lower lobes. So it is advantageous to capture this motion in the registration thru the alternative approach. However, for inter-subject registration at a fixed inflation level (i.e. TLC), the advantage of a lobe-by-lobe approach is not obvious.
Performance. The difference between the two approaches is subtle. A dedicated experiment has been conducted to assess the difference, where six data sets were used to construct a right upper lobe atlas using the current and alternative approaches. Figure 10 compares two typical slices from the two generated atlases. The results showed that the volume difference between the two generated atlases is only 2.6 percent.
Computational expenses. Since the lobe-by-lobe approach will require to perform the registrations N more times, where N = 2 for the left lung and N = 3 for the right lung, it is very computationally expensive. For instance, considering to build the atlas from 20 data sets, the total number of pairs of registrations needed will be (2 + 3) × (20 × 19/2) = 950, as opposed to 2 × (20 × 19/2) = 380 for the proposed approach.
Lobe overlapping. In the lobe-by-lobe approach, the upper and lower lobe atlases are constructed separately. Without the boundary constraints, the lobar atlases will overlap with each other in volume around the lobe fissures. This undesired effect can be seen in Figure 11.
Figure 10:

Slice comparison of two typical slices from the right upper lobe atlases. The atlases were generated by applying two different approaches to six pulmonary CT data sets. (a)(b) The current approach. (c)(d) The alternative approach. The volume difference between the two atlases is only 2.6 percent.
Figure 11:

Overlapping regions around the lobar fissure can be seen in this synthesized data set by combining the right upper lobe atlas and the right lower lobe atlas. These two atlases were constructed separately from six pulmonary CT data sets. (a) The coronal view. (b) The transversal view.
So in this work, we decided to use the proposed approach to compute the lobar atlases. The presented method for lobar atlas construction is also applicable to the horizontal lobar fissure when the segmented results are available.
4.2. The Impact of the Origin on the Shape Variation Measure
We have described our method to compute shape variations (by measuring the standard deviation displacement) in Section 2.4, and demonstrated the calculated shape variations among twenty normal subjects being studied in Section 3. It needs to be emphasized that the shape variation measured this way is origin dependent. In another word, the magnitude of the standard deviation displacement for a specific voxel will change if the origin of the underlying coordinate system is moved to a different location. This is because, by definition, the shape variation is always zero at the origin, and gradually increases as one moves away from the origin. Therefore, it is very important to state the location of the origin when talking about the shape variations in an atlas context.
An interesting perspective of this fact is how to choose the origins for one particular study. This decision will have a great impact on the experiment design, since the location of the origin affects the shape variation measure and thus affects how many subjects would be needed for the study. Based on our experience, we recommend to select an origin that is close to the anatomy to be studied. Of course, potential candidates as the origin have to meet the basic criteria set forth in Section 2.2. For example, to study interstitial diseases, it is maybe more appropriate to choose an origin near or at the center of the mass of the lung (which is about equal distance to all the peripheral regions) than at the end of the mainstem branchus (which is close to the mediastinal surface).
5. CONCLUSIONS
This study is continuation of our previous work [6–8] and an integral part of a research that investigated the construction of a normative human pulmonary atlas. The research was the first step towards developing a number of age, gender, and disease-specific atlases for future clinical applications. In our opinion, there are four major components common for building pulmonary-specific atlases: image acquisition, pre-processing, image registration and warping, and atlas construction. Our previous work has addressed the second and third components, while this study is concentrated on the first and fourth components. Altogether, they attempt to answer the clinical question: how can an image-based pulmonary atlas be constructed? Together discussed were some important practical issues: alternative approaches to build lobar atlas, methods to calculate shape variations, and expansion of the atlas by including new CT data sets as well as pulmonary function data. As an important part of this research, a pulmonary-specific system was developed to represent the atlas. This system consists of a deformed grayscale CT data set of the template; a deformed labeled mask data set of the template (i.e., lungs, lobes, and lobar fissures are labeled with different graylevels); a data set representing the population’s average shape; data sets representing the population’s shape variations (i.e., x, y, z-components and the magnitude of standard deviation); a data structure to contain the labels and coordinates of major airway branchpoints, and the labels of the mask data set; a reference coordinate system for each lung (within a given coordinate system, any location is described as the distance (in pixels or millimeters) from the origin). The next step of the research is the construction of a total pulmonary atlas that provides the baseline to classify normal subjects from diseased population, established statistically from homogeneous populations at different age, gender, and race. One of the limitations of this research is the limited availability of normal volunteers (N=20). Furthermore, the accuracy of inter-subject registration can benefit from improved airway segmentation and branchpoints detection, or even pulmonary vessel (veins and arteries) segmentation and branchpoint detection.
Figure 6:
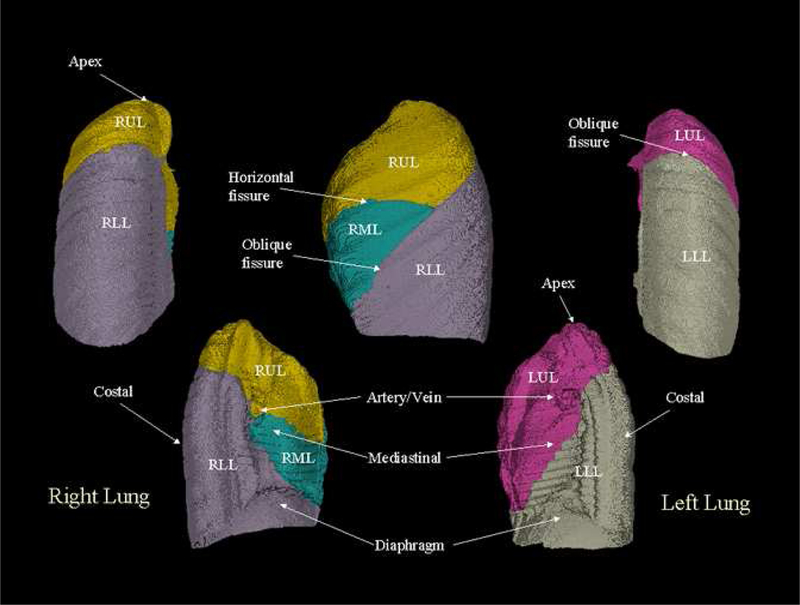
The surface-renderings of the calculated mean shape of the population. The different anatomies have been color-coded. It can be seen in the figure that this image-based atlas carries structural information such as the average location of the oblique lobar fissures.
Figure 7.
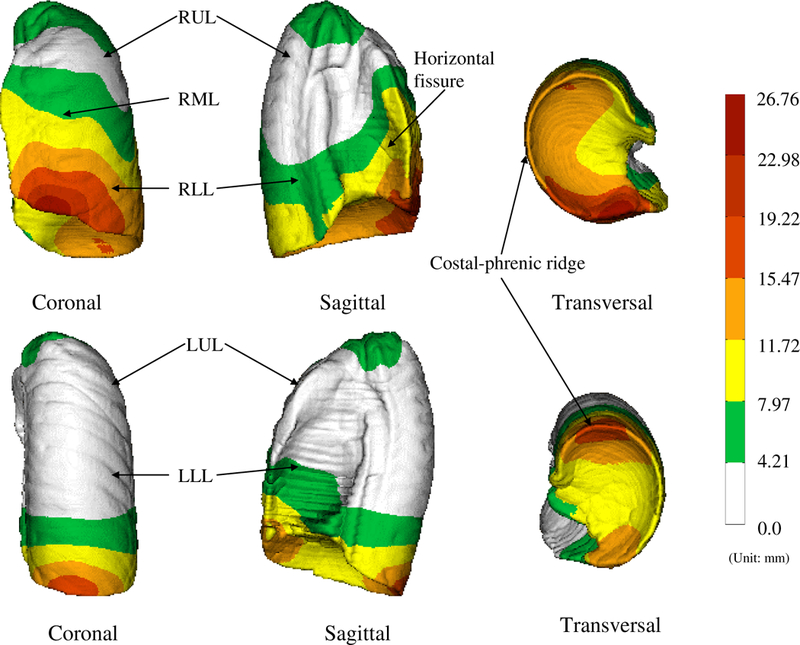
The standard deviation displacements (with respect to EndRMB or EndLMB) color-coded on the right lung (top row) and the left lung (bottom row). The standard deviation displacement is the indication of the shape variations in the population. The colorbars indicate the scale of variations (unit: mm).
ACKNOWLEDGMENTS
The authors wish to thank the associate editor and anonymous reviewers for their insightful comments and suggestions.
This work was supported in part by HL64368 and NS35368 from the National Institutes of Health and by grant 0092758 from the National Science Foundation.
References
- [1].Tajik JK, Chon D, Won C, Tran BQ, and Hoffman EA, “Subsecond multisection CT of regional pulmonary ventilation,” Acad. Radiol, vol. 9, no. 2, pp. 130–146, 2002. [DOI] [PubMed] [Google Scholar]
- [2].Tajik JK, Tran BQ, and Hoffman EA, “CT-based assessment of regional pulmonary blood flow parameters: an update,” in Proc. SPIE Conf. Medical Imaging, 1999, vol. 3660, pp. 181–187. [Google Scholar]
- [3].Kreck TC, Krueger MA, Altemeier WA, Sinclair SE, Robertson HT, Shade ED, Hilde-brandt J, Lamm WJ, Frazer DA, Polissar NL, and Hlastala MP, “Determination of regional ventilation and perfusion in the lung using xenon and computed tomography,” J. Applied Physiology, vol. 91, no. 4, pp. 1741–1749, 2001. [DOI] [PubMed] [Google Scholar]
- [4].Marcucci C, Nyhan D, and Simon BA, “Distribution of pulmonary ventilation using Xe-enhanced computed tomography in prone and supine dogs,” J. Applied Physiology, vol. 90, no. 2, pp. 421–430, 2001. [DOI] [PubMed] [Google Scholar]
- [5].Hoffman EA, “Advances in physiologic lung assessment via electron beam computed tomography,” in Medical Technology Symposium, 1998, pp. 96–108. [Google Scholar]
- [6].Li B, Christensen GE, Dill J, Hoffman EA, and Reinhardt JM, “3-d inter-subject warping and registration of pulmonary CT images for a human lung model,” in Proc. SPIE Conf. Medical Imaging, 2002, vol. 4683, pp. 324–335. [Google Scholar]
- [7].Li B, Christensen GE, Hoffman EA, McLennan G, and Reinhardt JM, “Establishing a normative atlas of the human lung: Intersubject warping and registration of volumetric CT images,” Acad. Radiol, vol. 10, pp. 255–265, 2003. [DOI] [PubMed] [Google Scholar]
- [8].Li B, Christensen GE, Hoffman EA, McLennan G, and Reinhardt JM, “Pulmonary CT image registration and warping for tracking tissue deformation during respiratory cycle through 3D consistent image registration,” Med. Phys, vol. 35, pp. 5575–5583, 2008. [DOI] [PMC free article] [PubMed] [Google Scholar]
- [9].Tschirren J, Palagyi K, Reinhardt JM, Hoffman EA, and Sonka M, “Segmentation, skeletonization, and branchpont matching - A fully automated quantitative evaluation of human intrathoracic airway trees,” in Lecture Notes in Computer Science, Dohi Takeyosihi and Kikinis Ron, Eds., Utrecht, October 2002, vol. 2489, pp. 12–19, Springer-Verlag. [Google Scholar]
- [10].Johnson HJ and Christensen GE, “Consistent landmark and intensity-based image registration,” IEEE Trans. Medical Imaging, vol. 21, no. 5, pp. 450–461, 2002. [DOI] [PubMed] [Google Scholar]
- [11].Guo J, Reinhardt JM, Won C-H, Sonka M, McLennan G, and Hoffman EA, “Human lung atlas: Establishment of a comprehensive software environment for the assessment of pulmonary anatomy and physiology via multi-slice sub-second spiral CT,” in Proc. of Rad. Soc. of North Ame. Annual Meeting, 2001. [Google Scholar]
- [12].Guo J, Reinhardt JM, Kitaoka H, Zhang L, McLennan G, and Hoffman EA, “Integrated system for CT-based assessment of parenchymal lung disease,” in 2002 International Symposium on Biomedical Imaging, Washington, DC, July 2002, pp. 871–874. [Google Scholar]
- [13].B. Thompson, W. Lee, and J. Wilson, “Electronic textbook of lung anatomy,” 1993.
- [14].Mazziotta J, Toga A, Evans A, Fox P, and Lancaster J et al. , “A four-dimensional probabilistic atlas of the human brain,” J. Ame. Med. Info. Assoc, vol. 8, pp. 401–430, 2001. [DOI] [PMC free article] [PubMed] [Google Scholar]
- [15].Thompson PM Mega M, Woods R, Blanton R, Moussai J, Zoumalan C, Aron J, Cummings J, and Toga AW, “A probabilistic atlas of the human brain in Alzheimer’s Disease: Emerging pattern of variability, asymmetry and degeneration,” in Proc. 5th International Conf. on Functional Mapping of the Human Brain, Dusseldorf, June 1999. [Google Scholar]
- [16].Thompson P and Toga A, “A framework for computational anatomy,” Computing and Visualization in Science, vol. 5, pp. 13–34, 2002. [Google Scholar]
- [17].Miller M, Banerjee A, Christensen GE, Joshi S, Khaneja N, Grenander U, and Matejic L, “Statistical methods in computational anatomy,” Statistical Methods in Medical Research, vol. 6, pp. 267–299, 1997. [DOI] [PubMed] [Google Scholar]
- [18].Christensen GE, Johnson HJ, Haller JW, Vannier MW, and Marsh JL, “Synthesizing average 3D anatomical shapes using deformable templates,” in Medical Imaging 1999: Image Processing, Hanson KM, Ed., February 1999, Proceedings of SPIE; Vol. 3661, pp. 574–582. [Google Scholar]
- [19].Johnson HJ, Christensen GE, Marsh JL, and Vannier MW, “Validation of probabilistic anatomical shape atlases,” in Medical Imaging 2000: Image Processing, Hanson KM, Ed., February 2000, Proceedings of SPIE; Vol. 3979, pp. 687–697. [Google Scholar]
- [20].Zhang L and Reinhardt JM, “Detection of lung lobar fissures using fuzzy logic,” in Proc. SPIE Conf. Medical Imaging, 1999, vol. 3660, pp. 188–199. [Google Scholar]
- [21].Zhang Li, Reinhardt Joseph M., McLennan Geoffrey, and Hoffman Eric A., “Lung lobe segmentation for quantitative assessment of pulmonary anatomy and physiology in volumetric X-ray CT images,” in Proc. of Rad. Soc. of North Ame. Annual Meeting, 2002. [Google Scholar]
- [22].G. E. Christensen, H. Johnson, C. Blake, and J. Dill, “GEC lab software reference manual (v1.7),” October 2002.