

ABSTRACT
Background
Dietary protein and micronutrients are important to the maintenance of bone health and may be an effective countermeasure to weight-loss–associated bone loss.
Objectives
We aimed to determine the effect of a 6-mo hypocaloric, nutritionally complete, higher-protein meal plan on change in bone density and quality as compared with weight stability in older adults using a randomized post-test design. We hypothesized that participants randomly assigned to this meal plan would maintain similar bone density and quality to weight-stable controls, despite significant reductions in body mass.
Methods
Ninety-six older adults (aged 70.3 ± 3.7 y, 74% women, 27% African American) with obesity [body mass index (kg/m2): 35.4 ± 3.3] were randomly assigned to a 6-mo hypocaloric, nutritionally complete, higher-protein meal plan targeting ≥1.0 g protein · kg body weight–1 · d–1 [weight-loss (WL) group; n = 47] or to a weight-stability (WS) group targeting 0.8 g protein · kg body weight–1 · d–1, the current Recommended Dietary Allowance (n = 49). The primary outcome was total hip bone mineral density (BMD), with femoral neck BMD, lumbar spine BMD, and lumbar spine trabecular bone score (TBS) as secondary outcomes, all assessed at baseline and 3 and 6 mo with dual-energy X-ray absorptiometry.
Results
Baseline total hip, femoral neck, and lumbar spine BMDs were 1.016 ± 0.160, 0.941 ± 0.142, and 1.287 ± 0.246 g/cm2, respectively; lumbar TBS was 1.398 ± 0.109. Despite significant weight loss achieved in the WL group (6.6 ± 0.4 kg; 8.6% ± 0.4% of baseline weight), 6-mo regional BMD estimates were similar to those in the WS group (all P > 0.05). Lumbar spine TBS significantly increased at 6 mo in the WL group (mean: 1.421; 95% CI: 1.401, 1.441) compared with the WS group (1.390: 95% CI: 1.370, 1.409; P = 0.02).
Conclusions
Older adults following a hypocaloric, nutritionally complete, higher-protein meal plan maintained similar bone density and quality to weight-stable controls. Our data suggest that adherence to this diet does not produce loss of hip and spine bone density in older adults and may improve bone quality. This trial was registered at clinicaltrials.gov as NCT02730988.
Keywords: bone mineral density, obesity, older adults, protein, trabecular bone score, weight loss, weight stability
Introduction
By 2030, half of the 72 million Americans aged >65 y will be obese (1, 2). Recent data implicate obesity in osteoporosis progression (3, 4), a significant concern for aging adults (5, 6). Although associated medical complications highlight the need to treat obesity in older adults, weight loss is also associated with increased osteoporotic fracture risk (7–11).
The association between weight loss and fracture risk is thought to be due, at least in part, to reduced bone mineral density (BMD) (12), with randomized controlled trials (RCTs) attributing 10% of weight loss to 1–4% of bone loss, depending on the site (13, 14). Several strategies have been proposed to mitigate bone loss associated with weight reduction, including dietary factors such as protein, calcium, and vitamin D. In observational studies, higher dietary protein is associated with reduced fracture risk and improved BMD [which may be driven mechanistically by protein-associated increases in insulin-like growth factor (IGF) and calcium absorption] (14, 15) and may prove critical to offset weight-loss–associated bone loss in older adults. A recent position statement recommends 1.0–1.2 g protein · kg–1 · d–1 for older adults to preserve fat-free mass and function (16), although few studies have examined its impact during intentional weight loss, perhaps due to practical difficulties.
Seven RCTs of weight loss in overweight and obese adults examined protein intake effects on regional BMD (5, 17–22). Results were largely null, with only 2 reporting attenuated BMD losses with higher protein intake (20, 22), although for most, bone outcomes were secondary endpoints and several studies had <6-mo durations, which may not be sufficient to capture BMD changes (19, 22). The one study with a weight-stable control lasted only 11 wk (22), below the 6 mo necessary to reliably measure BMD changes (23–25). The current literature is also limited in its ability to generalize to older men and women (i.e., no study specifically recruited ages >65 y and only 4 studies included men) (5, 17–19).
This study aimed to determine the effect of a 6-mo hypocaloric, nutritionally complete, higher-protein meal plan (targeting ≥1.0 g · kg–1 · d–1) on change in bone density and quality compared with weight stability (with protein intake at the Recommended Dietary Allowance, ∼0.8 g · kg–1 · d–1) in older men and women with obesity. The primary outcome of this analysis was dual-energy X-ray absorptiometry (DXA)–acquired hip areal BMD, complemented by femoral neck and lumbar spine areal BMD, and lumbar spine trabecular bone score (TBS). The addition of TBS to areal BMD improves fracture risk prediction (26); however, the effect of a hypocaloric, nutritionally complete, higher-protein meal plan on TBS is unknown. We hypothesized that participants randomly assigned to a hypocaloric, nutritionally complete, higher-protein meal plan would maintain similar bone density and quality to the weight-stable group, despite reductions in body mass.
Methods
This study (NCT02730988) was a 6-mo parallel RCT conducted at Wake Forest University to compare the effects of a nutritionally complete, higher-protein meal plan during weight loss, as opposed to weight stability, on changes in mobility, total body mass, fat mass, lean mass, BMD, and TBS in 96 participants using a 1:1 allocation ratio. The study design, baseline characteristics, and intervention effects on mobility (primary outcome assessed using the fast 400-m walk test) and body composition (total body, fat, and lean mass) are reported in a separate publication (27). The current study represents an ancillary analysis and focuses on the interventional effect on BMD and TBS outcomes.
Study participants
Participants were enrolled using the following inclusion criteria: 1) aged 65–79 y; 2) BMI (kg/m2) of 30–40; 3) self-reported mobility disability (difficulty walking one-quarter of a mile or climbing stairs/performing house/yard work); 4) sedentary lifestyle (self-report of less than six 10-min bouts of moderate-pace walking/wk); 5) nonsmoking (<1 cigarette/d or 4/wk within 1 y); 6) weight stable (<5% weight change in the past 6 mo); 7) not dependent on a cane or walker; 8) without comorbidities for which the intervention was contraindicated, including insulin-dependent or uncontrolled diabetes, uncontrolled hypertension, renal disease, heart disease, cancer requiring treatment in the past year, and severe systemic disease (i.e., Parkinson disease, chronic liver disease, systemic rheumatic condition, gout, thyroid disease); and 9) willing to follow the dietary protocol. The Wake Forest School of Medicine Institutional Review Board approved the study, and all participants provided written informed consent before enrollment. Enrolled participants were randomly assigned in 5 waves (n = 12–22 participants/wave) to a 6-mo hypocaloric, nutritionally complete, higher-protein meal plan targeting ≥1.0 g protein · kg body weight–1 · d–1 [weight-loss (WL) group; n = 47] or to a weight-stability group (WS group; n = 49). DPB generated a random allocation sequence using a Web-based randomization scheme with blocking stratified by sex to assign participants to the WL and WS groups. Group assignments were blinded to the lead outcomes assessor, and participants were asked to refrain from discussing their assignments during the testing sessions.
Intervention descriptions
Weight-loss intervention
Intentional weight loss in the WL group was achieved through the Medifast 4 & 2 & 1 Plan, hereafter referred to as the “nutritionally complete, higher-protein meal plan.” This weight-loss plan includes 4 meal-replacement products [∼377–460 kJ (∼90–110 kcal) and 11–15 g protein each], 2 lean and green meals [each 142–198 g (5–7 ounces) lean protein, 3 nonstarchy vegetable servings, and ≤2 healthy fat servings], and 1 healthy snack (1 serving of fruit, dairy, or grain). Overall, this meal plan is estimated to provide ∼4602–5439 kJ (1100–1300 kcal), 120–150 g protein, 85–100 g carbohydrate, 30–45 g fat, and, of relevance to bone health, ∼1000–1600 mg Ca and 300–600 IU vitamin D/d. A registered dietitian provided individual nutritional counseling and led 12 biweekly behavioral counseling groups offering support and weight-control guidance (self-monitoring, portion control, mindful eating, and overcoming weight-loss barriers). Participants were encouraged to maintain their baseline level of physical activity and complete daily logs on their use of the meal replacement products, which were reviewed biweekly to verify diet compliance.
Weight-stable intervention
The WS participants attended 12 biweekly group behavioral educational sessions on topics such as What Is Successful Aging, Managing Medications Effectively, and Talking Effectively with Your Healthcare Provider. WS participants were encouraged to maintain their baseline dietary and physical activity habits during the intervention and were weighed at the biweekly sessions to ensure weight stability was being maintained (within ±5% of baseline).
Measures
Intervention compliance
All participants were weighed biweekly using a Health-o-Meter Professional 349KLX Digital Floor Medical Scale (Pelstar LLC). Weights from the first (immediately before random assignment) and last intervention visits were used to calculate the total weight lost. Intervention compliance was also monitored using group session attendance, daily self-reported meal-replacement intake (in the WL group only), and 24-h urinary nitrogen–estimated protein intake at baseline and 6 mo. Participant urine was collected over a 24-h period to obtain a 24-h urinary nitrogen excretion amount in grams (U), which was adjusted by the participant's weight in kilograms (W) to estimate daily protein intake in grams (Equation 1) (28). Prior research indicates near-complete agreement between protein intake assessed via a 28-d diet in a metabolic suite and urine estimation (29):
 |
(1) |
Bone outcomes
DXA scans (iDXA; GE Medical Systems) were acquired at baseline and at 3 and 6 mo to measure the primary outcome of this analysis (total hip areal BMD) and secondary outcomes (femoral neck areal BMD, L1–L4 vertebrae areal BMD, and TBS at the L1–L4 vertebrae). Using the baseline DXA scans, participants with a T-score between –1 and –2.5 at any site were classified as osteopenic. Partially degraded (1.20 < TBS < 1.35) or degraded (TBS ≤1.20) trabecular bone microarchitecture in the lumbar spine was identified from baseline lumbar spine TBS. All scans were performed following the manufacturer's recommendations for participant positioning, with CVs from repeated measurements of <2.0% and 4% for all BMD and TBS outcomes, respectively. All scans were analyzed in accordance with recommendations by the International Society for Clinical Densitometry.
Relevant covariates
Age, gender, and ethnicity were recorded based on participant self-report at baseline. Height and weight were measured without shoes and outer garments at the first screening visit and used to calculate baseline BMI. Due to the reported associations of proinflammatory cytokines with BMD (30), plasma concentrations of IL-6 and C-reactive protein (CRP) at baseline and 6 mo were assessed as covariates, as previously described (31).
Statistical analysis
Baseline descriptive statistics were calculated overall and by treatment group. Session attendance was calculated as the total number of sessions attended divided by the number expected for participants who completed the full study. Intervention compliance was assessed by comparing urinary nitrogen–estimated protein intake across treatment groups at 6 mo using a general linear model adjusted for baseline urinary nitrogen amounts and gender. Body-weight estimates were produced from a mixed model using treatment assignment, visit, and treatment × visit interaction, assuming an autoregressive covariance structure, and comparisons both within and between groups were performed using contrast statements.
The analyses of BMD and TBS outcome measures were conducted assuming intent-to-treat and analyzed using a mixed-model fit with treatment group, time, and the treatment × time interaction as the main effect, adjusted for baseline values of the outcome and gender. Effect sizes and 95% CIs were calculated from the mean 6-mo change in outcome within each group and the SD of the 6-mo change in outcome within the total sample. Six-month changes in bone outcomes, body weight, protein intake, and inflammatory markers were computed relative to baseline values for the WL participants, and pairwise correlations were examined. These findings should be considered exploratory because the main trial's a priori power considerations were focused on the 400-m walk test, and consequently we do not account for multiple outcomes with regard to the bone data. All statistical analyses were conducted using SAS version 9.4 (SAS Institute) based on a 0.05 level of significance.
Results
Recruitment and retention
Recruitment took place over 12 mo from 18 September 2015 to 14 September 2016. Baseline and follow-up DXA assessments were conducted from 18 September 2015 to 24 March 2017. A total of 82 participants completed the study and returned for 6-mo follow-up testing (85.4% retention). Exclusion for participant hardware, artifacts, and poor positioning resulted in the following baseline, 3-mo, and 6-mo sample sizes for bone outcome measures, respectively: total hip/femoral neck BMD (n = 95, n = 83, n = 79), lumbar spine BMD (n = 82, n = 70, n = 68), and lumbar spine TBS (n = 82, n = 68, n = 67) (see Figure 1). Urinary nitrogen–estimated protein intake at baseline and at 6 mo was available for 80 participants who returned for follow-up. Demographic characteristics did not differ materially between participants who completed the intervention and those who were lost to follow-up (all P > 0.05).
FIGURE 1.

CONSORT flow diagram. BMD, bone mineral density; BP, blood pressure; CONSORT, Consolidated Standards of Reporting Trials; Dx, diagnosis; DXA, dual-energy X-ray absorptiometry; TBS, trabecular bone score; WL, weight-loss; WS, weight-stability.
Baseline participant characteristics
Baseline characteristics of the participants are summarized overall and by group in Table 1. Briefly, a total of 96 participants (aged 70.3 ± 3.7 y, 74% women, 27% African American) with obesity (BMI: 35.4 ± 3.3) were randomly assigned to the WL group (n = 47) or the WS group (n = 49). Baseline urinary nitrogen–estimated protein intake was similar between groups (0.77 ± 0.19 and 0.77 ± 0.22 g · kg–1 · d–1 for WL and WS groups, respectively). At baseline, total hip, femoral neck, and lumbar spine BMDs were 1.016 ± 0.160, 0.941 ± 0.142, and 1.287 ± 0.246 g/cm2, respectively; and lumbar spine TBS was 1.398 ± 0.109. Based on T-scores acquired from the baseline DXA scans, 11% of the participants had osteopenia. Partially degraded or degraded lumbar spine trabecular bone microarchitecture was indicated by baseline TBS in 27% and 5% of the participants, respectively.
TABLE 1.
Baseline descriptive characteristics of randomly assigned participants according to treatment group1
| Overall (n = 96) | Weight-loss group (n = 47) | Weight-stable group (n = 49) | |
|---|---|---|---|
| Age, y | 70.3 ± 3.7 | 71.4 ± 3.9 | 69.2 ± 3.1 |
| Female, n (%) | 71 (74.0) | 35 (74.5) | 36 (73.5) |
| Race, n (%) | |||
| African American | 26 (27.1) | 13 (27.7) | 13 (26.5) |
| Caucasian | 69 (71.9) | 33 (70.2) | 36 (73.5) |
| Body weight, kg | 97.1 ± 14.9 | 96.1 ± 16.8 | 98.0 ± 12.9 |
| BMI, kg/m2 | 35.4 ± 3.3 | 35.2 ± 3.5 | 35.6 ± 3.1 |
| Self-reported physical activity, min/wk | 7.0 ± 28.1 | 8.6 ± 35.6 | 5.4 ± 17.5 |
| DXA-acquired bone outcomes | |||
| Total hip BMD, g/cm2 | 1.016 ± 0.160 | 1.016 ± 0.145 | 1.017 ± 0.175 |
| Femoral neck BMD, g/cm2 | 0.941 ± 0.142 | 0.934 ± 0.133 | 0.948 ± 0.152 |
| Lumbar spine (L1–L4) BMD, g/cm2 | 1.287 ± 0.246 | 1.321 ± 0.267 | 1.254 ± 0.222 |
| TBS, lumbar spine | 1.398 ± 0.109 | 1.386 ± 0.112 | 1.409 ± 0.106 |
| T-score | |||
| Total | 0.375 ± 1.106 | 0.383 ± 1.062 | 0.368 ± 1.159 |
| Femoral neck | 0.599 ± 1.107 | 0.547 ± 1.078 | 0.649 ± 1.144 |
| Lumbar spine (L1–L4) | 2.082 ± 2.165 | 2.405 ± 2.369 | 1.774 ± 1.930 |
| Osteopenia, n (%) | 10 (10.5) | 5 (10.6) | 5 (10.4) |
| Partially degraded TBS, n (%) | 22 (26.8) | 9 (23.1) | 13 (30.2) |
| Degraded TBS, n (%) | 4 (4.9) | 4 (10.3) | 0 (0.0) |
1Values are means ± SDs unless otherwise indicated. BMD, bone mineral density; DXA, dual-energy X-ray absorptiometry; TBS, trabecular bone score.
Intervention compliance
Among those who completed the intervention, session attendance was 88% and 84% for the WL and WS groups, respectively, and mean (95% CI) self-reported physical activity levels at 6 mo did not differ by group or time [WL: 48.37 (6.09, 90.66) min/wk; WS: 30.13 (–14.28, 74.54) min/wk; P > 0.05]. The 4 meal-replacement products provided 44–60 g protein/d, and self-reported compliance to the meal replacement protocol in the WL group was 92.7% (91.1% reporting >80% compliance), with a mean ± SD of 3.7 ± 0.3 meal-replacement products consumed/d. At 6 mo, mean (95% CI) urinary nitrogen–estimated protein intake was 0.94 (0.87, 1.02) g · kg–1 · d–1 in WL participants and 0.76 (0.68, 0.83) g · kg–1 · d–1 in WS participants (P < 0.01). For the WL group, this represented a significant 12% increase from baseline values (P = 0.04). Measures of renal and hepatic function (creatinine, estimated glomerular filtration rate, aspartate aminotransferase, alanine transaminase, bilirubin, alkaline phosphatase, albumin serum, total serum protein) were stable over the 6-mo study period (P > 0.05) and did not differ between groups (P > 0.05). Blood urea nitrogen was elevated in the WL group at 6 mo (baseline—mean: 17.14; 95% CI: 15.94, 18.33 mg/dL; WL, 6 mo—mean: 19.71; 95% CI: 18.43, 20.99 mg/dL; WS, 6 mo—mean: 16.31; 95% CI: 14.97, 17.64 mg/dL; P < 0.01) but was within the normal clinical range and indicative of increased protein intake in the WL group (32). WL participants lost a mean ± SD of 6.6 ± 0.4 kg (8.6% ± 0.4% baseline weight) and WS participants maintained weight stability (–0.2 ± 0.5 kg; group × time, P < 0.01). Eighty-seven percent of the total body mass was lost as fat in the WL group, with minimal fat loss in the WS group (WL—mean: 37.17; 95% CI: 36.12, 38.21 kg; WS—mean: 43.68; 95% CI: 42.62, 44.74 kg; P < 0.001). Lean mass loss was minimal and did not differ between groups (WL—mean: −0.81; 95% CI: −1.40, −0.23 kg; WS—mean: −0.24; 95% CI: −0.85, 0.36 kg; P > 0.05).
Treatment effects on bone outcomes
The treatment effect on BMD and TBS measures was assessed using data from the 80 participants with complete DXA data at baseline and at 3 and 6 mo (WL: n = 41; WS: n = 39). Despite significant weight loss achieved in the WL group, total hip BMD, femoral neck BMD, lumbar spine BMD, and TBS were not significantly reduced at 6 mo relative to the WS group (P > 0.05). Although total hip BMD declined slightly from baseline in the WL group, a differential treatment effect was not observed for the change in total hip BMD at 6 mo (WL—mean: −0.011; 95% CI: −0.019, −0.003 g/cm2; WS—mean: −0.002; 95% CI: −0.010, 0.007 g/cm2; effect size: −0.34; 95% CI: −0.75, 0.06; Figure 2). Similarly, no differential treatment effect was observed for the change in femoral neck BMD at 6 mo (WL—mean: −0.004; 95% CI: −0.013, 0.006 g/cm2; WS—mean: 0.005; 95% CI: −0.005, 0.015 g/cm2; effect size: −0.31; 95% CI: −0.71, 0.09; Figure 2). Lumbar spine BMD was improved from baseline in both groups at 6 mo but did not differ by treatment group (WL—mean: 0.004; 95% CI: −0.007, 0.016 g/cm2; WS—mean: 0.007; 95% CI: −0.004, 0.018 g/cm2; effect size: −0.10; 95% CI: −0.50, 0.30; Figure 3). The 6-mo TBS at the lumbar spine was significantly higher in the WL group than in the WS group (WL—mean: 1.421; 95% CI: 1.401, 1.441; WS—mean: 1.390; 95% CI: 1.370, 1.409; P = 0.02; Figure 3). Furthermore, only the WL group showed an average improvement in TBS relative to baseline (WL—mean: 0.022; 95% CI: 0.002, 0.042; WS—mean: −0.009; 95% CI: −0.029, 0.010; effect size: 0.53; 95% CI: 0.13, 0.94; P = 0.02).
FIGURE 2.
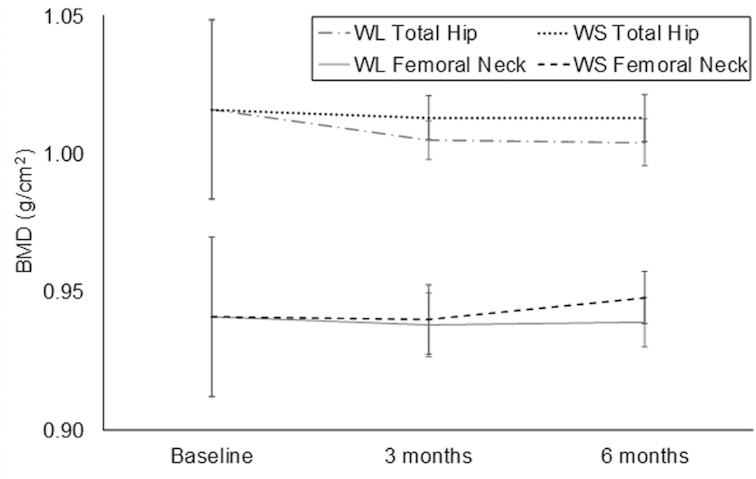
Treatment effect on dual-energy X-ray absorptiometry–acquired total hip BMD and femoral neck BMD. Values are means (95% CIs) and generated using a mixed-model fit with treatment, time, and treatment × time interaction, adjusted for baseline values of the outcome and gender. P values for treatment, time, and treatment × time interaction were not significant (P > 0.05). Baseline, 3-mo, and 6-mo sample sizes: WL group (n = 47, 44, and 41); WS group (n = 48, 39, and 38). BMD, bone mineral density; WL, weight-loss; WS, weight-stability.
FIGURE 3.
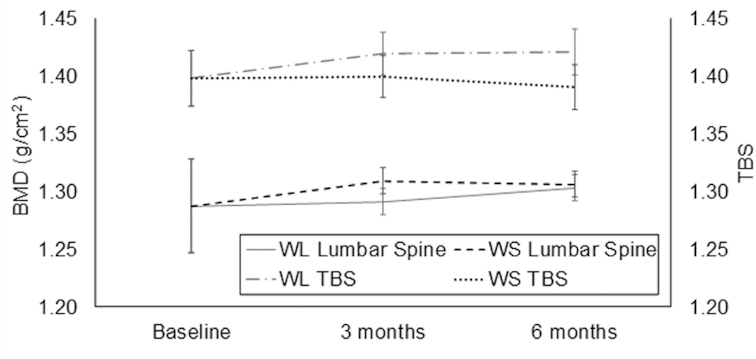
Treatment effect on dual-energy X-ray absorptiometry–acquired lumbar spine BMD (g/cm2) and TBS (unitless). Values are means (95% CIs) and generated using a mixed-model fit with treatment, time, and treatment × time interaction, adjusted for baseline values of the outcome and gender. The WL group showed a significant improvement at 6 mo in TBS relative to baseline (P = 0.02), with the 6-mo TBS being significantly higher in the WL group than in the WS group (P = 0.02). Treatment × time interaction P values indicated the treatment effect on the lumbar spine BMD differed significantly at 3 mo compared with 6 mo (P = 0.04) but not for the TBS (P = 0.297). Baseline, 3-mo, and 6-mo sample sizes: WL lumbar spine BMD (n = 40, 37, and 35); WS lumbar spine BMD (n = 42, 33, and 33); WL TBS (n = 39, 35, and 34); WS TBS (n = 43, 33, and 33). BMD, bone mineral density; TBS, trabecular bone score; WL, weight-loss; WS, weight-stability.
Body weight, protein intake, and bone outcome correlations in WL participants
Correlations between the 6-mo change in bone outcomes and the 6-mo change in body weight, protein intake, IL-6, and CRP are reported for the WL participants (n = 41) in Table 2. TBS and weight changes were negatively correlated, indicating that TBS improved with more weight loss (P < 0.001). Positive correlations suggest that increasing protein intake improves TBS, although these trends were not significant. Increased protein intake (grams per day) was correlated with more lumbar spine BMD loss (P = 0.04), although this trend was not significant when protein intake was normalized for body weight (grams per kilogram per day). Greater increases in protein intake were correlated with more weight loss (P = 0.04), which may partly explain the negative correlations between changes in protein intake and BMD. No significant correlations were observed between changes in bone outcomes and IL-6 and CRP plasma concentrations.
TABLE 2.
Pairwise correlations between 6-mo changes (Δ) in body weight, protein intake, biochemical markers, and bone outcomes in weight-loss participants1
| Independent variable, Δ | Dependent variable, Δ | n | Correlation | P |
|---|---|---|---|---|
| Weight, kg | Total hip BMD, g/cm2 | 41 | +0.215 | >0.05 |
| Femoral neck BMD, g/cm2 | 41 | −0.045 | >0.05 | |
| Lumbar spine BMD, g/cm2 | 35 | −0.266 | >0.05 | |
| Lumbar spine TBS | 34 | −0.609 | <0.01* | |
| Protein, g/d | 42 | −0.198 | >0.05 | |
| Protein, g · kg–1 · d–1 | 42 | −0.320 | 0.04* | |
| Protein, g/d | Total hip BMD, g/cm2 | 40 | −0.130 | >0.05 |
| Femoral neck BMD, g/cm2 | 40 | −0.042 | >0.05 | |
| Lumbar spine BMD, g/cm2 | 34 | −0.353 | 0.04* | |
| Lumbar spine TBS | 33 | +0.116 | >0.05 | |
| Protein, g · kg–1 · d–1 | Total hip BMD, g/cm2 | 40 | −0.152 | >0.05 |
| Femoral neck BMD, g/cm2 | 40 | −0.044 | >0.05 | |
| Lumbar spine BMD, g/cm2 | 34 | −0.317 | >0.05 | |
| TBS | 33 | +0.150 | >0.05 | |
| IL-6, pg/mL | Total hip BMD, g/cm2 | 40 | −0.002 | >0.05 |
| Femoral neck BMD, g/cm2 | 40 | −0.011 | >0.05 | |
| Lumbar spine BMD, g/cm2 | 35 | +0.092 | >0.05 | |
| TBS | 34 | +0.046 | >0.05 | |
| CRP, mg/L | Total hip BMD, g/cm2 | 40 | +0.181 | >0.05 |
| Femoral neck BMD, g/cm2 | 40 | −0.083 | >0.05 | |
| Lumbar spine BMD, g/cm2 | 35 | +0.225 | >0.05 | |
| TBS | 34 | +0.185 | >0.05 |
1*P < 0.05. BMD, bone mineral density; CRP, C-reactive protein; TBS, trabecular bone score.
Discussion
Results show that the nutritionally complete, higher-protein meal plan (targeting >1.0 g protein · kg–1 · d–1) is an effective way for older adults with obesity to preserve bone health while losing ∼9% of their body weight over a 6-mo period. Whereas the urinary nitrogen–estimated protein intake of the WS participants was slightly lower than the current Recommended Dietary Allowance (0.77 g · kg–1 · d–1), WL participants increased their urinary nitrogen–estimated protein intake to levels approaching the 1.0 g · kg–1 · d–1 recommendation for older adults (16) (0.94 g · kg–1 · d–1; a 12% increase from baseline). As we hypothesized, total hip, femoral neck, and lumbar spine BMD did not differ between the WL or WS groups at follow-up. The fact that we did not observe a decrement in BMD with weight loss in this study is clinically valuable because prior studies of ≥6 mo duration have associated bone loss with the amount of weight loss achieved (12–14). In addition, TBS at the lumbar spine increased from baseline and was significantly higher in the WL participants than in the WS participants, suggesting that adhering to a nutritionally complete, higher-protein meal plan during weight loss may improve vertebral trabecular bone microarchitecture.
Results from this study support the benefits of higher protein intake on older adult bone quality recommended by the PROT-AGE study group (16), as well as evidence on the importance of maintaining adequate calcium and vitamin D intake during weight loss (14, 33–36). Findings also align with a recent systematic review and meta-analysis that found moderate evidence that higher protein intake causes less lumbar spine BMD loss than lower protein intake in older adults, with positive trends in BMD at other bone sites (24). RCTs and cohort studies included in this review were highly heterogeneous, with varying protein doses and dietary compositions, which may explain the lack of significance in some outcomes. It is noteworthy that many of the RCTs that found attenuation of lumbar, total hip, and total body BMD losses with higher protein intake were weight-loss trials, suggesting that the osteoprotective properties of higher protein intake may be more pronounced in individuals who are intentionally losing weight (18, 20).
Although increasing dietary protein increases endogenous calcium excretion, harmful effects on the skeleton are not observed if calcium intake is adequate (35). Increasing dietary protein while maintaining adequate calcium and vitamin D intake may preserve bone health in older adults by attenuating the decrease in calcium absorption and circulating IGF-I and IGF binding protein-3 that is associated with intentional weight loss (14, 15, 37). Serum IGF-I increases osteoblast differentiation and BMD (38); thus, elevating IGF-I through higher protein intake during weight loss may promote bone formation. With controlled calcium (1200 mg/d) and vitamin D (400 IU/d) intake, attenuation of bone loss in participants consuming a higher-protein diet (24% of total energy) has also been attributed to higher serum IGF-I and IGF binding protein-3 and lower bone resorption after weight loss, in comparison with participants consuming a normal-protein diet (18% of total energy) (20). Although we were not able to confirm this in our study because we did not measure IGF-I or calcium absorption, we encourage the collection of these measures in future weight-loss studies with varying protein content.
Novel strengths of this study include specific recruitment of older men and women (aged ≥65 y) and inclusion of a weight-stable control group to account for the effect of age itself on change in bone density and quality. Additional strengths include excellent participant compliance measured using multiple methods including 24-h urinary nitrogen excretion, the use of DXA to acquire BMD and TBS measurements, and a sufficient study duration (6 mo) to capture changes due to bone remodeling (23–25). However, future studies with a longer follow-up period (12–24 mo) are warranted because the bone remodeling transient can affect bone resorption and formation beyond 6 mo (25). Although the inflammatory markers examined in this study (IL-6 and CRP) were not significantly correlated with BMD and TBS, studying other markers of bone turnover is encouraged in future research to provide an early and sensitive indication of BMD response to weight reduction. Although prior studies have shown bone loss after a 6-mo intervention, a longer duration may have produced further bone loss (14). However, the goal of this study was to examine bone immediately after the 6-mo WL or WS intervention, because weight regain or maintenance over a longer follow-up time postintervention could affect bone remodeling. The nutritionally complete, higher-protein meal plan provided protein derived from a combination of plant, animal, and dairy sources; however, we did not control for the effects that protein source may have on bone quality and fracture risk (22, 39, 40). The meal plan provides 1000–1600 mg Ca/d and 300–600 IU vitamin D/d, which is higher than the typical dietary intakes of 750–950 mg Ca/d and 150–225 IU vitamin D/d in older adults (41), which suggests elevated calcium and vitamin D intake in our WL participants compared with WS participants. Although we obtained an estimate of protein intake via urinary nitrogen, a single 24-h urinary collection on a given day may not be reliable to reflect habitual protein intake. We did not measure protein, calcium, or other nutrient intakes, which is a limitation. Without a WL group with similar protein intake to that of the WS group as a control, we can only suggest, with supporting evidence from prior studies, that the effects of the nutritionally complete, higher-protein meal plan on bone outcomes in this study could be attributed to higher protein (20, 22), calcium (33, 34), vitamin D, or a combination thereof (18). Medication and supplement use within the study population was not collected, which is a limitation. Changes in other lifestyle factors were also not measured; however, because this was an RCT, confounding variables are assumed to be equally distributed among groups so as to not differentially bias results. In addition, although DXA is the clinical standard for BMD assessment, the presence of adipose tissue can affect measurement accuracy (42, 43). The sensitivity of DXA may be limited in detecting differences between the WL and WS groups; however, prior RCTs investigating the effect of dietary protein on bone have detected differential bone loss between intervention groups using DXA (24). Future studies may address this by acquiring volumetric bone measurements from computed tomography, which is less susceptible to measurement error from obesity or weight loss (44). Furthermore, due to the lack of an a priori power calculation, these data are presented as hypothesis-generating rather than confirmatory, so these data were not collected with a specific goal of reaching significant findings.
In conclusion, we found that adhering to a nutritionally complete, higher-protein meal plan during intentional weight loss is effective in preserving bone health among older adults with obesity. Future studies should explore the effect of protein intake during weight loss using volumetric measures of bone quality acquired with computed tomography and examine if a treatment effect is enhanced with higher amounts of protein intake or longer periods of follow-up.
Acknowledgements
We are indebted to our project manager and registered dietitian Beverly Nesbit, our lead assessor Jessica Sheedy, our DXA technician Sherri Ford, and Jessica Kiel and Linda Arterburn of the Medifast team for their contributions related to the supervision and conduct of the trial. Laura Welti, Amy Collins, and Lauren Shaver are acknowledged for their help during the intervention sessions; and Katelyn Greene is acknowledged for her assistance with the literature review.
The authors’ responsibilities were as follows—KMB: designed the research; RMH and KMB: conducted the research; AAW, DPB, and KMB: analyzed the data and performed the statistical analysis; AAW, DPB, ACB, and KMB: wrote the manuscript; DKH, SAS, RMH, DPB, and MFL: contributed to data interpretation, the content of the manuscript, and revisions; AAW and KMB: had primary responsibility for final content; and all authors: read and approved the final manuscript. KMB and DPB report funding from Jason Pharmaceuticals, Inc., a wholly owned subsidiary of Medifast, Inc. AAW, ACB, and KMB report a National Science Foundation REU Site grant (award no. 1559700) during the conduct of the study. DKH and KMB report grants from the NIH outside the submitted work. DPB is married to KMB. MFL, RMH, and SAS reported no conflicts of interest related to the study.
Notes
Supported by a grant from Jason Pharmaceuticals, Inc., a wholly owned subsidiary of Medifast, Inc., as well as the Wake Forest Claude D Pepper Older Americans Independence Center (P30 AG21332), a National Institute on Aging–supported career development award (K01 AG047921) (to KMB), and a National Science Foundation Research Experiences for Undergraduates Site grant (award 1559700) (to AAW, ACB, and KMB).
Researchers within the Department of Scientific and Clinical Affairs of Medifast, Inc., provided input on the study design, but were not involved with the implementation of the study or the analysis and interpretation of the data.
Abbreviations used: BMD, bone mineral density; CRP, C-reactive protein; DXA, dual-energy X-ray absorptiometry; IGF, insulin-like growth factor; RCT, randomized controlled trial; TBS, trabecular bone score; WL group, weight-loss group; WS group, weight-stability group.
References
- 1. He W, Sengupta M, Velkoff VA, DeBarros KA. US Census Bureau, editor. Current population reports, P23–209. 65+ in the United States: 2005. Washington (DC): US Government Printing Office; 2005. [Google Scholar]
- 2. Wang YC, McPherson K, Marsh T, Gortmaker SL, Brown M. Health and economic burden of the projected obesity trends in the USA and the UK. Lancet. 2011;378(9793):815–25. [DOI] [PubMed] [Google Scholar]
- 3. Zhu K, Hunter M, James A, Lim EM, Walsh JP. Associations between body mass index, lean and fat body mass and bone mineral density in middle-aged Australians: the Busselton Healthy Ageing study. Bone. 2015;74:146–52. [DOI] [PubMed] [Google Scholar]
- 4. Compston JE, Watts NB, Chapurlat R, Cooper C, Boonen S, Greenspan S, Pfeilschifter J, Silverman S, Díez-Pérez A, Lindsay R. Obesity is not protective against fracture in postmenopausal women: GLOW. Am J Med. 2011;124(11):1043–50. [DOI] [PMC free article] [PubMed] [Google Scholar]
- 5. Li Z, Treyzon L, Chen S, Yan E, Thames G, Carpenter CL. Protein-enriched meal replacements do not adversely affect liver, kidney or bone density: an outpatient randomized controlled trial. Nutr J. 2010;9(1):72. [DOI] [PMC free article] [PubMed] [Google Scholar]
- 6. Reginster J-Y, Burlet N. Osteoporosis: a still increasing prevalence. Bone. 2006;38(2):4–9. [DOI] [PubMed] [Google Scholar]
- 7. Crandall CJ, Yildiz VO, Wactawski-Wende J, Johnson KC, Chen Z, Going SB, Wright NC, Cauley JA. Postmenopausal weight change and incidence of fracture: post hoc findings from Women's Health Initiative Observational Study and Clinical Trials. BMJ. 2015;350:h25. [DOI] [PMC free article] [PubMed] [Google Scholar]
- 8. Ensrud KE, Cauley J, Lipschutz R, Cummings SR; Study of Osteoporotic Fractures Research Group. Weight change and fractures in older women. Arch Intern Med. 1997;157(8):857–63. [PubMed] [Google Scholar]
- 9. Langlois JA, Visser M, Davidovic LS, Maggi S, Li G, Harris TB. Hip fracture risk in older white men is associated with change in body weight from age 50 years to old age. Arch Intern Med. 1998;158(9):990–6. [DOI] [PubMed] [Google Scholar]
- 10. Lv QB, Fu X, Jin HM, Xu HC, Huang ZY, Xu HZ, Chi YL, Wu AM. The relationship between weight change and risk of hip fracture: meta-analysis of prospective studies. Sci Rep. 2015;5:16030. [DOI] [PMC free article] [PubMed] [Google Scholar]
- 11. Johnson KC, Bray GA, Cheskin LJ, Clark JM, Egan CM, Foreyt JP, Garcia KR, Glasser S, Greenway FL, Gregg EW et al.. The effect of intentional weight loss on fracture risk in persons with diabetes: results from the Look AHEAD randomized clinical trial. J Bone Miner Res. 2017;32(11):2278–87. [DOI] [PMC free article] [PubMed] [Google Scholar]
- 12. Marshall D, Johnell O, Wedel H. Meta-analysis of how well measures of bone mineral density predict occurrence of osteoporotic fractures. BMJ. 1996;312(7041):1254–9. [DOI] [PMC free article] [PubMed] [Google Scholar]
- 13. Zibellini J, Seimon RV, Lee CM, Gibson AA, Hsu MS, Shapses SA, Nguyen TV, Sainsbury A. Does diet-induced weight loss lead to bone loss in overweight or obese adults? A systematic review and meta-analysis of clinical trials. J Bone Miner Res. 2015;30(12):2168–78. [DOI] [PubMed] [Google Scholar]
- 14. Shapses SA, Sukumar D. Bone metabolism in obesity and weight loss. Annu Rev Nutr. 2012;32:287–309. [DOI] [PMC free article] [PubMed] [Google Scholar]
- 15. Heaney RP, Layman DK. Amount and type of protein influences bone health. Am J Clin Nutr. 2008;87(5):1567S–70S. [DOI] [PubMed] [Google Scholar]
- 16. Bauer J, Biolo G, Cederholm T, Cesari M, Cruz-Jentoft AJ, Morley JE, Phillips S, Sieber C, Stehle P, Teta D et al.. Evidence-based recommendations for optimal dietary protein intake in older people: a position paper from the PROT-AGE study group. J Am Med Dir Assoc. 2013;14(8):542–59. [DOI] [PubMed] [Google Scholar]
- 17. Tirosh A, de Souza RJ, Sacks F, Bray GA, Smith SR, LeBoff MS. Sex differences in the effects of weight loss diets on bone mineral density and body composition: POUNDS LOST trial. J Clin Endocrinol Metab. 2015;100(6):2463–71. [DOI] [PMC free article] [PubMed] [Google Scholar]
- 18. Thorpe MP, Jacobson EH, Layman DK, He X, Kris-Etherton PM, Evans EM. A diet high in protein, dairy, and calcium attenuates bone loss over twelve months of weight loss and maintenance relative to a conventional high-carbohydrate diet in adults. J Nutr. 2008;138(6):1096–100. [DOI] [PubMed] [Google Scholar]
- 19. Tang M, Leidy HJ, Campbell WW. Regional, but not total, body composition changes in overweight and obese adults consuming a higher protein, energy-restricted diet are sex specific. Nutr Res. 2013;33(8):629–35. [DOI] [PMC free article] [PubMed] [Google Scholar]
- 20. Sukumar D, Ambia-Sobhan H, Zurfluh R, Schlussel Y, Stahl TJ, Gordon CL, Shapses SA. Areal and volumetric bone mineral density and geometry at two levels of protein intake during caloric restriction: a randomized, controlled trial. J Bone Miner Res. 2011;26(6):1339–48. [DOI] [PMC free article] [PubMed] [Google Scholar]
- 21. Jesudason D, Clifton P. The interaction between dietary protein and bone health. J Bone Miner Metab. 2011;29(1):1–14. [DOI] [PubMed] [Google Scholar]
- 22. Campbell WW, Tang M. Protein intake, weight loss, and bone mineral density in postmenopausal women. J Gerontol A Biol Sci Med Sci. 2010;65(10):1115–22. [DOI] [PMC free article] [PubMed] [Google Scholar]
- 23. Weaver CM, Gordon CM, Janz KF, Kalkwarf HJ, Lappe JM, Lewis R, O'Karma M, Wallace TC, Zemel BS. The National Osteoporosis Foundation's position statement on peak bone mass development and lifestyle factors: a systematic review and implementation recommendations. Osteoporos Int. 2016;27(4):1281–386. [DOI] [PMC free article] [PubMed] [Google Scholar]
- 24. Shams-White MM, Chung M, Du M, Fu Z, Insogna KL, Karlsen MC, LeBoff MS, Shapses SA, Sackey J, Wallace TC et al.. Dietary protein and bone health: a systematic review and meta-analysis from the National Osteoporosis Foundation. Am J Clin Nutr. 2017;105(6):1528–43. [DOI] [PubMed] [Google Scholar]
- 25. Heaney RP. The bone remodeling transient: interpreting interventions involving bone-related nutrients. Nutr Rev. 2001;59(10):327–34. [DOI] [PubMed] [Google Scholar]
- 26. Harvey N, Glüer C, Binkley N, McCloskey E, Brandi M-L, Cooper C, Kendler D, Lamy O, Laslop A, Camargos B. Trabecular bone score (TBS) as a new complementary approach for osteoporosis evaluation in clinical practice. Bone. 2015;78:216–24. [DOI] [PMC free article] [PubMed] [Google Scholar]
- 27. Beavers KM, Nesbit BA, Kiel J, Sheedy JL, Arterburn LM, Collins AE, Ford SA, Henderson RM, Coleman CD, Beavers DP. Effect of an energy-restricted, nutritionally complete, higher protein meal plan on body composition and mobility in older adults with obesity: a randomized controlled trial. J Gerontol A Biol Sci Med Sci. 2018:doi.org/10.1093/gerona/gly146. [DOI] [PMC free article] [PubMed] [Google Scholar]
- 28. Maroni BJ, Steinman TI, Mitch WE. A method for estimating nitrogen intake of patients with chronic renal failure. Kidney Int. 1985;27(1):58–65. [DOI] [PubMed] [Google Scholar]
- 29. Bingham SA, Cummings JH. Urine nitrogen as an independent validatory measure of dietary intake: a study of nitrogen balance in individuals consuming their normal diet. Am J Clin Nutr. 1985;42(6):1276–89. [DOI] [PubMed] [Google Scholar]
- 30. Sponholtz TR, Zhang X, Fontes JD, Meigs JB, Cupples LA, Kiel DP, Hannan MT, McLean RR. Association between inflammatory biomarkers and bone mineral density in a community-based cohort of men and women. Arthritis Care Res (Hoboken). 2014;66(8):1233–40. [DOI] [PMC free article] [PubMed] [Google Scholar]
- 31. Beavers KM, Beavers DP, Newman JJ, Anderson AM, Loeser RF Jr, Nicklas BJ, Lyles MF, Miller GD, Mihalko SL, Messier SP. Effects of total and regional fat loss on plasma CRP and IL-6 in overweight and obese, older adults with knee osteoarthritis. Osteoarthritis Cartilage. 2015;23(2):249–56. [DOI] [PMC free article] [PubMed] [Google Scholar]
- 32. Hosten AO. BUN and creatinine. In: Walker HK, Hall WD, Hurst JWeditors. Clinical methods: the history, physical, and laboratory examinations. 3rd ed Boston: Butterworths; 1990. p. 874–8. [PubMed] [Google Scholar]
- 33. Riedt CS, Cifuentes M, Stahl T, Chowdhury HA, Schlussel Y, Shapses SA. Overweight postmenopausal women lose bone with moderate weight reduction and 1 g/day calcium intake. J Bone Miner Res. 2005;20(3):455–63. [DOI] [PMC free article] [PubMed] [Google Scholar]
- 34. Jensen LB, Kollerup G, Quaade F, Sorensen OH. Bone minerals changes in obese women during a moderate weight loss with and without calcium supplementation. J Bone Miner Res. 2001;16(1):141–7. [DOI] [PubMed] [Google Scholar]
- 35. Heaney RP. Excess dietary protein may not adversely affect bone. J Nutr. 1998;128(6):1054–7. [DOI] [PubMed] [Google Scholar]
- 36. Ross AC, Taylor CL, Yaktine AL, Del Valle HB, editors. Dietary Reference Intakes for calcium and vitamin D. Washington (DC): National Academies Press; 2011. [PubMed] [Google Scholar]
- 37. Kerstetter JE, O'Brien KO, Caseria DM, Wall DE, Insogna KL. The impact of dietary protein on calcium absorption and kinetic measures of bone turnover in women. J Clin Endocrinol Metab. 2005;90(1):26–31. [DOI] [PubMed] [Google Scholar]
- 38. Niu T, Rosen CJ. The insulin-like growth factor-I gene and osteoporosis: a critical appraisal. Gene. 2005;361:38–56. [DOI] [PubMed] [Google Scholar]
- 39. Langsetmo L, Shikany JM, Cawthon PM, Cauley JA, Taylor BC, Vo TN, Bauer DC, Orwoll ES, Schousboe JT, Ensrud KE et al.. The association between protein intake by source and osteoporotic fracture in older men: a prospective cohort study. J Bone Miner Res. 2017;32(3):592–600. [DOI] [PMC free article] [PubMed] [Google Scholar]
- 40. Langsetmo L, Barr SI, Berger C, Kreiger N, Rahme E, Adachi JD, Papaioannou A, Kaiser SM, Prior JC, Hanley DA et al.. Associations of protein intake and protein source with bone mineral density and fracture risk: a population-based cohort study. J Nutr Health Aging. 2015;19(8):861–8. [DOI] [PMC free article] [PubMed] [Google Scholar]
- 41. Bailey RL, Dodd KW, Goldman JA, Gahche JJ, Dwyer JT, Moshfegh AJ, Sempos CT, Picciano MF. Estimation of total usual calcium and vitamin D intakes in the United States. J Nutr. 2010;140(4):817–22. [DOI] [PMC free article] [PubMed] [Google Scholar]
- 42. Hangartner TN, Johnston CC. Influence of fat on bone measurements with dual-energy absorptiometry. Bone Miner. 1990;9(1):71–81. [DOI] [PubMed] [Google Scholar]
- 43. Tothill P. Dual-energy x-ray absorptiometry measurements of total-body bone mineral during weight change. J Clin Densitom. 2005;8(1):31–8. [DOI] [PubMed] [Google Scholar]
- 44. Yu EW, Bouxsein ML, Roy AE, Baldwin C, Cange A, Neer RM, Kaplan LM, Finkelstein JS. Bone loss after bariatric surgery: discordant results between DXA and QCT bone density. J Bone Miner Res. 2014;29(3):542–50. [DOI] [PMC free article] [PubMed] [Google Scholar]