

Abstract
Youth football helmets currently undergo the same impact testing and must satisfy the same criteria as varsity helmets, although youth football players differ from their adult counterparts in anthropometry, physiology, and impact exposure. This study aimed to relate football helmet standards testing to on-field head impact magnitudes for youth and varsity football helmets. Head impact data, filtered to include only impacts to locations in the current National Operating Committee on Standards for Athletic Equipment standard, were collected for 48 collegiate players (ages 18–23 years) and 25 youth players (ages 9–11 years) using helmet-mounted accelerometer arrays. These on-field data were compared to a series of National Operating Committee on Standards for Athletic Equipment standard drop tests with a youth and varsity Riddell Speed helmet. In the on-field data, the adult players had a higher frequency of impact than the youth players, and a significant difference in head acceleration magnitude only existed at the top location (p < 0.001). In the laboratory drop tests, the only significant difference between the youth and varsity helmets was at the 3.46 m/s (61 cm) impact to the front location (p = 0.0421). Drop tests generated head accelerations within the top 10% of measured on-field impacts, at all locations and drop heights, demonstrating that drop tests are representative of the most severe head impacts experienced by youth and adult football players on the field. Current standards have been very effective at eliminating skull fracture and severe brain injury in both populations. This analysis suggests that there is not currently a need for a youth-specific drop test standard. However, there may be such a need if helmet testing standards are updated to address concussion, paired with a better understanding of differences in concussion tolerance between youth and adult populations.
Keywords: Youth football, head acceleration, helmet standards, adult football, impact testing
Introduction
Of the estimated 5 million participants in organized football each year, approximately 70% are youth players between the ages of 6 and 13.1 Currently, youth helmets, which are intended for players younger than 14 years old, undergo an identical impact testing protocol and are held to the same performance criteria as varsity helmets in the National Operating Committee on Standards for Athletic Equipment (NOCSAE) safety standard. Essentially, all leagues require these performance criteria to be met for a helmet to be used. Although NOCSAE is in the process of developing a test standard specific to youth helmets,2 there are many challenges in determining how a youth-specific helmet standard should differ from the current helmet standard.
Notable differences exist between adult and youth football players, where adult players are defined as those players recommended to wear a varsity helmet (age 14 and older), and youth players are those below age 14. Head mass and size are about 95% of adult size at 3.5 years old and stay relatively constant until around age 10, when the head size gradually increases to full adult size around 16–17 years of age.3 However, children have a smaller body resulting in a larger head-to-body size ratio, accompanied by reduced upper body and neck musculature and strength.4 Concerns specific to brain injury in youth players include an immature central nervous system, thinner cranial bones, a larger subarachnoid space in which the brain can move, and differences in cerebral blood flow.5 While concussions are a concern, the current NOCSAE standard only addresses catastrophic head injury, such as skull fracture and severe brain injury, and has been very effective in reducing these injuries.
The NOCSAE impact testing protocol involves a series of 27 drop tests per football helmet sample, and the helmet is tested without any type of facemask. Tests are done at seven locations: front, side, front boss, rear boss, rear, top, and a random location of the tester’s choosing (Figure 1). Four impact velocities are evaluated: 3.46, 4.23, 4.88, and 5.46m/s. Two additional tests are done to the side location at the highest test velocity, with the helmet temperature increased to 46 °C. A passing helmet requires no impact to exceed a Severity Index (SI) of 1200, and no 3.46-m/s velocity impacts to exceed 300 SI.6 SI is a function of weighted linear acceleration and duration, and can be described as a correlate of energy transfer to the head, where a is acceleration and t is time (Equation (1))
| (1) |
Figure 1.
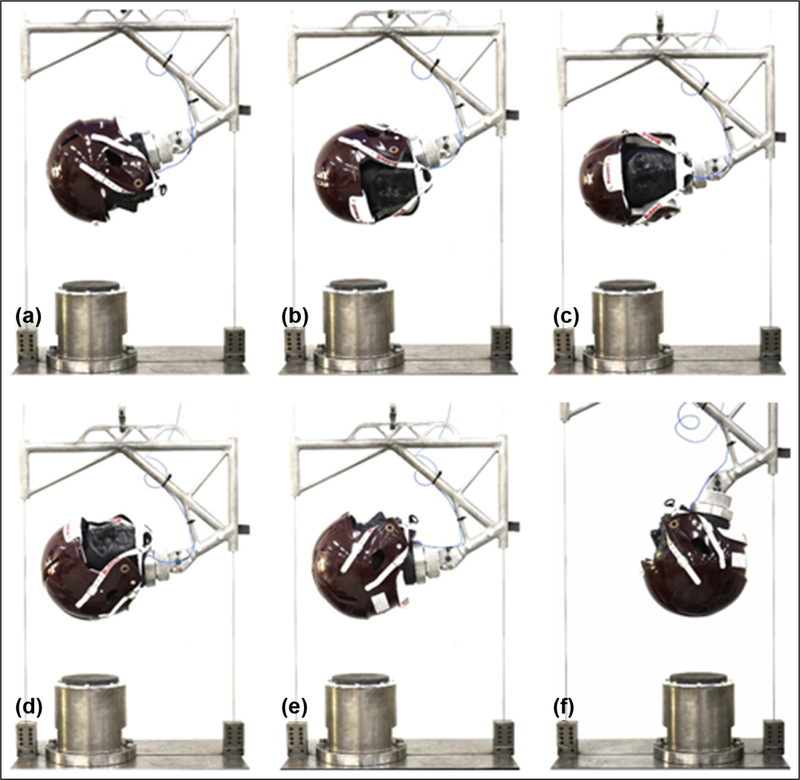
NOCSAE-defined drop test impact locations: (a) front, (b) front boss, (c) side, (d) rear boss, (e) rear, and (f) top. These locations are photographed on a medium-sized NOCSAE headform with a head circumference of 57.6 cm.6,7
Several studies investigating head impact exposure in youth football players of various age groups have demonstrated that the number of head impacts over the course of a single season and the severity of impacts increase with age (Table 1). Although high-severity impacts occur less frequently in younger players, impact magnitudes greater than 80g are recorded in all age groups.7 The amount of available research investigating head impacts in youth football players is limited in comparison to what is available for older populations.
Table 1.
The number of head impacts sustained per season increases as players increase in age; furthermore, the 95th percentile acceleration values increase with age.
| Age group (years) | No. of impacts | Linear acceleration (g) |
Rotational acceleration (rad/s2) |
||
|---|---|---|---|---|---|
| 50th | 95th | 50th | 95th | ||
| Youth (7–8)8 | 161 ± 111 | 16±2 | 38 ± 13 | 686 ± 169 | 2052 ± 664 |
| Youth (9-12)9 | 240± 147 | 18 ± 2 | 43 ± 7 | 856 ± 135 | 2034 ± 361 |
| Youth (12–14)1 | 275 ± 190 | 22 ± 2 | 54 ± 9 | 954 ± 122 | 2525 ± 450 |
| High school10 | 340 (226–532) | 22 ± 2 | 56 ± 11 | 953 ± 132 | 2519 ±536 |
| Collegiate12 | 420 (2I7–728) | 21 | 63 | 1400 | 4378 |
Values are reported as either average ± standard deviation or median (25th percentile-75th percentile), depending on how they were reported in the literature. Variance was not reported for the collegiate athlete accelerations.
Developing youth-specific helmets has proven challenging given the differences in head impact exposure, anthropometry, and possible differences in injury toler-ance.1,4,5,9,11,12 It is known that these differences exist, but it remains unknown how these differences should influence helmet design and standards testing. Furthermore, no data are available comparing the impact performance of youth and varsity helmets. This study aimed to relate NOCSAE standard drop tests to on-field head impacts for youth and adult football players. This relating was done through the collection of on-field head impact data for both adult and youth populations and by investigating how these data relate to a set of drop tests using the helmets worn by these groups. The authors hypothesize that no differences exist between current youth and varsity helmets given that they are similar in design and that they are evaluated using the same NOCSAE testing standard. These data, in addition to providing context for the current standard, can provide insight toward the development of youth-specific helmet standards and improved youth-specific helmets, as this type of comparison has not been previously performed.
Methodology
Head impact data were collected from the Virginia Tech football team, representing an adult population, along with two youth football teams bet the ages of 9 and 11 using helmet-mounted accelerometer arrays (Head Impact Telemetry System; Simbex, Lebanon, NH, USA and Sideline Response System; Riddell, Elyria, OH, USA) in Riddell Speed helmets for the 2015 season.1,8–10,12,16 A total of 25 total youth players (ages 9–11 years) and 48 adult players (ages 18–23 years) were instrumented. From the accelerometer arrays, linear acceleration, rotational acceleration (not used in this analysis), and impact location for each impact were recorded. Approval for this study was given by the Virginia Tech Institutional Review Board (IRB). Each player provided informed consent for participation, as well as parent/guardian consent for participants under the age of 18 years.
Data collected from the accelerometer arrays were mapped to the same impact locations used by NOCSAE in the standard.6 NOCSAE defines these locations as points on the headform in relation to defined planes.6,7 These points were mapped to azimuth and elevation coordinates on the head, where azimuth is the horizontal angle and elevation is the vertical angle measured in degrees. The azimuth angles are defined by NOCSAE, and the elevation coordinates are defined by a distance above the basic and reference planes. The elevation angles were determined using these given distances along with the radius of the head, given a medium-sized NOCSAE headform (head circumference of 57.6 cm).7 To map these locations to the on-field data collected from the accelerometer arrays, each location was defined as a range of 15° in either direction for both the azimuth and elevation angles (Table 2). The on-field youth and adult data were then filtered to include only those impacts consistent with these NOCSAE standard location ranges.
Table 2.
Impact locations that were mapped to on-field data.
| Location | NOCSAE definition | Azimuth (°) | Elevation (°) |
|---|---|---|---|
| Front | Located in the median plane approximately 1 in above the anterior intersection of the median and reference plane | 0 | 30.7 |
| Front boss | A point approximately in the 45° plane from the median plane measured clockwise and located approximately above the reference plane | 45 | 30.7 |
| Side | Located approximately at the intersection of the reference and coronal planes on the right side of the headform | 90 | 17.8 |
| Rear boss | A point approximately on the reference plane located approximately 135° clockwise from the anterior intersection of the median and reference planes | 135 | 17.8 |
| Rear | Approximately at the posterior intersection of the median and reference planes | 180 | 17.8 |
| Middle | Located approximately at the intersection of the median and coronal planes. The right hand carriage release ring should be used for this drop | − | 90 |
Each location was determined by azimuth and elevation coordinates defined by National Operating Committee on Standards for Athletic Equipment (NOCSAE) and given a range of 15° in either direction to produce an area of comparable impacts from on-field data, where 0° is the front of the head at the center of gravity.6
In addition to the on-field data collection, laboratory-based NOCSAE standard drop tests were performed on the same youth and varsity large Riddell Speed helmet models as were used in the on-field data collection. Each helmet was tested at six impact locations (front, front boss, side, rear boss, rear, and top) (Figure 1) and four drop heights (61, 91, 122, and 152 cm) corresponding to the prescribed drop velocities of 3.46, 4.23, 4.88, and 5.46 m/s. Each impact configuration was repeated three times. The system was calibrated to NOCSAE specifications.7 For each test, a tri-axial accelerometer at the center of gravity of a medium NOCSAE headform was sampled at 20,000 Hz for measuring linear acceleration in the x-, y-, and z-directions, from which peak resultant linear acceleration and SI were calculated. Data were filtered using a phaseless four-pole Butterworth low-pass filter with a cutoff frequency of 1650 Hz.
Differences in the on-field acceleration data were evaluated using a two-way analysis of variance (ANOVA) for helmet type and location. Differences in drop test accelerations for the youth and varsity helmets were determined using a two-way ANOVA for helmet and location by drop height. A significance level of p < 0.05 was used during statistical comparisons. In addition, a linear-regression model was fit to the drop test data to evaluate the youth and varsity helmet performance. To relate the standard drop test conditions to the on-field head accelerations that are experienced by youth and adult football players, matched on-field head accelerations were found for each drop test head acceleration, and the representative on-field percentile impact was determined.
Results
A total of 3842 head impacts were collected for the youth players. For the average youth player, the median acceleration was 17.7 ± 2.2g, and the 95th percentile acceleration was 48.8 ± 17.8g. For the adult players, a total of 25,322 head impacts were collected over the course of the season, with the average player having a median acceleration of 20.1 ± 1.6g and 95th percentile acceleration of 60.1 ± 7.8g. After the on-field data were filtered to include only locations which are evaluated in the NOCSAE standard-732(19%) impacts for the youth data and 7043 (28%) impacts for the adult data were retained. In the filtered data, the on-field accelerations for the average youth player had a median of 19.3 6 3.0g and 95th percentile of 44 ± 12.5g, and the average adult player had a median impact of 19.9 ± 2.4g and 95th percentile of 57 ± 8.7g. In comparing distributions of on-field acceleration data between youth and adult football players, a significant difference existed for the top location (p < 0.001). All other locations had no significant differences (front, p = 0.9997; front boss, p = 1; side, p = 0.9945; rear boss, p = 1; rear, p = 1) (Figure 2).
Figure 2.
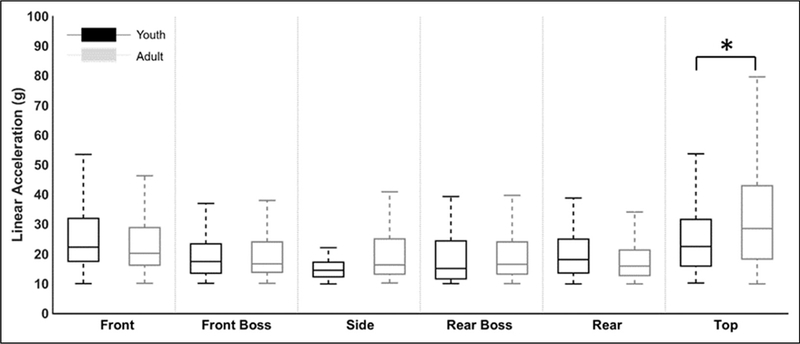
Distributions of on-field data in respect to NOCSAE locations for youth (black) and adult (gray) populations. The edges of the boxes are the 25th and 75th percentiles, with the middle representing the median. The whiskers represent 1.5 times the interquartile range. Significant differences were only found at the top location (p ˂ 0.001).
Drop tests yielded linear acceleration values between 44 and 125g and SI values between 65 and 580, with the largest SI values occurring at the 5.46-m/s drop velocity in the top location. Acceleration and SI values generated by the youth helmet during drop testing were highly correlated to acceleration and SI values generated by the varsity helmet (linear acceleration, y = 1.03x, R2 = 0.95) (SI, y = 1.02x, R2 = 0.97). On average, the varsity helmet produced linear acceleration values 3% greater and SI values 2% greater than the youth helmet (Figure 3). Identical performance would result in a slope of 1 with a R2 of 1. The only significant difference in acceleration between the youth and varsity helmets was at the 3.46-m/s impact to the front location (p = 0.0421) (Table 3). This same test condition also produced the only significant difference in SI (p = 0.0256).
Figure 3.
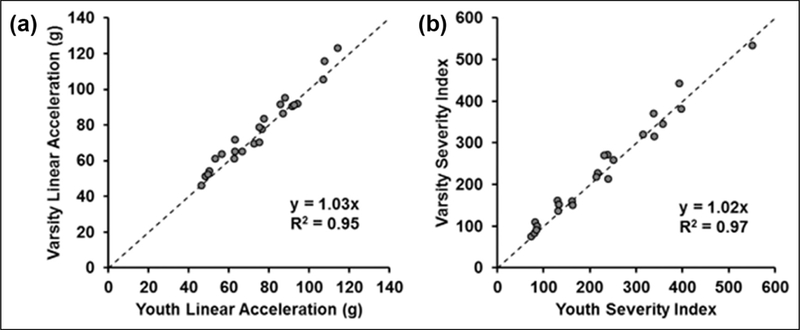
Comparison of (a) average linear acceleration and (b) average Severity Index for drop tests of a youth and varsity Riddell Speed helmet. Each point is a test condition with the dotted line representing identical performance of the youth and varsity helmet. On average, accelerations were 3% greater and Severity Index values were 2% greater in varsity helmets.
Table 3.
The equivalent on-field acceleration percentile was determined for each drop test acceleration for youth and varsity helmets..
| Drop test Laboratory |
On-field |
|||
|---|---|---|---|---|
| Linear acceleration (g) |
Percentile |
|||
| Youth | Varsity | Youth | Adult | |
| Front (m/s) 3.46a |
53 ± 2 | 61 ± 5 | 93.1 | 97.5 |
| 4.23 | 63 ± 4 | 72 ± 4 | 97.5 | 98.8 |
| 4.88 | 88 ± 4 | 95 ± 2 | 99.3 | 99.7 |
| 5.46 | 114 ± 2 | I23 ± 2 | 99.9 | 99.8 |
| Side (m/s) 3.46 |
50 ± 2 | 52 ± 1 | 98.4 | 98.3 |
| 4.23 | 63 ± 1 | 65 ± 1 | 99.4 | 100.0 |
| 4.88 | 77 ± 1 | 78 ± 1 | 100.0 | 100.0 |
| 5.46 | 92 ± 5 | 91 ± 1 | 100.0 | 100.0 |
| Rear (m/s) 3.46 |
48 ± 2 | 51 ± 3 | 98.3 | 96.0 |
| 4.23 | 67 ± 2 | 65 ± 3 | 100.0 | 98.4 |
| 4.88 | 77 ± 3 | 83 ± 7 | 100.0 | 99.0 |
| 5.46 | 94 ± 4 | 92 ± 1 | 100.0 | 99.5 |
| Front boss (m/s) 3.46 |
50 ± 1 | 54 ± 4 | 98.9 | 99.5 |
| 4.23 | 73 ± II | 70 ± 6 | 100.0 | 99.9 |
| 4.88 | 86 ± 5 | 92 ± 5 | 100.0 | 100.0 |
| 5.46 | I08 ± 5 | 116 ± 8 | 100.0 | 100.0 |
| Rear boss (m/s) 3.46 |
46 ± 3 | 46 ± 1 | 94.5 | 95.8 |
| 4.23 | 63 ± 9 | 61 ± 12 | 97.5 | 97.5 |
| 4.88 | 75 ± 7 | 70 ± 5 | 98.6 | 98.5 |
| 5.46 | 87 ± 7 | 86 ± 11 | 99.6 | 99.7 |
| Middle (m/s) 3.46 |
56±3 | 64 ± 1 | 94.9 | 92.5 |
| 4.23 | 75 ± 4 | 79 ± 3 | 99.0 | 96.3 |
| 4.88 | 93 ± 3 | 91 ± 7 | 99.9 | 98.1 |
| 5.46 | I07 ± I | I05 ± I | 100.0 | 98.9 |
All the accelerations measured in the drop tests were within the middle 10% of on-field accelerations in both youth and adult players.
Significance was only found in the front location at the 3.46-m/s drop velocity (p = 0.0421).
All accelerations measured in the drop tests were within the top 10% of impacts that were measured on field for both youth and adult players (Table 3). Among all locations, the 3.46-m/s velocity ranged from the 93.1 to 98.9 percentile on-field acceleration for youth players and the 92.5 percentile to the 99.5 percentile on-field acceleration for adults. The 4.23-m/s velocity had accelerations in the top 3% of impacts for youth players and the top 4% for adult players across all locations. Among all locations for youth and adult players, the 4.88-m/s velocity resulted in accelerations that were within the top 2% of on-field head accelerations. The 5.46-m/s velocity produced accelerations that were within the top 0.5% of on-field head accelerations for all locations in youth and adult players, with one exception (adult top = 98.9 percentile).
Discussion
This study related NOCSAE standard drop tests to on field impacts measured by helmet-mounted accelerometer arrays for youth and adult football players. While some significant differences were identified, youth and varsity helmets did not differ greatly on the field or in the lab.
This study involved the on-field measurement of head impacts for youth and adult football players over the course of one season, where the adult population consisted of college-aged players wearing varsity Riddell Speed helmets and the youth population consisted of 9- to 11-year olds wearing youth Riddell Speed helmets. The on-field data collected are similar to what have previously been reported in these populations.9,12,15 Distributions of on-field acceleration data defined by the NOCSAE locations proved to differ only at the top location. While the central tendency of the on-field accelerations did not differ greatly, 95th percentile accelerations experienced by youth (44 ± 12.5g) and adult players (60.1 ± 7.8g) did. This difference points to adult players experiencing higher magnitude accelerations more frequently than youth players. This difference is masked in the analysis relating on-field accelerations to drop tests accelerations because the majority of the NOCSAE test conditions produce accelerations in the top 2% of on-field impacts, where the tails of the distributions converge.
Matched drop tests on a youth and varsity Riddell Speed football helmet were also performed using the current standard. Both helmets have a similar design and padding, with the only difference being the shell material, where the varsity helmet shell is made of polycarbonate, and the youth helmet shell is made of acry-lonitrile butadiene styrene (ABS).17 Both materials have good impact resistance properties, but ABS is more compliant, has a lower tensile strength, is lighter, and is less expensive than polycarbonate. Considering this difference in helmet shell material, the youth and varsity Riddell Speed helmets had no significant differences in 23 of the 24 matched drop test conditions, which is the result of being tested to the same standard and of the interior padding dominating performance. This padding compresses and attenuates the impact energy transfer to the head. The shell is meant to deflect and reduce focal loading, as well as prevent penetration. The interior padding dimensions were identical between the two helmets.
All the drop tests yielded acceleration values that were above the 90th percentile for both of the on-field data sets. With one exception, the 5.46-m/s velocity produced head accelerations in the top 0.5% of the onfield head impacts. This one exception is appropriate because a helmet standard should test for the highest severity impacts experienced in actual play. In NOCSAE’s proposed draft of a youth helmet standard,2 more tests are being recommended at each location, resulting in a possible 18 additional tests compared to the current standard. Additionally, a lower threshold of 600 SI, for 4.88-m/s drops is proposed, along with the current threshold of 1200 SI for all tests. A mass limit of 1.3 kg, including all accessories, is also proposed for this standard. The youth helmet tested in this study would meet the impact criteria in the proposed standard but would not pass the proposed mass limit (m = 1.68 kg).
Given that there are no notable differences in the real-world equivalents of NOCSAE drop test configurations between youth and varsity helmets, this analysis makes the case that there is not a need for a youth-specific drop test standard. The NOCSAE football helmet standard was developed and implemented to remove catastrophic head injuries from the game of football and has been very effective in doing so. Given that there is no evidence of differences in catastrophic head injury rates between youth and adult football players, little specific benefit would be provided to youth football players with the proposed youth drop test standard. However, if NOCSAE develops a standard specific to concussion, there would likely be a need for a youth-specific football helmet testing standard. This need will become more evident as more is learned about the differences in concussion tolerances between youth and adult populations. Importantly, the analysis presented in this article could be used to inform such a standard by incorporating rotational kinematics in both on-field and laboratory data collections.
This study was limited in several ways. The standards that have been developed have been specific to skull fracture and other severe brain injuries. The implementation of these standards has been very effective in mitigating these types of injuries. However, rotational kinematics, which are known to contribute to concussion risk,18 are not included in the current standards and were not tested here. This lack of consideration of the rotational kinematics is a limitation in the current standards, and NOCSAE is developing future standards to include rotational kinematics to reflect real-world head impacts and their relation to injury. Rotational acceleration was measured in the on-field data using the accelerometer mounted arrays, and descriptive values were equivalent to those that have been previously reported for collegiate and youth players in this age group.9,12 Second, only the Riddell Speed helmet was considered, so it is unknown if helmet performance would differ with other models. Third, only one sample of each helmet was used in testing. While there may be variation between samples of the same model, this variance is typically very small. Fourth, the helmet-mounted accelerometer arrays used, on average, overestimate linear acceleration by 1% and overestimate rotational acceleration by 6%. This error is higher in individual measurements but is reduced in aggregate analyses as presented here.10,19,20 Fifth, college football players were used to represent our adult population in this study, although varsity football helmets are recommended for players over the age of 14 years. These data should describe the bounds of differences between the ages of 12 and 17, where players transition from youth to varsity helmet models.
Conclusion
Current NOCSAE helmet standards are identical for both youth and varsity helmets. In the on-field data, the only difference that was found was in the top location with respect to NOCSAE-defined locations. Additionally, only one drop test configuration was significantly different in the performance of matched drop tests for youth and varsity Riddell Speed football helmets. These data demonstrate that drop tests are representative of the most severe head impacts experienced by youth and adult football players on the field. Standards have been very effective at eliminating skull fracture and severe brain injury in both populations. This analysis suggests that there is not currently a need for a youth-specific drop test standard. However, there may be such a need if helmet testing standards are updated to address concussion, paired with differences in concussion tolerance between youth and adult populations being better understood.
Acknowledgments
Funding
The author(s) disclosed receipt of the following financial support for the research, authorship, and/or publication of this article: The research reported in this publication was supported by the National Institute of Neurological Disorders and Stroke of the National Institutes of Health under Award Number R01NS094410. The content is solely the responsibility of the authors and does not necessarily represent the official views of the National Institutes of Health.
Footnotes
Declaration of conflicting interests
The author(s) declared no potential conflicts of interest with respect to the research, authorship, and/or publication of this article.
References
- 1.Daniel RW, Rowson S and Duma SM. Head impact exposure in youth football: middle school ages 12–14 years. J Biomech Eng 2014; 136: 094501. [DOI] [PubMed] [Google Scholar]
- 2.National Operating Committee on Standards for Athletic Equipment (NOCSAE). DRAFT-standard performance specification for newly manufactured youth football helmets. Overland Park, KS: NOCSAE, 2011. [Google Scholar]
- 3.Olvey SE. Recommended standards for helmet design in children based on anthropometric and head mass measurements in 223 children ages six to seventeen. SAE technical paper no. 2006–01-3656, 2006.
- 4.Karlin AM. Concussion in the pediatric and adolescent population: “different population, different concerns.” PM R 2011; 3: S369–S379. [DOI] [PubMed] [Google Scholar]
- 5.Rivara FP and Graham R. Sports-related concussions in youth: report from the Institute of Medicine and National Research Council. JAMA 2014; 311: 239–240. [DOI] [PubMed] [Google Scholar]
- 6.National Operating Committee on Standards for Athletic Equipment (NOCSAE). Standard performance specification for newly manufactured football helmets. Overland Park, KS: NOCSAE, 2011. [Google Scholar]
- 7.National Operating Committee on Standards for Athletic Equipment (NOCSAE). Standard test method and equipment used in evaluating the performance characteristics of protective headgear/equipment. Overland Park, KS: NOCSAE, 2011. [Google Scholar]
- 8.Young TJ, Daniel RW, Rowson S, et al. Head impact exposure in youth football: elementary school ages 7–8 years and the effect of returning players. Clin J Sport Med 2014; 24: 416–421. [DOI] [PubMed] [Google Scholar]
- 9.Cobb BR, Urban JE, Davenport EM, et al. Head impact exposure in youth football: elementary school ages 9–12 years and the effect of practice structure. Ann Biomed Eng 2013; 41: 2463–2473. [DOI] [PMC free article] [PubMed] [Google Scholar]
- 10.Urban JE, Davenport EM, Golman AJ, et al. Head impact exposure in youth football: high school ages 14 to 18 years and cumulative impact analysis. Ann Biomed Eng 2013;41:2474–2487. [DOI] [PMC free article] [PubMed] [Google Scholar]
- 11.Rowson S, Bland ML, Campolettano ET, et al. Biomechanical perspectives on concussion in sport. Sports Med Arthrosc 2016; 24: 100–107. [DOI] [PMC free article] [PubMed] [Google Scholar]
- 12.Crisco JJ, Wilcox BJ, Beckwith JG, et al. Head impact exposure in collegiate football players. J Biomech 2011; 44: 2673–2678. [DOI] [PMC free article] [PubMed] [Google Scholar]
- 13.Broglio SP, Sosnoff JJ, Shin S, et al. Head impacts during high school football: a biomechanical assessment. J Athl Train 2009; 44: 342–349. [DOI] [PMC free article] [PubMed] [Google Scholar]
- 14.Mihalik JP, Bell DR, Marshall SW, et al. Measurement of head impacts in collegiate football players: an investigation of positional and event-type differences. Neurosurgery 2007; 61: 1229–1235. [DOI] [PubMed] [Google Scholar]
- 15.Duma SM, Manoogian SJ, Bussone WR, et al. Analysis of real-time head accelerations in collegiate football players. Clin J Sport Med 2005; 15: 3–8. [DOI] [PubMed] [Google Scholar]
- 16.Daniel RW, Rowson S and Duma SM. Head impact exposure in youth football. Ann Biomed Eng 2012; 40: 976–981. [DOI] [PMC free article] [PubMed] [Google Scholar]
- 17.Riddell. Riddell speed helmet, http://www.riddell.com/shop/on-field-equipment/helmets/riddell-speed-helmet.html
- 18.Rowson S and Duma SM. Brain injury prediction: assessing the combined probability of concussion using linear and rotational head acceleration. Ann Biomed Eng 2013; 41: 873–882. [DOI] [PMC free article] [PubMed] [Google Scholar]
- 19.Beckwith JG, Greenwald RM and Chu JJ. Measuring head kinematics in football: correlation between the head impact telemetry system and hybrid III headform. Ann Biomed Eng 2012; 40: 237–248. [DOI] [PMC free article] [PubMed] [Google Scholar]
- 20.Siegmund GP, Guskiewicz KM, Marshall SW, et al. Laboratory validation of two wearable sensor systems for measuring head impact severity in football players. Ann Biomed Eng 2016; 44: 1257–1274. [DOI] [PubMed] [Google Scholar]